


 |
市场调查报告书
商品编码
1699272
电线电缆市场机会、成长动力、产业趋势分析及2025-2034年预测Wire and Cable Market Opportunity, Growth Drivers, Industry Trend Analysis, and Forecast 2025-2034 |
||||||
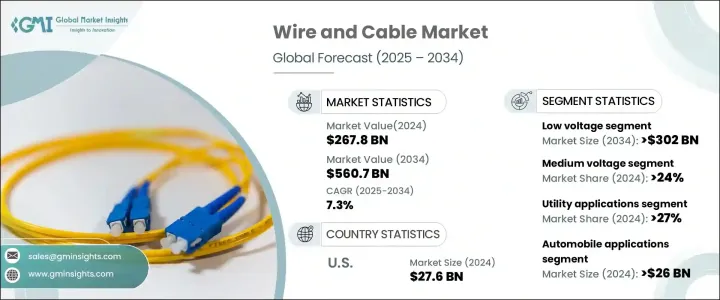
全球电线电缆市场稳步扩张,2024 年将达到 2,678 亿美元,预计 2025 年至 2034 年的复合年增长率为 7.3%。这一成长主要得益于对输配电网路现代化和扩建的持续投资,以满足全球不断增长的电力需求。不断加快的城市化和政府主导的智慧城市计画进一步扩大了对可靠电力基础设施的需求。再生能源整合的推动加速了向更清洁能源的转变,需要先进的布线解决方案来确保高效的电网连接。
同时,地缘政治挑战和供应链中断导致国内产量激增,减少了对进口的依赖,并增强了本地製造能力。这种转变透过简化物流和解决原材料供应缺口来支持基础设施发展,最终推动产业成长。住宅、商业和工业应用对阻燃、高性能电缆的需求不断增长也促进了市场扩张。该产业估值在 2022 年为 2,160 亿美元,2023 年为 2,403 亿美元,2024 年为 2,678 亿美元,反映出多个产业的强劲需求。
| 市场范围 | |
|---|---|
| 起始年份 | 2024 |
| 预测年份 | 2025-2034 |
| 起始值 | 2678亿美元 |
| 预测值 | 5607亿美元 |
| 复合年增长率 | 7.3% |
市场按电压等级分类,包括高压、中压和低压部分。受住宅和商业开发的巨大需求推动,低压电线电缆产业预计到 2034 年将超过 3,020 亿美元。这些行业正在快速发展,对安全且高效的布线解决方案的需求不断增加。随着大量资金用于改善配电网络,不断扩大的数位和智慧电网计划进一步刺激了需求。这些项目的投资加强了先进布线系统的必要性,确保了稳定且有效率的电力供应。
该行业还根据应用进行细分,涵盖公用事业、物料搬运、物流、汽车、铁路、消费性电子和建筑基础设施等广泛领域。实用程式应用程式在 2024 年占据了超过 27% 的市场份额,预计还会进一步扩大。向再生能源发电(特别是透过太阳能和风能)的转变,提高了对耐用、高效能电力电缆的需求,以促进无缝电网整合。这种转变持续影响着产业的发展轨迹,推动了对专业布线解决方案的长期需求。
美国市场一直保持持续成长势头,2022 年估值为 239 亿美元,2023 年为 256 亿美元,2024 年为 276 亿美元。这一趋势得益于美国建筑业投资的不断增加,2024 年该行业的月支出将超过 2 兆美元。智慧电气系统和永续建筑实践的日益普及进一步影响了对先进电线电缆产品的需求,从而增强了该行业未来几年的乐观前景。
目录
第一章:方法论与范围
- 市场定义
- 基础估算与计算
- 预测计算
- 资料来源
- 基本的
- 次要
- 有薪资的
- 民众
第二章:执行摘要
第三章:行业洞察
- 产业生态系统分析
- 监管格局
- 产业衝击力
- 成长动力
- 产业陷阱与挑战
- 成长潜力分析
- 波特的分析
- PESTEL分析
第四章:竞争格局
- 战略仪表板
- 创新与技术格局
第五章:市场规模及预测:依产品,2021 年至 2034 年
- 主要趋势
- 同轴电缆/电子线
- 光纤电缆
- 电源线
- 讯号和控制电缆
- 电信和资料电缆
第六章:市场规模及预测:按电压,2021 年至 2034 年
- 主要趋势
- 低的
- 中等的
- 高的
第七章:市场规模及预测:依应用,2021 年至 2034 年
- 主要趋势
- 食品和饮料
- 汽车
- 物料搬运/物流
- 娱乐/休閒
- 公用事业
- 铁路
- 消费性电子产品
- 建设基础设施
- 其他的
第八章:市场规模及预测:按地区,2021 年至 2034 年
- 主要趋势
- 北美洲
- 我们
- 加拿大
- 墨西哥
- 欧洲
- 英国
- 法国
- 荷兰
- 义大利
- 西班牙
- 瑞典
- 丹麦
- 比利时
- 德国
- 俄罗斯
- 亚太地区
- 中国
- 印度
- 日本
- 韩国
- 澳洲
- 印尼
- 菲律宾
- 纽西兰
- 马来西亚
- 泰国
- 中东和非洲
- 沙乌地阿拉伯
- 阿联酋
- 伊拉克
- 科威特
- 卡达
- 南非
- 埃及
- 奈及利亚
- 拉丁美洲
- 巴西
- 阿根廷
- 秘鲁
第九章:公司简介
- alfanar Group
- Bahra Cables
- BELDEN
- Brugg Kabel AG
- Ducab
- Elsewedy Electric
- Federal Cables
- Fujikura
- HELUKABEL MiddleEast
- Jeddah Cables
- KEI Industries
- Midal Cables
- Naficon
- Nexans
- NIBE Industrier AB
- NKT A/S
- Power Plus Cables
- Prysmian Group
- Riyadh Cables
- Saudi Cable Company
- Sumitomo Electric Industries
- ZTT
The Global Wire And Cable Market has experienced steady expansion, reaching USD 267.8 billion in 2024, with projections indicating a 7.3% CAGR from 2025 to 2034. This growth is largely driven by the continuous investment in modernizing and expanding transmission and distribution networks to meet the rising electricity demand worldwide. Increasing urbanization and government-led smart city projects are further amplifying the need for reliable electrical infrastructure. The push for renewable energy integration has accelerated the transition to cleaner power sources, requiring advanced cabling solutions to ensure efficient grid connectivity.
Meanwhile, geopolitical challenges and supply chain disruptions have led to a surge in domestic production, reducing reliance on imports and strengthening local manufacturing capabilities. This shift supports infrastructure development by streamlining logistics and addressing raw material supply gaps, ultimately propelling industry growth. Rising demand for fire-retardant, high-performance cables across residential, commercial, and industrial applications has also contributed to market expansion. The industry's valuation stood at USD 216 billion in 2022, USD 240.3 billion in 2023, and USD 267.8 billion in 2024, reflecting strong demand across multiple sectors.
| Market Scope | |
|---|---|
| Start Year | 2024 |
| Forecast Year | 2025-2034 |
| Start Value | $267.8 Billion |
| Forecast Value | $560.7 Billion |
| CAGR | 7.3% |
The market is categorized by voltage levels, including high, medium, and low voltage segments. The low-voltage wire and cable sector is projected to exceed USD 302 billion by 2034, driven by significant demand from residential and commercial developments. These industries are growing at a rapid pace, fueling the need for safe and efficient wiring solutions. Expanding digital and smart grid initiatives are further boosting demand, as large-scale funding is directed toward improving power distribution networks. Investments in these projects reinforce the necessity for advanced wiring systems, ensuring a stable and efficient electricity supply.
The industry is also segmented based on applications, covering a wide range of sectors, including utilities, material handling, logistics, automotive, railways, consumer electronics, and building infrastructure. Utility applications accounted for over 27% of the market share in 2024 and are expected to see further expansion. The transition towards renewable power generation, particularly through solar and wind energy, has heightened the need for durable and efficient power cables to facilitate seamless grid integration. This shift continues to shape the industry's trajectory, driving long-term demand for specialized wiring solutions.
The U.S. market has demonstrated consistent growth, with valuations of USD 23.9 billion in 2022, USD 25.6 billion in 2023, and USD 27.6 billion in 2024. This trend is supported by increasing investments in the country's construction sector, where monthly expenditures surpassed USD 2 trillion in 2024. The rising adoption of smart electrical systems and sustainable building practices is further influencing the demand for advanced wire and cable products, reinforcing the sector's positive outlook in the coming years.
Table of Contents
Chapter 1 Methodology & Scope
- 1.1 Market definitions
- 1.2 Base estimates & calculations
- 1.3 Forecast calculation
- 1.4 Data sources
- 1.4.1 Primary
- 1.4.2 Secondary
- 1.4.2.1 Paid
- 1.4.2.2 Public
Chapter 2 Executive Summary
- 2.1 Industry synopsis, 2021 - 2034
Chapter 3 Industry Insights
- 3.1 Industry ecosystem analysis
- 3.2 Regulatory landscape
- 3.3 Industry impact forces
- 3.3.1 Growth drivers
- 3.3.2 Industry pitfalls & challenges
- 3.4 Growth potential analysis
- 3.5 Porter's analysis
- 3.5.1 Bargaining power of suppliers
- 3.5.2 Bargaining power of buyers
- 3.5.3 Threat of new entrants
- 3.5.4 Threat of substitutes
- 3.6 PESTEL analysis
Chapter 4 Competitive landscape, 2024
- 4.1 Strategic dashboard
- 4.2 Innovation & technology landscape
Chapter 5 Market Size and Forecast, By Product, 2021 – 2034 (USD Million)
- 5.1 Key trends
- 5.2 Coaxial cables/electronic wires
- 5.3 Fiber optics cables
- 5.4 Power cables
- 5.5 Signal & control cable
- 5.6 Telecom & data cables
Chapter 6 Market Size and Forecast, By Voltage, 2021 – 2034 (USD Million)
- 6.1 Key trends
- 6.2 Low
- 6.3 Medium
- 6.4 High
Chapter 7 Market Size and Forecast, By Application, 2021 – 2034 (USD Million)
- 7.1 Key trends
- 7.2 Food & beverages
- 7.3 Automotive
- 7.4 Material handling/logistics
- 7.5 Entertainment/leisure
- 7.6 Utilities
- 7.7 Railways
- 7.8 Consumer electronics
- 7.9 Building infrastructure
- 7.10 Others
Chapter 8 Market Size and Forecast, By Region, 2021 – 2034 (MWh & USD Million)
- 8.1 Key trends
- 8.2 North America
- 8.2.1 U.S.
- 8.2.2 Canada
- 8.2.3 Mexico
- 8.3 Europe
- 8.3.1 UK
- 8.3.2 France
- 8.3.3 Netherlands
- 8.3.4 Italy
- 8.3.5 Spain
- 8.3.6 Sweden
- 8.3.7 Denmark
- 8.3.8 Belgium
- 8.3.9 Germany
- 8.3.10 Russia
- 8.4 Asia Pacific
- 8.4.1 China
- 8.4.2 India
- 8.4.3 Japan
- 8.4.4 South Korea
- 8.4.5 Australia
- 8.4.6 Indonesia
- 8.4.7 Philippines
- 8.4.8 New Zealand
- 8.4.9 Malaysia
- 8.4.10 Thailand
- 8.5 Middle East & Africa
- 8.5.1 Saudi Arabia
- 8.5.2 UAE
- 8.5.3 Iraq
- 8.5.4 Kuwait
- 8.5.5 Qatar
- 8.5.6 South Africa
- 8.5.7 Egypt
- 8.5.8 Nigeria
- 8.6 Latin America
- 8.6.1 Brazil
- 8.6.2 Argentina
- 8.6.3 Peru
Chapter 9 Company Profiles
- 9.1 alfanar Group
- 9.2 Bahra Cables
- 9.3 BELDEN
- 9.4 Brugg Kabel AG
- 9.5 Ducab
- 9.6 Elsewedy Electric
- 9.7 Federal Cables
- 9.8 Fujikura
- 9.9 HELUKABEL MiddleEast
- 9.10 Jeddah Cables
- 9.11 KEI Industries
- 9.12 Midal Cables
- 9.13 Naficon
- 9.14 Nexans
- 9.15 NIBE Industrier AB
- 9.16 NKT A/S
- 9.17 Power Plus Cables
- 9.18 Prysmian Group
- 9.19 Riyadh Cables
- 9.20 Saudi Cable Company
- 9.21 Sumitomo Electric Industries
- 9.22 ZTT
 电线电缆:市场占有率分析、产业趋势与统计、成长预测(2025-2030)
 全球干式电缆端接市场:市场规模、份额、趋势分析(按安装位置、电压、应用和地区)、展望和未来预测(2024-2031 年)
 URD 电缆市场:按类型、按安装类型、按电压类型、按销售管道、按应用 - 2025-2030 年全球预测
 2025年全球电线电缆市场报告2025年全球铝电缆市场报告
 全球电线电缆市场按产品类型、材料类型、电压、安装、最终用途行业和地区划分 - 预测至 2029 年
 SDI 电缆驱动器市场报告:2031 年趋势、预测与竞争分析2025 年全球有线电视和其他订阅节目市场报告
 商业电线电缆市场机会、成长动力、产业趋势分析及2025-2034年预测2025 年全球电缆市场报告