


 |
市场调查报告书
商品编码
1699423
连网电视市场机会、成长动力、产业趋势分析及 2025-2034 年预测Connected TV Market Opportunity, Growth Drivers, Industry Trend Analysis, and Forecast 2025-2034 |
||||||
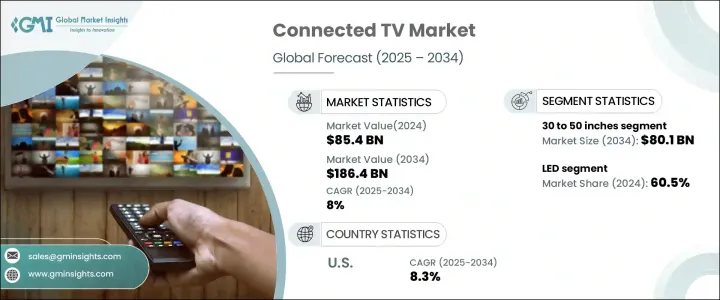
2024 年全球连网电视市场价值为 854 亿美元,预计 2025 年至 2034 年期间将以 8% 的强劲复合年增长率扩张。这一稳定增长得益于 Netflix、Hulu、Amazon Prime Video 和 Disney+ 等串流平台的日益普及。随着越来越多的消费者放弃传统的有线和卫星订阅,转而选择点播数位内容,连网电视已成为现代家庭娱乐的首选媒介。高速网路的日益普及和智慧家庭生态系统的日益普及进一步加速了市场扩张。凭藉 4K 和 8K 解析度、语音助理整合和人工智慧驱动的内容推荐等增强功能,连网电视正在彻底改变用户获取娱乐的方式,提供无缝和个人化的观看体验。
向基于互联网的电视消费的转变改变了电视行业,推动了製造商和科技公司的大量投资。随着消费者寻求与其他智慧家庭产品无缝整合的功能丰富的设备,智慧电视的普及率正在上升。人工智慧和机器学习的进步使连网电视能够提供客製化的内容推荐,优化观看体验。同时,串流媒体服务供应商继续透过独家内容扩展其产品范围,进一步吸引消费者投资高品质的智慧电视。预计这些趋势将维持市场的上升趋势,巩固连网电视在娱乐领域的主导地位。
| 市场范围 | |
|---|---|
| 起始年份 | 2024 |
| 预测年份 | 2025-2034 |
| 起始值 | 854亿美元 |
| 预测值 | 1864亿美元 |
| 复合年增长率 | 8% |
市场根据萤幕尺寸进行细分,其中 30 至 50 吋类别的收入领先。 2024 年该细分市场的价值为 354 亿美元,预计到 2034 年将达到 801 亿美元,成为家庭最喜欢的选择。这种萤幕尺寸在价格实惠和沈浸式观看体验之间达到了最佳平衡,满足了多样化的消费者群体。随着串流平台提供更多 4K 超高清内容,对此类电视的需求持续成长。中型智慧电视在城市家庭中尤其受欢迎,因为空间有限,需要紧凑而高品质的娱乐解决方案。
从技术角度来看,基于 LED 的连网电视占据主导市场份额,到 2024 年将达到 60.5%。这些电视因其节能、耐用和成本效益而仍然是首选。各种价位和萤幕尺寸的 LED 电视广泛普及,使得不同收入群体的消费者都能够轻鬆购买。同时,OLED 技术以其深黑色、高对比度和鲜艳色彩等卓越画质而闻名,并继续受到高端买家的青睐。儘管价格较高,但随着消费者对高阶家庭娱乐系统的兴趣日益浓厚,OLED 显示器的普及率有望不断提高。
美国连网电视市场年复合成长率为 8.3%,反映出消费者对先进、技术精湛的娱乐设备的强劲需求。 4K 和 8K HDR 支援、与 Alexa、Google Assistant 和 Siri 等语音助理的无缝整合以及增强的智慧家庭连接等功能使联网电视成为现代家庭的重要组成部分。高速宽频的日益普及和独家串流媒体内容库的不断扩大进一步促进了市场的成长。随着越来越多的消费者重视便利性、功能性和优质的观看体验,连网电视的需求预计将持续上升,巩固其作为未来家庭娱乐的地位。
目录
第一章:方法论与范围
- 市场范围和定义
- 基础估算与计算
- 预测参数
- 资料来源
- 基本的
- 次要
- 付费来源
- 公共资源
第二章:执行摘要
第三章:行业洞察
- 产业生态系统分析
- 影响价值链的因素
- 利润率分析
- 中断
- 未来展望
- 製造商
- 经销商
- 零售商
- 衝击力
- 成长动力
- 串流媒体平台日益普及
- 技术进步
- 各地区网路普及率不断提高
- 智慧家庭整合趋势日益增长
- 产业陷阱与挑战
- 内容碎片化
- 网路依赖
- 成长动力
- 消费者购买行为分析
- 人口趋势
- 影响购买决策的因素
- 消费者产品采用
- 首选配销通路
- 首选价格范围
- 成长潜力分析
- 监管格局
- 定价分析
- 波特的分析
- PESTEL分析
第四章:竞争格局
- 介绍
- 公司市占率分析
- 竞争定位矩阵
- 战略展望矩阵
第五章:市场估计与预测:按萤幕尺寸类型,2021 年至 2034 年
- 主要趋势
- 小于 30 英寸
- 30英寸至50英寸
- 50英寸至70英寸
- 70吋以上
第六章:市场估计与预测:依技术,2021-2034 年
- 主要趋势
- 引领
- OLED
- 其他的
第七章:市场估计与预测:依萤幕尺寸,2021-2034
- 主要趋势
- 弯曲
- 平坦的
第八章:市场估计与预测:依决议,2021-2034 年
- 主要趋势
- 8K
- 4K
- 1080p
- 其他的
第九章:市场估计与预测:依最终用途,2021-2034
- 主要趋势
- 住宅
- 商业的
第 10 章:市场估计与预测:按配销通路,2021-2034 年
- 主要趋势
- 在线的
- 离线
第 11 章:市场估计与预测:按地区,2021 年至 2034 年
- 主要趋势
- 北美洲
- 我们
- 加拿大
- 欧洲
- 英国
- 德国
- 法国
- 义大利
- 西班牙
- 亚太地区
- 中国
- 日本
- 印度
- 韩国
- 澳洲
- 拉丁美洲
- 巴西
- 墨西哥
- MEA
- 南非
- 沙乌地阿拉伯
- 阿联酋
第十二章:公司简介
- Amazon
- Apple
- Hisense Group
- LG Electronics
- Panasonic Corporation
- Philips
- Roku, Inc.
- Samsung Electronics
- Sharp Corporation
- Skyworth Group
- Sony Corporation
- TCL Technology
- Vizio Inc.
- Xiaomi Corporation
The Global Connected TV Market was valued at USD 85.4 billion in 2024 and is projected to expand at a robust CAGR of 8% from 2025 to 2034. This steady growth is fueled by the surging popularity of streaming platforms such as Netflix, Hulu, Amazon Prime Video, and Disney+. As more consumers shift away from traditional cable and satellite subscriptions in favor of on-demand digital content, connected TVs have become the preferred medium for modern home entertainment. The increasing availability of high-speed internet and the growing adoption of smart home ecosystems further accelerate market expansion. With enhanced features such as 4K and 8K resolution, voice assistant integration, and AI-driven content recommendations, connected TVs are revolutionizing how users access entertainment, providing a seamless and personalized viewing experience.
The shift toward internet-based television consumption has transformed the TV industry, driving significant investments from manufacturers and tech companies. Smart TV penetration is rising as consumers seek feature-rich devices that integrate seamlessly with other smart home products. Advancements in artificial intelligence and machine learning enable connected TVs to offer tailored content recommendations, optimizing the viewing experience. Meanwhile, streaming service providers continue to expand their offerings with exclusive content, further enticing consumers to invest in high-quality smart TVs. These trends are expected to sustain the market's upward trajectory, solidifying the dominance of connected TVs in the entertainment sector.
| Market Scope | |
|---|---|
| Start Year | 2024 |
| Forecast Year | 2025-2034 |
| Start Value | $85.4 Billion |
| Forecast Value | $186.4 Billion |
| CAGR | 8% |
The market is segmented based on screen size, with the 30 to 50-inch category leading in revenue. Valued at USD 35.4 billion in 2024, this segment is projected to reach USD 80.1 billion by 2034, making it the most preferred choice for households. This screen size strikes an optimal balance between affordability and immersive viewing, catering to a diverse consumer base. With streaming platforms offering more 4K Ultra HD content, the demand for televisions in this category continues to grow. Mid-sized smart TVs are particularly popular in urban homes, where space constraints require a compact yet high-quality entertainment solution.
From a technology standpoint, LED-based connected TVs hold the dominant market share, accounting for 60.5% in 2024. These TVs remain a top choice due to their energy efficiency, durability, and cost-effectiveness. The widespread availability of LED TVs in various price ranges and screen sizes makes them highly accessible to consumers across different income groups. Meanwhile, OLED technology, known for delivering superior picture quality with deep blacks, high contrast, and vibrant colors, continues to gain traction among premium buyers. Despite its higher price point, OLED displays are expected to see increasing adoption, driven by growing consumer interest in high-end home entertainment systems.
U.S. Connected TV Market is witnessing an annual CAGR of 8.3%, reflecting strong consumer demand for advanced, tech-savvy entertainment devices. Features such as 4K and 8K HDR support, seamless integration with voice assistants like Alexa, Google Assistant, and Siri, and enhanced smart home connectivity make connected TVs an essential part of modern households. The growing penetration of high-speed broadband and expanding library of exclusive streaming content further contribute to market growth. As more consumers prioritize convenience, functionality, and premium viewing experiences, the demand for connected TVs is expected to rise consistently, cementing their role as the future of home entertainment.
Table of Contents
Chapter 1 Methodology & Scope
- 1.1 Market scope & definition
- 1.2 Base estimates & calculations
- 1.3 Forecast parameters
- 1.4 Data sources
- 1.4.1 Primary
- 1.5 Secondary
- 1.5.1.1 Paid sources
- 1.5.1.2 Public sources
Chapter 2 Executive Summary
- 2.1 Industry synopsis, 2021 - 2034
Chapter 3 Industry Insights
- 3.1 Industry ecosystem analysis
- 3.1.1 Factor affecting the value chain
- 3.1.2 Profit margin analysis
- 3.1.3 Disruptions
- 3.1.4 Future outlook
- 3.1.5 Manufacturers
- 3.1.6 Distributors
- 3.1.7 Retailers
- 3.2 Impact forces
- 3.2.1 Growth drivers
- 3.2.1.1 Growing popularity of streaming platforms
- 3.2.1.2 Technological advancements
- 3.2.1.3 Increasing internet penetration across regions
- 3.2.1.4 Growing smart home integration trends
- 3.2.2 Industry pitfalls & challenges
- 3.2.2.1 Content fragmentation
- 3.2.2.2 Internet dependency
- 3.2.1 Growth drivers
- 3.3 Consumer buying behavior analysis
- 3.3.1 Demographic trends
- 3.3.2 Factors affecting buying decision
- 3.3.3 Consumer product adoption
- 3.3.4 Preferred distribution channel
- 3.3.5 Preferred price range
- 3.4 Growth potential analysis
- 3.5 Regulatory landscape
- 3.6 Pricing analysis
- 3.7 Porter's analysis
- 3.8 PESTEL analysis
Chapter 4 Competitive Landscape, 2024
- 4.1 Introduction
- 4.2 Company market share analysis
- 4.3 Competitive positioning matrix
- 4.4 Strategic outlook matrix
Chapter 5 Market Estimates and Forecast, By Screen Size, 2021 – 2034 (USD Billion) (Thousand Units)
- 5.1 Key trends
- 5.2 Less than 30 inches
- 5.3 30 inches to 50 inches
- 5.4 50 inches to 70 inches
- 5.5 Above 70 inches
Chapter 6 Market Estimates & Forecast, By Technology, 2021-2034 (USD Billion) (Thousand Units)
- 6.1 Key trends
- 6.2 LED
- 6.3 OLED
- 6.4 Others
Chapter 7 Market Estimates & Forecast, By Screen Type, 2021-2034 (USD Billion) (Thousand Units)
- 7.1 Key trends
- 7.2 Curved
- 7.3 Flat
Chapter 8 Market Estimates & Forecast, By Resolution, 2021-2034 (USD Billion) (Thousand Units)
- 8.1 Key trends
- 8.2 8K
- 8.3 4K
- 8.4 1080p
- 8.5 Others
Chapter 9 Market Estimates & Forecast, By End Use, 2021-2034 (USD Billion) (Thousand Units)
- 9.1 Key trends
- 9.2 Residential
- 9.3 Commercial
Chapter 10 Market Estimates & Forecast, By Distribution Channel, 2021-2034 (USD Billion) (Thousand Units)
- 10.1 Key trends
- 10.2 Online
- 10.3 Offline
Chapter 11 Market Estimates & Forecast, By Region, 2021 – 2034, (USD Billion) (Thousand Units)
- 11.1 Key trends
- 11.2 North America
- 11.2.1 U.S.
- 11.2.2 Canada
- 11.3 Europe
- 11.3.1 UK
- 11.3.2 Germany
- 11.3.3 France
- 11.3.4 Italy
- 11.3.5 Spain
- 11.4 Asia Pacific
- 11.4.1 China
- 11.4.2 Japan
- 11.4.3 India
- 11.4.4 South Korea
- 11.4.5 Australia
- 11.5 Latin America
- 11.5.1 Brazil
- 11.5.2 Mexico
- 11.6 MEA
- 11.6.1 South Africa
- 11.6.2 Saudi Arabia
- 11.6.3 UAE
Chapter 12 Company Profiles (Business Overview, Financial Data, Product Landscape, Strategic Outlook, SWOT Analysis)
- 12.1 Amazon
- 12.2 Apple
- 12.3 Google
- 12.4 Hisense Group
- 12.5 LG Electronics
- 12.6 Panasonic Corporation
- 12.7 Philips
- 12.8 Roku, Inc.
- 12.9 Samsung Electronics
- 12.10 Sharp Corporation
- 12.11 Skyworth Group
- 12.12 Sony Corporation
- 12.13 TCL Technology
- 12.14 Vizio Inc.
- 12.15 Xiaomi Corporation
 2026年全球免费广告支援串流电视(FAST)市场报告
 联网电视市场分析及预测(至2035年):按类型、产品类型、服务、技术、组件、应用、形式、设备、最终用户和功能划分2026年全球连网电视市场报告
 联网电视市场规模、份额、趋势分析报告:按萤幕尺寸、分布、技术、地区、细分市场预测,2025-2030 年
 联网电视市场规模、份额及成长分析(按萤幕大小、技术、萤幕类型、解析度、作业系统、连线功能、智慧功能和地区)-2025-2032 年产业预测
 联网电视-市场占有率分析、产业趋势与统计、成长预测(2025-2030 年)
 联网电视市场:全球产业分析,规模,占有率,成长,趋势,预测,2024年~2031年