


 |
市场调查报告书
商品编码
1721473
扩增实境包装市场机会、成长动力、产业趋势分析及 2025 - 2034 年预测Augmented Reality Packaging Market Opportunity, Growth Drivers, Industry Trend Analysis, and Forecast 2025 - 2034 |
||||||
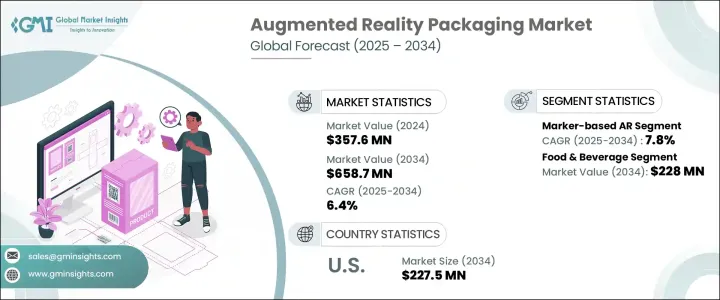
2024 年全球扩增实境包装市场价值为 3.576 亿美元,预计到 2034 年将以 6.4% 的复合年增长率成长,达到 6.587 亿美元。消费者行为的快速变化、对个人化体验的期望不断增长以及数位经济的稳定扩张正在重塑包装产业。各行业的品牌正逐渐从传统的包装方法转向智慧、互动的替代方法,以提升顾客参与。透过将 AR 技术直接整合到产品包装中,企业可以提供身临其境的故事叙述、产品演示和即时详细见解,为消费者在销售点提供难忘且资讯丰富的体验。这一趋势正在创造一种范式转变,尤其是在零售和电子商务领域,AR 正在成为推动转换、品牌忠诚度和购买后满意度的重要工具。智慧型手机普及率的提高以及消费者愿意与数位覆盖进行互动以增强产品理解,进一步推动了市场的发展势头。在差异化至关重要的领域中,AR 包装是实体产品和数位体验之间的宝贵桥樑。
随着线上零售商寻求新方法来降低产品不确定性和退货率,AR 与包装的日益融合与电子商务的繁荣紧密相关。 AR 包装使消费者能够在做出购买决定之前在现实环境中看到产品。这种能力不仅可以提高买家信心,而且还有助于提高品牌认知度并减少购买后的不和谐。随着企业努力在各个管道提供无缝且资讯丰富的购物体验,AR 增强型包装在数位和实体零售环境中继续受到关注。
| 市场范围 | |
|---|---|
| 起始年份 | 2024 |
| 预测年份 | 2025-2034 |
| 起始值 | 3.576亿美元 |
| 预测值 | 6.587亿美元 |
| 复合年增长率 | 6.4% |
市场根据技术细分为机器学习、基于标记的 AR、无标记 AR、基于 GPS/位置的 AR 等。其中,基于标记的 AR 成长最快,预测期内预计复合年增长率为 7.8%。公司更喜欢这项技术,因为它简单、经济高效、用户互动一致。基于标记的 AR 利用包装上的预定义图像或二维码来触发互动内容,使品牌更容易根据行销目标客製化用户体验。事实证明,这种技术前瞻性策略在提升客户参与度和品牌故事方面非常有效。
在终端使用产业方面,食品和饮料产业表现突出,预计到 2034 年将达到 2.28 亿美元。对成分、来源和营养价值透明度的需求促使製造商加入 AR 功能,透过简单的包装扫描将相关资讯直接传递给消费者。
预计到 2034 年,光是美国扩增实境包装市场规模就将达到 2.275 亿美元,这主要得益于人们对沉浸式、数据丰富的购物体验的需求。品牌正在将传统包装转变为满足不断变化的消费者偏好的互动式数位接触点。
全球市场的关键参与者包括 BrandXR、SmartTek Solutions.LLC、Zappar(Infinite Reality)、FlippAR 和 Jasoren。这些公司透过扩展其 AR 能力、投资研发和建立策略合作伙伴关係不断创新,透过包装将下一代 AR 解决方案变为现实。
目录
第一章:方法论与范围
第二章:执行摘要
第三章:行业洞察
- 产业生态系统分析
- 产业衝击力
- 成长动力
- 对智慧和数位包装解决方案的需求不断增长
- 越来越多采用物联网和感测器技术进行即时包装优化
- 提高供应链透明度和包装可追溯性的需求日益增长
- 更加重视提升消费者体验
- 电子商务产业的不断扩张推动了对智慧、自适应包装的需求
- 产业陷阱与挑战
- 初期投资和营运成本高
- 采用率较慢
- 成长动力
- 成长潜力分析
- 监管格局
- 技术格局
- 未来市场趋势
- 差距分析
- 波特的分析
- PESTEL分析
第四章:竞争格局
- 介绍
- 公司市占率分析
- 主要市场参与者的竞争分析
- 竞争定位矩阵
- 策略仪表板
第五章:市场估计与预测:按技术,2021 年至 2034 年
- 主要趋势
- 基于标记的扩增实境
- 无标记扩增实境
- GPS/基于位置的扩增实境
- 其他的
第六章:市场估计与预测:依最终用途产业,2021 年至 2034 年
- 主要趋势
- 食品和饮料
- 製药和医疗保健
- 零售和消费品
- 化妆品和个人护理
- 汽车
- 工业品
- 其他的
第七章:市场估计与预测:按地区,2021 年至 2034 年
- 主要趋势
- 北美洲
- 我们
- 加拿大
- 欧洲
- 德国
- 英国
- 法国
- 西班牙
- 义大利
- 荷兰
- 亚太地区
- 中国
- 印度
- 澳洲
- 韩国
- 日本
- 拉丁美洲
- 巴西
- 墨西哥
- 中东和非洲
- 沙乌地阿拉伯
- 阿联酋
- 南非
第八章:公司简介
- Arloopa Studio
- BrandXR
- FlippAR
- Ink In Caps
- Jasoren
- PlugXR
- Proven Solution
- SmartTek Solutions.LLC
- THIMM Group GmbH + Co. KG
- Travancore Analytics
- Vossle
- WE/AR Studio
- Zappar (Infinite Reality)
The Global Augmented Reality Packaging Market was valued at USD 357.6 million in 2024 and is estimated to grow at a CAGR of 6.4% to reach USD 658.7 million by 2034. The rapid evolution of consumer behavior, growing expectations for personalized experiences, and the steady expansion of the digital economy are reshaping the packaging industry. Brands across sectors are increasingly shifting from conventional packaging methods to smart, interactive alternatives that elevate customer engagement. With AR technology integrated directly into product packaging, businesses are offering immersive storytelling, product demos, and detailed insights in real time-giving consumers a memorable and informative experience at the point of sale. This trend is creating a paradigm shift, especially in the retail and e-commerce spaces, where AR is becoming an essential tool for driving conversion, brand loyalty, and post-purchase satisfaction. The market's momentum is further fueled by rising smartphone penetration and the readiness of consumers to interact with digital overlays that enhance product understanding. In a landscape where differentiation is key, AR packaging serves as a valuable bridge between physical products and digital experiences.
The increasing integration of AR into packaging is tightly linked to the e-commerce boom, as online retailers seek new ways to reduce product uncertainty and return rates. AR packaging enables consumers to visualize products in their real-life environment before making a purchase decision. This ability not only improves buyer confidence but also contributes to improved brand perception and reduced post-purchase dissonance. As businesses strive to deliver a seamless and informative shopping experience across channels, AR-enhanced packaging continues to gain traction in both digital and brick-and-mortar retail environments.
| Market Scope | |
|---|---|
| Start Year | 2024 |
| Forecast Year | 2025-2034 |
| Start Value | $357.6 Million |
| Forecast Value | $658.7 Million |
| CAGR | 6.4% |
The market is segmented based on technology into machine learning, marker-based AR, markerless AR, GPS/location-based AR, and others. Among these, marker-based AR is witnessing the fastest growth, with an expected CAGR of 7.8% during the forecast period. Companies prefer this technology for its simplicity, cost-efficiency, and consistent user interactions. Marker-based AR leverages predefined images or QR codes on packaging to trigger interactive content, making it easier for brands to customize user experiences in line with marketing goals. This tech-forward strategy is proving highly effective in boosting customer engagement and brand storytelling.
In terms of end-use industries, the food and beverage segment stands out and is anticipated to reach USD 228 million by 2034. The demand for transparency regarding ingredients, sourcing, and nutritional value is prompting manufacturers to incorporate AR features that deliver relevant information directly to consumers through simple packaging scans.
The U.S. Augmented Reality Packaging Market alone is projected to hit USD 227.5 million by 2034, driven by the appetite for immersive, data-rich shopping experiences. Brands are transforming traditional packaging into interactive digital touchpoints that cater to evolving consumer preferences.
Key players in the global market include BrandXR, SmartTek Solutions.LLC, Zappar (Infinite Reality), FlippAR, and Jasoren. These companies continue to innovate by expanding their AR capabilities, investing in R&D, and forming strategic partnerships that bring next-gen AR solutions to life through packaging.
Table of Contents
Chapter 1 Methodology and Scope
- 1.1 Market scope and definitions
- 1.2 Research design
- 1.2.1 Research approach
- 1.2.2 Data collection methods
- 1.3 Base estimates and calculations
- 1.3.1 Base year calculation
- 1.3.2 Key trends for market estimation
- 1.4 Forecast model
- 1.5 Primary research and validation
- 1.5.1 Primary sources
- 1.5.2 Data mining sources
Chapter 2 Executive Summary
- 2.1 Industry 3600 synopsis
Chapter 3 Industry Insights
- 3.1 Industry ecosystem analysis
- 3.2 Industry impact forces
- 3.2.1 Growth drivers
- 3.2.1.1 Rising demand for smart and digital packaging solution
- 3.2.1.2 Increasing adoption of IoT and sensor technologies for real-time packaging optimization
- 3.2.1.3 Rising need for improved supply chain transparency and traceability in packaging
- 3.2.1.4 Increasing focus on enhancing consumer experience
- 3.2.1.5 Expanding e-commerce sector fuelling the need for smart, adaptive packaging
- 3.2.2 Industry pitfalls and challenges
- 3.2.2.1 High initial investment and operational costs
- 3.2.2.2 Slower adoption rate
- 3.2.1 Growth drivers
- 3.3 Growth potential analysis
- 3.4 Regulatory landscape
- 3.5 Technology landscape
- 3.6 Future market trends
- 3.7 Gap analysis
- 3.8 Porter’s analysis
- 3.9 PESTEL analysis
Chapter 4 Competitive Landscape, 2024
- 4.1 Introduction
- 4.2 Company market share analysis
- 4.3 Competitive analysis of major market players
- 4.4 Competitive positioning matrix
- 4.5 Strategy dashboard
Chapter 5 Market Estimates and Forecast, By Technology, 2021 – 2034 ($ Mn)
- 5.1 Key trends
- 5.2 Marker-Based AR
- 5.3 Markerless AR
- 5.4 GPS/Location-Based AR
- 5.5 Others
Chapter 6 Market Estimates and Forecast, By End Use Industry, 2021 – 2034 ($ Mn)
- 6.1 Key trends
- 6.2 Food & Beverage
- 6.3 Pharmaceuticals & Healthcare
- 6.4 Retail & Consumer Goods
- 6.5 Cosmetics & Personal Care
- 6.6 Automotive
- 6.7 Industrial goods
- 6.8 Others
Chapter 7 Market Estimates and Forecast, By Region, 2021 – 2034 ($ Mn)
- 7.1 Key trends
- 7.2 North America
- 7.2.1 U.S.
- 7.2.2 Canada
- 7.3 Europe
- 7.3.1 Germany
- 7.3.2 UK
- 7.3.3 France
- 7.3.4 Spain
- 7.3.5 Italy
- 7.3.6 Netherlands
- 7.4 Asia Pacific
- 7.4.1 China
- 7.4.2 India
- 7.4.3 Australia
- 7.4.4 South Korea
- 7.4.5 Japan
- 7.5 Latin America
- 7.5.1 Brazil
- 7.5.2 Mexico
- 7.6 Middle East and Africa
- 7.6.1 Saudi Arabia
- 7.6.2 U.A.E.
- 7.6.3 South Africa
Chapter 8 Company Profiles
- 8.1 Arloopa Studio
- 8.2 BrandXR
- 8.3 FlippAR
- 8.4 Ink In Caps
- 8.5 Jasoren
- 8.6 PlugXR
- 8.7 Proven Solution
- 8.8 SmartTek Solutions.LLC
- 8.9 THIMM Group GmbH + Co. KG
- 8.10 Travancore Analytics
- 8.11 Vossle
- 8.12 WE/AR Studio
- 8.13 Zappar (Infinite Reality)
 全球航空扩增实境与虚拟实境市场全球扩增实境(AR)购物市场
 2032 年空间运算市场预测:按解决方案、技术、最终用户和地区进行的全球分析
 扩增实境(AR) 市场 2025-20292032 年扩增实境(AR) 市场预测:按设备类型、产品、技术、应用、最终用户和地区进行的全球分析
 2025年扩增实境(AR)购物全球市场报告2032 年农业扩增实境市场预测:按组件、部署模式、技术、应用、最终用户和地区进行的全球分析2025年培训和教育领域扩增实境全球市场报告2025年扩增实境服务全球市场报告
 全球扩增实境市场研究报告 - 产业分析、规模、份额、成长、趋势及 2025 年至 2033 年预测