


 |
市场调查报告书
商品编码
1740768
即食海鲜零食市场机会、成长动力、产业趋势分析及 2025 - 2034 年预测Ready To Eat Seafood Snacks Market Opportunity, Growth Drivers, Industry Trend Analysis, and Forecast 2025 - 2034 |
||||||
2024年,全球即食海鲜零食市场规模达61亿美元,预计到2034年将以5.5%的复合年增长率成长,达到104亿美元,这得益于全球对营养丰富、高蛋白、便携零食日益增长的需求。随着越来越多的消费者养成更健康的饮食习惯,海鲜零食作为传统零食的营养丰富替代品,正迅速受到消费者的青睐。这些产品富含瘦蛋白、ω-3脂肪酸和必需营养素,使其成为寻求清洁标籤食品以促进整体健康的消费者的首选。消费者对功能性和便利性食品的消费趋势正在塑造零食产业的新时代,健康益处和成分透明度在消费者的购买决策中发挥关键作用。
如今,消费者追求的不仅是美味,他们更注重健康,更符合清洁饮食和注重健康的生活方式。即食海鲜零食刚好满足了这项需求,既方便又营养,同时又不牺牲口感。无论是健身后恢復体力、午间补给,还是旅途中的快速小吃,海鲜零食都能提供便利的解决方案,兼具高效性和便携性。这不仅是一股健康热潮,更是消费者价值观变化的体现,永续性、原料品质和透明度比以往任何时候都更重要。这促使各大品牌不断创新,专注于不含防腐剂、来源可靠且环保的产品线。
| 市场范围 | |
|---|---|
| 起始年份 | 2024 |
| 预测年份 | 2025-2034 |
| 起始值 | 61亿美元 |
| 预测值 | 104亿美元 |
| 复合年增长率 | 5.5% |
健康零食产品的支出持续成长,推动了整个海鲜零食市场的蓬勃发展。消费者更青睐保质期长、方便携带的产品,尤其是不含人工添加剂的产品。儘管各大品牌面临原材料价格波动、环境问题以及其他健康零食形式激烈竞争等挑战,但市场需求仍然强劲。北美和欧洲凭藉其较高的健康意识和强大的零售基础设施,继续引领全球市场。同时,亚太地区正在快速追赶,城镇化进程和海鲜消费的不断增长刺激了市场需求,尤其是在大都市地区。
光是海鲜罐头零食一项,2024年的销售额就高达22亿美元,并维持该品类的领先地位。它们的吸引力在于其无与伦比的便利性、持久的保质期和多功能性。消费者欣赏海鲜罐头如何轻鬆融入各种用餐场合,从独立的零食到可直接用于烹饪的食材。随着越来越多的人寻求清洁标籤产品,不含双酚A的包装和低钠配方等特性已成为领先品牌的强大差异化优势。
2024年,超市和大卖场占销售额的45.4%,占据了分销市场的主导地位。这些零售通路凭藉其广泛的产品曝光度、极具竞争力的价格以及强大的促销支持,对于实现主流应用至关重要。美国即食海鲜零食市场在2024年达到18亿美元,预计2034年将以7%的复合年增长率成长。随着人们对功能性、高蛋白和永续零食的需求不断增长,各大品牌纷纷推出美食创新产品,例如海鲜干、烟熏鱼条和风味薯片。包括Empire Foods、Bumble Bee Foods、Apex Frozen Foods和Avanti Feeds Limited在内的主要参与者正在扩大产品组合,推出优质的清洁标籤产品,同时改进包装并与零售商合作,透过全通路策略最大限度地扩大覆盖范围。
目录
第一章:方法论与范围
第二章:执行摘要
第三章:行业洞察
- 产业生态系统分析
- 影响价值链的因素
- 利润率分析
- 中断
- 未来展望
- 製造商
- 经销商
- 川普政府关税
- 对贸易的影响
- 贸易量中断
- 报復措施
- 对产业的影响
- 供给侧影响(原料)
- 主要材料价格波动
- 供应链重组
- 生产成本影响
- 需求面影响(售价)
- 价格传导至终端市场
- 市占率动态
- 消费者反应模式
- 供给侧影响(原料)
- 受影响的主要公司
- 策略产业反应
- 供应链重组
- 定价和产品策略
- 政策参与
- 展望与未来考虑
- 对贸易的影响
- 贸易统计(HS编码)
- 2021-2024年主要出口国
- 2021-2024年主要进口国
註:以上贸易统计仅针对重点国家。
- 供应商格局
- 利润率分析
- 重要新闻和倡议
- 监管格局
- 衝击力
- 成长动力
- 消费者对富含蛋白质的健康零食的偏好日益增加。
- 对方便、便携的海鲜零食产品的需求不断增长。
- 人们越来越意识到海鲜零食的营养价值。
- 产业陷阱与挑战
- 在环境问题和法规的背景下采购永续海鲜。
- 成长动力
- 成长潜力分析
- 波特的分析
- PESTEL分析
第四章:竞争格局
- 介绍
- 公司市占率分析
- 竞争定位矩阵
- 战略展望矩阵
第五章:市场估计与预测:按产品,2021 - 2034 年
- 主要趋势
- 罐装
- 《冰雪奇缘》
- 冷藏
- 其他(熏制等)
第六章:市场估计与预测:按配销通路,2021 - 2034 年
- 主要趋势
- 超市和大卖场
- 便利商店
- 网路零售
- 餐饮服务
- 专卖店
第七章:市场估计与预测:依包装类型,2021 - 2034 年
- 主要趋势
- 袋装
- 罐头
- 塑胶容器
- 托盘和盒子
第八章:市场估计与预测:按地区,2021 - 2034 年
- 主要趋势
- 北美洲
- 我们
- 加拿大
- 欧洲
- 德国
- 英国
- 法国
- 西班牙
- 义大利
- 俄罗斯
- 亚太地区
- 中国
- 印度
- 日本
- 澳洲
- 韩国
- 拉丁美洲
- 巴西
- 墨西哥
- 阿根廷
- 中东和非洲
- 沙乌地阿拉伯
- 南非
- 阿联酋
第九章:公司简介
- Thai Union Group (Thailand)
- Maruha Nichiro Corporation (Japan)
- Bumble Bee Foods (USA)
- Stavis Seafoods (USA)
- Nomad Foods (UK)
- Gorton's (USA)
- Pacific Seafood (USA)
- Apex Frozen Foods
- Empire Foods
- Avanti Feeds Limited
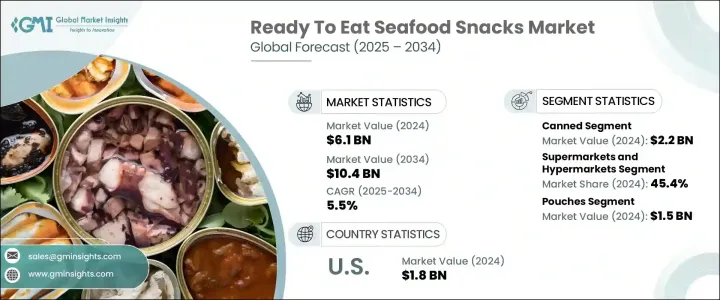
The Global Ready To Eat Seafood Snacks Market was valued at USD 6.1 billion in 2024 and is estimated to grow at a CAGR of 5.5% to reach USD 10.4 billion by 2034, driven by a growing global appetite for nutritious, high-protein, and portable snacking options. As more consumers adopt healthier eating habits, seafood snacks are rapidly gaining popularity as a nutrient-dense alternative to traditional snacks. These products are packed with lean protein, omega-3 fatty acids, and essential nutrients, making them a top choice for individuals seeking clean-label foods that support overall wellness. The shift toward functional and convenient foods is shaping a new era in the snacking category, where health benefits and ingredient transparency play key roles in purchase decisions.
Consumers today want more than just flavor-they are demanding better-for-you options that align with clean eating and wellness-focused lifestyles. Ready-to-eat seafood snacks hit that sweet spot by offering both convenience and nutrition without compromising on taste. Whether it is for post-gym recovery, midday fuel, or quick travel bites, seafood-based snacks offer an easy solution that delivers on performance and portability. The trend isn't just a health craze-it's a reflection of changing consumer values, where sustainability, ingredient quality, and transparency matter more than ever. This has pushed brands to innovate, focusing on preservative-free, responsibly sourced, and eco-friendly product lines.
| Market Scope | |
|---|---|
| Start Year | 2024 |
| Forecast Year | 2025-2034 |
| Start Value | $6.1 Billion |
| Forecast Value | $10.4 Billion |
| CAGR | 5.5% |
Spending on health-forward snack products continues to rise, encouraging growth across the seafood snack segment. Consumers gravitate toward items with extended shelf life and portability, especially when they're free from artificial additives. Although brands face hurdles like volatile raw material prices, environmental concerns, and stiff competition from other healthy snack formats, the demand remains strong. North America and Europe continue to lead the global market due to high health awareness and strong retail infrastructure. Meanwhile, Asia Pacific is catching up fast, with urbanization and rising seafood consumption fueling demand, especially in metropolitan areas.
Canned seafood snacks alone generated USD 2.2 billion in 2024 and maintain a commanding lead within the category. Their appeal lies in their unmatched convenience, long shelf stability, and versatility. Consumers appreciate how easily canned seafood fits into various eating occasions, from standalone snacks to recipe-ready ingredients. As more people seek clean-label products, features like BPA-free packaging and low-sodium formulations have become powerful differentiators for leading brands.
Supermarkets and hypermarkets accounted for 45.4% of sales in 2024, dominating the distribution landscape. These retail channels are essential for mainstream adoption thanks to wide product visibility, competitive pricing, and strong promotional support. The United States Ready-To-Eat Seafood Snacks Market reached USD 1.8 billion in 2024 and is projected to grow at a CAGR of 7% through 2034. As demand grows for functional, protein-rich, and sustainable snack options, brands are responding with gourmet innovations like seafood jerky, smoked fish strips, and flavored chips. Key players including Empire Foods, Bumble Bee Foods, Apex Frozen Foods, and Avanti Feeds Limited are expanding portfolios with premium, clean-label offerings while enhancing packaging and partnering with retailers to maximize reach through omnichannel strategies.
Table of Contents
Chapter 1 Methodology and Scope
- 1.1 Market scope and definition
- 1.2 Base estimates and calculations
- 1.3 Forecast calculation
- 1.4 Data sources
- 1.4.1 Primary
- 1.4.2 Secondary
- 1.4.2.1 Paid sources
- 1.4.2.2 Public sources
- 1.5 Primary research and validation
- 1.5.1 Primary sources
- 1.5.2 Data mining sources
Chapter 2 Executive Summary
- 2.1 Industry synopsis, 2021 - 2034
Chapter 3 Industry Insights
- 3.1 Industry ecosystem analysis
- 3.1.1 Factor affecting the value chain
- 3.1.2 Profit margin analysis
- 3.1.3 Disruptions
- 3.1.4 Future outlook
- 3.1.5 Manufacturers
- 3.1.6 Distributors
- 3.2 Trump administration tariffs
- 3.2.1 Impact on trade
- 3.2.1.1 Trade volume disruptions
- 3.2.1.2 Retaliatory measures
- 3.2.2 Impact on the industry
- 3.2.2.1 Supply-side impact (raw materials)
- 3.2.2.1.1 Price volatility in key materials
- 3.2.2.1.2 Supply chain restructuring
- 3.2.2.1.3 Production cost implications
- 3.2.2.2 Demand-side impact (selling price)
- 3.2.2.2.1 Price transmission to end markets
- 3.2.2.2.2 Market share dynamics
- 3.2.2.2.3 Consumer response patterns
- 3.2.2.1 Supply-side impact (raw materials)
- 3.2.3 Key companies impacted
- 3.2.4 Strategic industry responses
- 3.2.4.1 Supply chain reconfiguration
- 3.2.4.2 Pricing and product strategies
- 3.2.4.3 Policy engagement
- 3.2.5 Outlook and future considerations
- 3.2.1 Impact on trade
- 3.3 Trade statistics (HS Code)
- 3.3.1 Major exporting countries, 2021-2024 (Kilo Tons)
- 3.3.2 Major importing countries, 2021-2024 (Kilo Tons)
Note: the above trade statistics will be provided for key countries only.
- 3.4 Supplier landscape
- 3.5 Profit margin analysis
- 3.6 Key news and initiatives
- 3.7 Regulatory landscape
- 3.8 Impact forces
- 3.8.1 Growth drivers
- 3.8.1.1 Increasing consumer preference for protein-rich, healthy snack options.
- 3.8.1.2 Rising demand for convenient, on-the-go seafood-based snack products.
- 3.8.1.3 Growing awareness of the nutritional benefits of seafood snacks.
- 3.8.2 Industry pitfalls and challenges
- 3.8.2.1 Sourcing sustainable seafood amidst environmental concerns and regulations.
- 3.8.1 Growth drivers
- 3.9 Growth potential analysis
- 3.10 Porter's analysis
- 3.11 PESTEL analysis
Chapter 4 Competitive Landscape, 2024
- 4.1 Introduction
- 4.2 Company market share analysis
- 4.3 Competitive positioning matrix
- 4.4 Strategic outlook matrix
Chapter 5 Market Estimates and Forecast, By Product, 2021 - 2034 (USD Million) (Kilo Tons)
- 5.1 Key trends
- 5.2 Canned
- 5.3 Frozen
- 5.4 Chilled
- 5.5 Others (smoked & etc.)
Chapter 6 Market Estimates and Forecast, By Distribution Channel, 2021 - 2034 (USD Million) (Kilo Tons)
- 6.1 Key trends
- 6.2 Supermarket & hypermarket
- 6.3 Convenience stores
- 6.4 Online retail
- 6.5 Foodservice
- 6.6 Speciality stores
Chapter 7 Market Estimates and Forecast, By Packaging Type, 2021 - 2034 (USD Million) (Kilo Tons)
- 7.1 Key trends
- 7.2 Pouches
- 7.3 Cans
- 7.4 Plastic containers
- 7.5 Trays & boxes
Chapter 8 Market Estimates and Forecast, By Region, 2021 - 2034 (USD Million) (Kilo Tons)
- 8.1 Key trends
- 8.2 North America
- 8.2.1 U.S.
- 8.2.2 Canada
- 8.3 Europe
- 8.3.1 Germany
- 8.3.2 UK
- 8.3.3 France
- 8.3.4 Spain
- 8.3.5 Italy
- 8.3.6 Russia
- 8.4 Asia Pacific
- 8.4.1 China
- 8.4.2 India
- 8.4.3 Japan
- 8.4.4 Australia
- 8.4.5 South Korea
- 8.5 Latin America
- 8.5.1 Brazil
- 8.5.2 Mexico
- 8.5.3 Argentina
- 8.6 Middle East and Africa
- 8.6.1 Saudi Arabia
- 8.6.2 South Africa
- 8.6.3 UAE
Chapter 9 Company Profiles
- 9.1 Thai Union Group (Thailand)
- 9.2 Maruha Nichiro Corporation (Japan)
- 9.3 Bumble Bee Foods (USA)
- 9.4 Stavis Seafoods (USA)
- 9.5 Nomad Foods (UK)
- 9.6 Gorton's (USA)
- 9.7 Pacific Seafood (USA)
- 9.8 Apex Frozen Foods
- 9.9 Empire Foods
- 9.10 Avanti Feeds Limited
 冷冻食品市场规模、份额、成长及全球产业分析:按类型、应用和地区划分,并预测至2026-2034年
 冷冻食品市场-全球产业规模、份额、趋势、机会及预测(按产品、类型、最终用户、分销管道、地区和竞争格局划分,2021-2031年)
 冷冻熟食市场机会、成长动力、产业趋势分析及 2025 - 2034 年预测冷冻食品市场机会、成长动力、产业趋势分析及 2025 - 2034 年预测冷冻食品市场:2025-2030 年预测
 冷冻食品全球市场:各产品类型,各流通管道,各地区-市场规模,产业动态,机会分析,预测(2025年~2033年)全球冷冻熟食市场-按产品类型、通路、地区和预测分類的市场规模
 按类型、分销管道和地区分類的冷冻食品市场
 2033 年冷冻食品市场分析与预测:按类型、产品、技术、应用、形式、材料类型、最终用户、流程、设备
 冷冻食品全球市场:市场规模·占有率·趋势,产业分析 (各产品·各冷冻技术·各流通管道·各地区),未来预测 (2025年~2034年)