


 |
市场调查报告书
商品编码
1750306
先进光学材料市场机会、成长动力、产业趋势分析及 2025 - 2034 年预测Advanced Optics Material Market Opportunity, Growth Drivers, Industry Trend Analysis, and Forecast 2025 - 2034 |
||||||
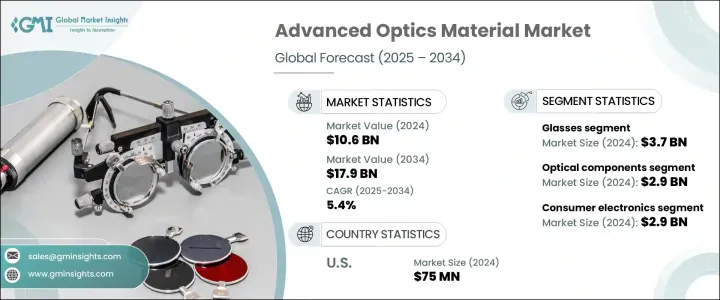
2024年,全球先进光学材料市场规模达106亿美元,预计到2034年将以5.4%的复合年增长率成长,达到179亿美元,这得益于各行各业对精密高性能光学元件日益增长的需求。扩增实境(AR)、虚拟实境(VR)、雷射雷达(LiDAR)和数位技术的快速普及,提升了先进光学元件在汽车系统、智慧消费性电子产品和国防应用中的重要性。同样,对微创诊断和即时健康监测的日益依赖,也推动了精密光学元件在医疗保健领域的应用。
製造业的进步,尤其是透过人工智慧驱动的积层製造和雷射辅助工艺,正在使客製化光学元件更加可行且更具可扩展性。这些技术正在缩短生产时间、最大限度地减少浪费,并实现复杂光学几何形状所需的精度,这在航太、国防和生物医学成像等领域尤其有价值。同时,奈米结构和元光学材料的持续研究推动着各种应用中更紧凑、更轻、更高效的光学解决方案的演变。这些新一代材料对光的行为(例如在奈米级的弯曲、滤波或聚焦)提供了前所未有的控制,为扩增实境、量子运算和光子晶片的革命性发展铺平了道路。这些创新共同设定了新的性能基准,并拓展了先进光学的前沿。
| 市场范围 | |
|---|---|
| 起始年份 | 2024 |
| 预测年份 | 2025-2034 |
| 起始值 | 106亿美元 |
| 预测值 | 179亿美元 |
| 复合年增长率 | 5.4% |
就材料而言,2024年玻璃占35.3%的市场份额,估值达37亿美元。玻璃因其卓越的清晰度和热稳定性,在高性能镜头和精密光学元件中备受青睐。然而,聚合物基替代品因其成本效益和轻量化特性,在消费性电子产品和医疗器材领域也逐渐普及。新型聚合物成分具有更强的抗紫外线和折射性能,进一步拓展了其应用范围。此外,蓝宝石和铌酸锂等特殊材料因其耐热性和双折射特性,在高频和雷射系统中日益受到青睐。
消费电子领域在2024年的市场规模为29亿美元,预计到2034年的复合年增长率为5.9%。智慧眼镜、可折迭显示器以及紧凑型高解析度摄影机的进步,推动了对多功能且节省空间的光学材料的需求。医疗保健领域将光学元件整合到诊断工具、手术设备和生物相容性仪器中,以提高精确度和病患安全性。在国防和工业安全领域,能够承受极端温度并提供高解析度监控和瞄准的坚固耐用的光学元件的需求正在不断增长。
美国先进光学材料市场规模达7,500万美元,预计年复合成长率将达到6.9%,这得益于该地区航太、国防和科技开发活动的集中。政府和私人部门在光子学、整合光学和量子技术领域的大量投资,进一步推动了氮化硅和铌酸锂等新型材料在下一代通讯和感测应用中的应用。
该行业的领先公司包括豪雅 (Hoya Corporation)、爱特蒙特光学 (Edmund Optics)、CoorsTek、贺利氏控股 (Heraeus Holding) 和康宁公司 (Corning Incorporated)。这些公司专注于扩大研发投入、进行跨产业合作并增强製造能力。透过在材料科学领域进行创新并顺应新兴技术趋势,这些公司旨在保持其全球领先地位,并满足传统和颠覆性应用领域不断变化的客户需求。
目录
第一章:方法论与范围
第二章:执行摘要
第三章:行业洞察
- 产业生态系统分析
- 影响价值链的因素
- 利润率分析
- 中断
- 未来展望
- 製造商
- 经销商
- 川普政府关税
- 对贸易的影响
- 贸易量中断
- 报復措施
- 对产业的影响
- 供应方影响(原料)
- 主要材料价格波动
- 供应链结构
- 生产成本影响
- 供应方影响(原料)
- 需求面影响(售价)
- 价格传导至终端市场
- 市占率动态
- 消费者反应模式
- 受影响的主要公司
- 策略产业反应
- 供应链重组
- 定价和产品策略
- 政策参与
- 展望与未来考虑
- 对贸易的影响
- 贸易统计资料(HS 编码) 註:以上贸易统计仅提供重点国家。
- 2021-2024年主要出口国
- 2021-2024年主要进口国
- 供应商格局
- 利润率分析
- 重要新闻和倡议
- 监管格局
- 衝击力
- 成长动力
- 对高性能光学元件的需求不断增长
- 光子学和量子光学的进展
- 电信领域的应用日益增多
- 医疗保健和医疗器材领域的采用率不断上升
- 产业陷阱与挑战
- 生产成本高
- 原料供应
- 监管挑战
- 成长动力
- 市场机会
- 扩增实境和虚拟实境的新兴应用
- 对先进感测技术的需求不断增长
- 自动驾驶汽车系统的扩展
- 仿生光学材料的开发
- 成长潜力分析
- 监理框架分析
- REACH和ROHS法规
- 出口管制法规
- 环境合规要求
- 处理和加工的安全标准
- 技术格局
- 当前的技术趋势
- 新兴技术
- 研发措施与创新管道
- 专利分析
- 波特的分析
- PESTEL分析
第四章:竞争格局
- 介绍
- 市占率分析
- 全球製造商市场份额
- 各製造商的区域市场份额
- 竞争基准测试
- 产品组合比较
- 技术能力比较
- 研发投入对比
- 製造能力比较
- 策略倡议和发展
- 併购
- 伙伴关係与合作
- 产品发布和创新
- 扩张计划
- 竞争定位矩阵
- 战略仪表板
第五章:市场估计与预测:依材料类型,2021-2034
- 主要趋势
- 玻璃材质
- 光学玻璃
- 熔融石英
- 硼硅酸盐玻璃
- 特种玻璃
- 其他的
- 聚合物材料
- 聚甲基丙烯酸甲酯(PMMA)
- 聚碳酸酯(PC)
- 环状烯烃聚合物(COP)
- 环烯烃共聚物(COC)
- 其他的
- 晶体材料
- 蓝宝石
- 硅
- 鎗
- 硒化锌
- 氟化钙
- 其他的
- 陶瓷材料
- 透明陶瓷
- 氧氮化铝(ALON)
- 镁铝尖晶石
- 钇铝石榴石(YAG)
- 其他的
- 金属材料
- 铝
- 银
- 金子
- 其他的
- 先进复合材料
- 光子晶体
- 超材料
- 奈米材料
- 其他的
第六章:市场估计与预测:按应用,2021-2034
- 主要趋势
- 光学元件
- 镜头
- 镜子
- 棱镜
- 视窗
- 过滤器
- 绕射光栅
- 其他的
- 光电器件
- 发光二极体 (LED)
- 雷射二极体
- 光电探测器
- 太阳能电池
- 光调製器
- 其他的
- 影像系统
- 相机
- 显微镜
- 望远镜
- 热成像
- 其他的
- 光通讯
- 光纤
- 波导
- 光放大器
- 光开关
- 其他的
- 感测与测量
- 光学感测器
- 光谱学
- 干涉测量法
- 其他的
- 显示技术
- LCD显示器
- OLED显示器
- AR/VR显示器
- 其他的
- 其他的
第七章:市场估计与预测:按最终用途产业,2021-2034 年
- 主要趋势
- 消费性电子产品
- 智慧型手机
- 相机
- 穿戴式装置
- 其他的
- 医疗保健
- 诊断设备
- 手术器械
- 治疗系统
- 医学影像
- 其他的
- 国防和安全
- 夜视
- 瞄准系统
- 监视
- 其他的
- 电信
- 光网路
- 资料中心
- 5G基础设施
- 其他的
- 汽车
- 照明系统
- 抬头显示器
- 光达系统
- 驾驶员辅助系统
- 其他的
- 航太
- 航空电子设备
- 导航系统
- 卫星组件
- 其他的
- 工业的
- 机器视觉
- 雷射加工
- 品质管制
- 其他的
- 活力
- 太阳能
- 光电
- 其他的
- 研究与开发
- 其他的
第八章:市场估计与预测:按地区,2021-2034
- 主要趋势
- 北美洲
- 我们
- 加拿大
- 欧洲
- 英国
- 德国
- 法国
- 义大利
- 西班牙
- 欧洲其他地区
- 亚太地区
- 中国
- 印度
- 日本
- 韩国
- 澳洲
- 亚太其他地区
- 拉丁美洲
- 巴西
- 墨西哥
- 阿根廷
- 拉丁美洲其他地区
- MEA
- 南非
- 沙乌地阿拉伯
- 阿联酋
- 中东和非洲其他地区
第九章:公司简介
- CoorsTek
- Corning Incorporated
- Edmund Optics
- Heraeus Holding
- Hoya Corporation
- II-VI Incorporated
- Materion Corporation
- Newport Corporation
- Nikon Corporation
- Ohara Corporation
- SCHOTT
- Sumitomo Electric Industries
- Surmet Corporation
- Thorlabs
- ZEISS Group
The Global Advanced Optics Material Market was valued at USD 10.6 billion in 2024 and is estimated to grow at a CAGR of 5.4% to reach USD 17.9 billion by 2034, driven by the increasing demand for precise, high-performance optical components across multiple industries. Rapid adoption of AR, VR, LiDAR, and digital technologies elevates the importance of advanced optics in automotive systems, smart consumer electronics, and defense applications. Similarly, the growing reliance on minimally invasive diagnostics and real-time health monitoring is boosting the adoption of precision optics in the healthcare sector.
Advancements in manufacturing, particularly through AI-driven additive and laser-assisted processes, are making custom optical parts more feasible and scalable. These technologies are reducing production time, minimizing waste, and enabling the precision required for intricate optical geometries, which is especially valuable in fields like aerospace, defense, and biomedical imaging. In parallel, ongoing research in nanostructured and meta-optical materials drives the evolution of more compact, lightweight, and efficient optical solutions across diverse applications. These next-generation materials offer unprecedented control over light behavior, such as bending, filtering, or focusing at nanoscale levels, paving the way for revolutionary developments in augmented reality, quantum computing, and photonic chips. Together, these innovations are setting new performance benchmarks and expanding the frontier of advanced optics.
| Market Scope | |
|---|---|
| Start Year | 2024 |
| Forecast Year | 2025-2034 |
| Start Value | $10.6 Billion |
| Forecast Value | $17.9 Billion |
| CAGR | 5.4% |
In terms of material, glass held 35.3% market share in 2024 with a valuation of USD 3.7 billion. Glass is favored for its superior clarity and heat stability in high-performance lenses and precision optics. However, polymer-based alternatives gain ground in consumer electronics and medical instruments due to their cost-effectiveness and lightweight properties. Newer polymer compositions with enhanced UV resistance and refractive performance expand their utility. Additionally, specialty materials such as sapphire and lithium niobate are gaining prominence in high-frequency and laser-based systems due to their thermal durability and birefringence characteristics.
The consumer electronics segment accounted for USD 2.9 billion in 2024, with a projected CAGR of 5.9% through 2034. Advancements in smart glasses, foldable displays, and compact, high-resolution cameras fuel demand for multifunctional and space-efficient optical materials. The healthcare sector integrates optics into diagnostic tools, surgical devices, and biocompatible instruments, enhancing precision and patient safety. In defense and industrial security, rugged optics that can withstand extreme temperatures and deliver high-resolution surveillance and targeting are seeing rising demand.
United States Advanced Optics Material Market reached USD 75 million and is expected to grow at a 6.9% CAGR, underpinned by a concentration of aerospace, defense, and tech development activities across the region. Substantial government and private investment in photonics, integrated optics, and quantum technologies is further propelling the use of novel materials like silicon nitride and lithium niobate in next-gen communication and sensing applications.
Leading companies in this industry include Hoya Corporation, Edmund Optics, CoorsTek, Heraeus Holding, and Corning Incorporated. These players focus on expanding R&D investments, forming cross-industry collaborations, and strengthening their manufacturing capabilities. By innovating in material science and aligning with emerging tech trends, these companies aim to maintain their global leadership and meet evolving customer needs in traditional and disruptive application areas.
Table of Contents
Chapter 1 Methodology & Scope
- 1.1 Market scope & definitions
- 1.2 Base estimates & calculations
- 1.3 Forecast calculations
- 1.4 Data sources
- 1.4.1 Primary
- 1.4.2 Secondary
- 1.4.2.1 Paid sources
- 1.4.2.2 Public sources
Chapter 2 Executive Summary
- 2.1 Industry synopsis, 2021-2034
Chapter 3 Industry Insights
- 3.1 Industry ecosystem analysis
- 3.1.1 Factor affecting the value chain
- 3.1.2 Profit margin analysis
- 3.1.3 Disruptions
- 3.1.4 Future outlook
- 3.1.5 Manufacturers
- 3.1.6 Distributors
- 3.2 Trump administration tariffs
- 3.2.1 Impact on trade
- 3.2.1.1 Trade volume disruptions
- 3.2.1.2 Retaliatory measures
- 3.2.2 Impact on the industry
- 3.2.2.1 Supply-side impact (raw materials)
- 3.2.2.1.1 Price volatility in key materials
- 3.2.2.1.2 Supply chain structure
- 3.2.2.1.3 Production cost implications
- 3.2.2.1 Supply-side impact (raw materials)
- 3.2.3 Demand-side impact (selling price)
- 3.2.3.1 Price transmission to end markets
- 3.2.3.2 Market share dynamics
- 3.2.3.3 Consumer response patterns
- 3.2.4 Key companies impacted
- 3.2.5 Strategic industry responses
- 3.2.5.1 Supply chain reconfiguration
- 3.2.5.2 Pricing and product strategies
- 3.2.5.3 Policy engagement
- 3.2.6 Outlook and future considerations
- 3.2.1 Impact on trade
- 3.3 Trade statistics (HS code) Note: the above trade statistics will be provided for key countries only.
- 3.3.1 Major exporting countries, 2021-2024 (kilo tons)
- 3.3.2 Major importing countries, 2021-2024 (kilo tons)
- 3.4 Supplier landscape
- 3.5 Profit margin analysis
- 3.6 Key news & initiatives
- 3.7 Regulatory landscape
- 3.8 Impact forces
- 3.8.1 Growth drivers
- 3.8.1.1 Growing demand for high-performance optical components
- 3.8.1.2 Advancements in photonics and quantum optics
- 3.8.1.3 Increasing applications in telecommunication
- 3.8.1.4 Rising adoption in healthcare and medical devices
- 3.8.2 Industry pitfalls & challenges
- 3.8.2.1 High production costs
- 3.8.2.2 Raw material supply
- 3.8.2.3 Regulatory challenges
- 3.8.1 Growth drivers
- 3.9 Market opportunities
- 3.9.1 Emerging applications in augmented and virtual reality
- 3.9.2 Growing demand for advanced sensing technologies
- 3.9.3 Expansion in autonomous vehicle systems
- 3.9.4 Development of biomimetic optical materials
- 3.10 Growth potential analysis
- 3.11 Regulatory framework analysis
- 3.11.1 Reach and ROHS regulations
- 3.11.2 Export control regulations
- 3.11.3 Environmental compliance requirements
- 3.11.4 Safety standards for handling and processing
- 3.12 Technology landscape
- 3.12.1 Current technological trends
- 3.12.2 Emerging technologies
- 3.12.3 R&D initiatives and innovation pipeline
- 3.12.4 Patent analysis
- 3.13 Porter's analysis
- 3.14 PESTEL analysis
Chapter 4 Competitive Landscape, 2024
- 4.1 Introduction
- 4.2 Market share analysis
- 4.2.1 Global market share by manufacturer
- 4.2.2 Regional market share by manufacturer
- 4.3 Competitive benchmarking
- 4.3.1 Product portfolio comparison
- 4.3.2 Technological capabilities comparison
- 4.3.3 R&D investment comparison
- 4.3.4 Manufacturing capacity comparison
- 4.4 Strategic initiatives & developments
- 4.4.1 Mergers & acquisitions
- 4.4.2 Partnerships & collaborations
- 4.4.3 Product launches & innovations
- 4.4.4 Expansion plans
- 4.5 Competitive positioning matrix
- 4.6 Strategic dashboard
Chapter 5 Market Estimates & Forecast, By Material Type, 2021-2034 (USD Billion) (Kilo Tons)
- 5.1 Key trends
- 5.2 Glass materials
- 5.2.1 Optical glass
- 5.2.2 Fused silica
- 5.2.3 Borosilicate glass
- 5.2.4 Specialty glass
- 5.2.5 Others
- 5.3 Polymeric materials
- 5.3.1 Polymethyl methacrylate (PMMA)
- 5.3.2 Polycarbonate (PC)
- 5.3.3 Cyclic olefin polymer (COP)
- 5.3.4 Cyclic olefin copolymer (COC)
- 5.3.5 Others
- 5.4 Crystalline materials
- 5.4.1 Sapphire
- 5.4.2 Silicon
- 5.4.3 Germanium
- 5.4.4 Zinc selenide
- 5.4.5 Calcium fluoride
- 5.4.6 Others
- 5.5 Ceramic materials
- 5.5.1 Transparent ceramics
- 5.5.2 Aluminum oxynitride (ALON)
- 5.5.3 Magnesium aluminate spinel
- 5.5.4 Yttrium aluminum garnet (YAG)
- 5.5.5 Others
- 5.6 Metallic materials
- 5.6.1 Aluminum
- 5.6.2 Silver
- 5.6.3 Gold
- 5.6.4 Others
- 5.7 Advanced composite materials
- 5.8 Photonic crystals
- 5.9 Metamaterials
- 5.10 Nanomaterials
- 5.11 Others
Chapter 6 Market Estimates & Forecast, By Application, 2021-2034 (USD Billion) (Kilo Tons)
- 6.1 Key trends
- 6.2 Optical components
- 6.2.1 Lenses
- 6.2.2 Mirrors
- 6.2.3 Prisms
- 6.2.4 Windows
- 6.2.5 Filters
- 6.2.6 Diffraction gratings
- 6.2.7 Others
- 6.3 Optoelectronic devices
- 6.3.1 Light emitting diodes (LEDs)
- 6.3.2 Laser diodes
- 6.3.3 Photodetectors
- 6.3.4 Solar cells
- 6.3.5 Optical modulators
- 6.3.6 Others
- 6.4 Imaging systems
- 6.4.1 Cameras
- 6.4.2 Microscopes
- 6.4.3 Telescopes
- 6.4.4 Thermal imaging
- 6.4.5 Others
- 6.5 Optical communication
- 6.5.1 Optical fibers
- 6.5.2 Waveguides
- 6.5.3 Optical amplifiers
- 6.5.4 Optical switches
- 6.5.5 Others
- 6.6 Sensing and measurement
- 6.6.1 Optical sensors
- 6.6.2 Spectroscopy
- 6.6.3 Interferometry
- 6.6.4 Others
- 6.7 Display technologies
- 6.7.1 LCD displays
- 6.7.2 OLED displays
- 6.7.3 AR/VR displays
- 6.7.4 Others
- 6.8 Others
Chapter 7 Market Estimates & Forecast, By End Use Industry, 2021-2034 (USD Billion) (Kilo Tons)
- 7.1 Key trends
- 7.2 Consumer electronics
- 7.2.1 Smartphones
- 7.2.2 Cameras
- 7.2.3 Wearable devices
- 7.2.4 Others
- 7.3 Healthcare and medical
- 7.3.1 Diagnostic equipment
- 7.3.2 Surgical devices
- 7.3.3 Therapeutic systems
- 7.3.4 Medical imaging
- 7.3.5 Others
- 7.4 Defense and security
- 7.4.1 Night vision
- 7.4.2 Targeting systems
- 7.4.3 Surveillance
- 7.4.4 Others
- 7.5 Telecommunications
- 7.5.1 Optical networks
- 7.5.2 Data centers
- 7.5.3 5g infrastructure
- 7.5.4 Others
- 7.6 Automotive
- 7.6.1 Lighting systems
- 7.6.2 Heads-up displays
- 7.6.3 Lidar systems
- 7.6.4 Driver assistance systems
- 7.6.5 Others
- 7.7 Aerospace
- 7.7.1 Avionics
- 7.7.2 Navigation systems
- 7.7.3 Satellite components
- 7.7.4 Others
- 7.8 Industrial
- 7.8.1 Machine vision
- 7.8.2 Laser processing
- 7.8.3 Quality control
- 7.8.4 Others
- 7.9 Energy
- 7.9.1 Solar energy
- 7.9.2 Photovoltaics
- 7.9.3 Others
- 7.10 Research and development
- 7.11 Others
Chapter 8 Market Estimates & Forecast, By Region, 2021-2034 (USD Billion) (Kilo Tons)
- 8.1 Key trends
- 8.2 North America
- 8.2.1 U.S.
- 8.2.2 Canada
- 8.3 Europe
- 8.3.1 UK
- 8.3.2 Germany
- 8.3.3 France
- 8.3.4 Italy
- 8.3.5 Spain
- 8.3.6 Rest of Europe
- 8.4 Asia Pacific
- 8.4.1 China
- 8.4.2 India
- 8.4.3 Japan
- 8.4.4 South Korea
- 8.4.5 Australia
- 8.4.6 Rest of Asia Pacific
- 8.5 Latin America
- 8.5.1 Brazil
- 8.5.2 Mexico
- 8.5.3 Argentina
- 8.5.4 Rest of Latin America
- 8.6 MEA
- 8.6.1 South Africa
- 8.6.2 Saudi Arabia
- 8.6.3 UAE
- 8.6.4 Rest of Middle East and Africa
Chapter 9 Company Profiles
- 9.1 CoorsTek
- 9.2 Corning Incorporated
- 9.3 Edmund Optics
- 9.4 Heraeus Holding
- 9.5 Hoya Corporation
- 9.6 II-VI Incorporated
- 9.7 Materion Corporation
- 9.8 Newport Corporation
- 9.9 Nikon Corporation
- 9.10 Ohara Corporation
- 9.11 SCHOTT
- 9.12 Sumitomo Electric Industries
- 9.13 Surmet Corporation
- 9.14 Thorlabs
- 9.15 ZEISS Group
 声波超材料市场:按应用、类型、材料和频率范围划分,全球预测(2026-2032年)
 2034年全球电磁超材料市场机会与策略
 全球超材料市场按应用、最终用户、产品、类型和地区划分-预测至2032年2026年全球超材料市场报告平面超透镜市场按类型、材质、波长和应用划分 - 全球预测 2026-2032红外线超透镜市场:按应用、终端用户产业、类型、材料、波长和製造工艺划分-2026-2032年全球预测
 声波超材料市场,全球预测至2032年:依超材料结构、材料平台、功能、目标频率范围、最终用户和地区划分
 超材料市场规模、份额、成长及全球产业分析:按类型、应用和地区划分的洞察与预测(2026-2034 年)
 超材料市场规模、份额和成长分析(按产品、应用、最终用途、类型、频宽和地区划分)—2026-2033年产业预测
 超材料的全球市场 (~2035年):超材料类型·产品形态·用途·企业类型·终端用户产业·各地区