


 |
市场调查报告书
商品编码
1773463
食物不耐受产品市场机会、成长动力、产业趋势分析及 2025 - 2034 年预测Food Intolerance Products Market Opportunity, Growth Drivers, Industry Trend Analysis, and Forecast 2025 - 2034 |
||||||
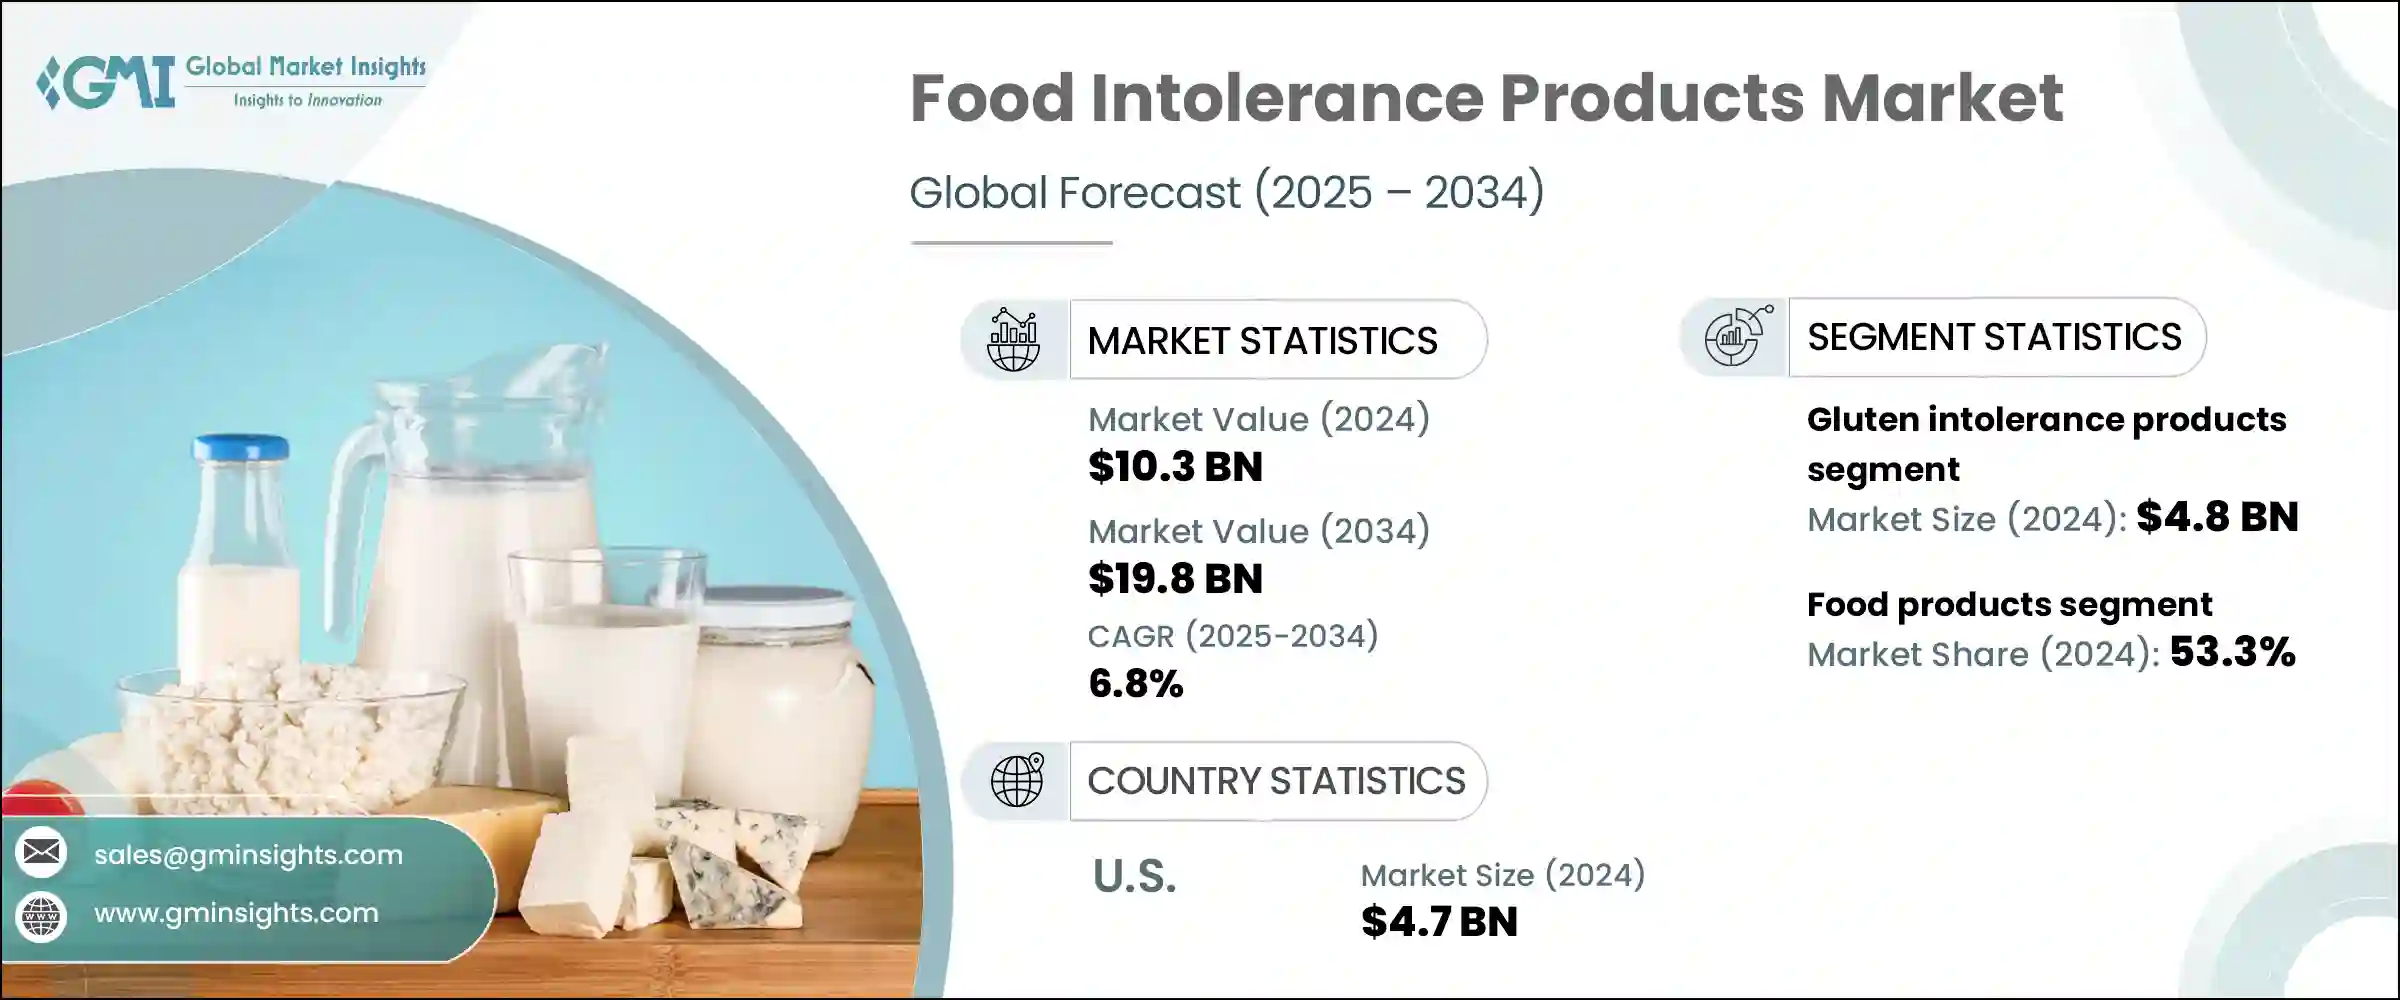
2024年,全球食物不耐受产品市场规模达103亿美元,预计2034年将以6.8%的复合年增长率成长,达到198亿美元。由于消费者对食物敏感性的认知度不断提升,以及对个人化营养的需求日益增长,该市场持续增长。随着诊断工具的改进和饮食偏好的演变,越来越多的消费者开始寻求针对特定不耐症情况(例如麸质、乳糖和低聚果糖(FODMAP)相关问题)量身定制的产品。向清洁标籤、无过敏原和功能性食品的转变正成为决定性因素,尤其是在註重健康的消费者寻求不仅避免过敏成分,而且符合健康趋势的产品的情况下。这些产品如今已成为健康饮食领域的重要组成部分。
大部分市场价值仍来自谷物、乳製品替代品、零食和烘焙食品等有形食品,这些产品在零售和餐饮服务领域都需求强劲。同时,儘管补充剂和消化支持剂的市场份额仍然较小,但它们继续受到那些应对更复杂食物过敏问题的消费者的关注。这些细分市场正在见证越来越多的产品上市,这些产品专注于改善消化功能,并为患有鲜为人知或多方面不耐受症状的人提供缓解。
| 市场范围 | |
|---|---|
| 起始年份 | 2024 |
| 预测年份 | 2025-2034 |
| 起始值 | 103亿美元 |
| 预测值 | 198亿美元 |
| 复合年增长率 | 6.8% |
2024年,麸质不耐症产品市值达48亿美元,预计2025年至2034年期间的复合年增长率将达到6.6%。由于人们对麸质相关疾病的认识和诊断不断提高,以及无麸质饮食的生活方式日益普及,因此市场占据主导地位。该领域掀起了一波创新浪潮,尤其是在改善无麸质零食、烘焙食品和即食食品的口味、质地和营养成分方面,这推动了消费者的长期兴趣和品牌忠诚度。
食物不耐受产品市场的食品细分市场在2024年创收54亿美元,预计2034年将维持7%的复合年增长率,占53.3%的市场。随着人们食物敏感性意识的不断提高,以及乳糜泻和乳糖不耐受等饮食疾病的日益流行,该细分市场持续蓬勃发展。各大品牌正积极拓展其产品线,推出注重过敏原的产品,例如植物性乳製品替代品、无麸质零食以及不含常见刺激物的烘焙食品。随着企业加强研发力度,开发兼顾健康需求和口味偏好的食品,需求与现有选择之间的差距正逐渐缩小。
2024年,美国食物不耐受产品市场规模达47亿美元,预计2025年至2034年期间的复合年增长率将达到6.9%。这一显着增长得益于消费者教育水平的提高、注重健康的饮食习惯以及越来越多的人意识到食物过敏。美国消费者在饮食选择上越来越挑剔,促使企业加大对产品多样化和创新的投资。因此,生产者必须满足特定的营养需求,这导致全国各地出现了更多针对性的食物不耐症产品。
食物不耐受产品行业的领先公司包括 Lifeway Foods, Inc.、McNeil Consumer Healthcare Lactaid、General Mills, Inc.、Danone SA 和 Nestle SA。这些品牌正积极致力于扩大其在这个充满活力的市场的影响力。为了巩固其地位,食物不耐症领域的主要参与者正在使用一系列有针对性的策略。他们正在扩大产品组合以满足新出现的不耐受问题,投资研发以改善无过敏原食品的口味和质地,并与营养师和医疗保健专业人士合作以提高信誉。该公司也采用清洁标籤做法,并利用数位平台与注重健康的受众互动。许多公司正在收购利基品牌并推出专门的产品线以满足不断变化的消费者需求,同时也增加其在电子商务和零售货架上的存在,以最大限度地扩大影响力和知名度。
目录
第一章:方法论与范围
第二章:执行摘要
第三章:行业洞察
- 产业生态系统分析
- 供应商格局
- 利润率
- 每个阶段的增值
- 影响价值链的因素
- 中断
- 产业衝击力
- 成长动力
- 食物不耐受和过敏的盛行率不断上升
- 意识和诊断率不断提高
- 无添加产品的需求不断增加
- 扩大产品供应与种类
- 产业陷阱与挑战
- 特色产品的溢价定价
- 配方和口味挑战
- 市场机会
- 成长动力
- 成长潜力分析
- 监管格局
- 北美洲
- 欧洲
- 亚太地区
- 拉丁美洲
- 中东和非洲
- 波特的分析
- Pestel 分析
- 价格趋势
- 未来市场趋势
- 技术和创新格局
- 当前的技术趋势
- 新兴技术
- 专利格局
- 贸易统计(HS编码)(註:仅提供重点国家的贸易统计资料)
- 主要进口国
- 主要出口国
- 永续性和环境方面
- 永续实践
- 减少废弃物的策略
- 生产中的能源效率
- 环保倡议
第四章:竞争格局
- 介绍
- 公司市占率分析
- 按地区
- 北美洲
- 欧洲
- 亚太地区
- 拉丁美洲
- MEA
- 按地区
- 公司矩阵分析
- 主要市场参与者的竞争分析
- 竞争定位矩阵
- 关键进展
- 併购
- 伙伴关係与合作
- 新产品发布
- 扩张计划
第五章:市场估计与预测:按不耐受类型,2021-2034 年
- 主要趋势
- 乳糖不耐症产品
- 麸质不耐症产品
- Fodmap 不耐受产品
- 组织胺不耐受产品
- 亚硫酸盐不耐受产品
- 其他不耐受产品
第六章:市场估计与预测:依产品类别,2021-2034 年
- 主要趋势
- 食品
- 烘焙和谷物产品
- 麵包和烘焙食品
- 早餐麦片和格兰诺拉麦片
- 饼干和薄脆饼干
- 其他烘焙产品
- 乳製品替代品
- 牛奶替代品
- 起司替代品
- 优格替代品
- 冰淇淋和甜点替代品
- 其他乳製品替代品
- 零食和方便食品
- 薯片和咸味小吃
- 营养和蛋白质棒
- 即食食品和预製食品
- 其他零食产品
- 调味品、调味汁和酱汁
- 糖果和甜点
- 婴儿食品和婴儿配方奶粉
- 其他食品
- 烘焙和谷物产品
- 饮料
- 植物奶
- 果汁和蔬菜汁
- 功能性饮料
- 其他饮料
- 补充剂和消化助剂
- 消化酵素
- 益生菌和益生元
- 其他补充剂
第七章:市场估计与预测:按配销通路,2021-2034
- 主要趋势
- 超市和大卖场
- 专卖店及保健食品店
- 便利商店
- 网路零售
- 电子商务平台
- 直接面向消费者的网站
- 订阅服务
- 药局和药局
- 餐饮和HoReCa
- 其他的
第八章:市场估计与预测:按地区,2021-2034
- 主要趋势
- 北美洲
- 我们
- 加拿大
- 欧洲
- 英国
- 德国
- 法国
- 义大利
- 西班牙
- 荷兰
- 欧洲其他地区
- 亚太地区
- 中国
- 印度
- 日本
- 韩国
- 澳洲
- 亚太其他地区
- 拉丁美洲
- 巴西
- 墨西哥
- 阿根廷
- 拉丁美洲其他地区
- 中东和非洲
- 南非
- 沙乌地阿拉伯
- 阿联酋
- 中东和非洲其他地区
第九章:公司简介
- Alpro
- Amy's Kitchen, Inc.
- Conagra Brands, Inc.
- Daiya Foods Inc.
- Danone SA
- Dr. Schar AG/SPA
- Enjoy Life Foods (Mondelez International)
- Follow Your Heart
- Fody Food Co.
- General Mills, Inc.
- Glutino (The Glutino Food Group)
- Kellogg Company
- Lactaid (McNeil Nutritionals, LLC)
- Mondelez International, Inc.
- Nestle SA
- Oatly Group AB
- The Hain Celestial Group, Inc.
- The Kraft Heinz Company
- The Lactalis Group
- Udis Gluten Free (Boulder Brands, Inc.)
The Global Food Intolerance Products Market was valued at USD 10.3 billion in 2024 and is estimated to grow at a CAGR of 6.8% to reach USD 19.8 billion by 2034. This market has been experiencing consistent growth, fueled by increased consumer awareness of food sensitivities and a broader demand for personalized nutrition. As diagnostic tools improve and dietary preferences evolve, more consumers are turning to products tailored to specific intolerances, such as gluten, lactose, and FODMAP-related issues. The shift toward clean-label, allergen-free, and functional food is becoming a defining factor, especially as health-conscious shoppers look for items that not only avoid triggering ingredients but also align with wellness trends. These products have now become a vital part of the larger healthy eating category.
Most of the market's value still comes from tangible food items such as cereals, dairy substitutes, snack products, and baked goods, which enjoy strong demand from both retail and food service sectors. At the same time, although still a smaller segment, supplements and digestive support aids continue to gain attention from consumers managing more complex food sensitivities. These segments are witnessing increased product launches focused on improving digestion and offering relief for individuals with lesser-known or multi-faceted intolerances.
| Market Scope | |
|---|---|
| Start Year | 2024 |
| Forecast Year | 2025-2034 |
| Start Value | $10.3 Billion |
| Forecast Value | $19.8 Billion |
| CAGR | 6.8% |
In 2024, the gluten intolerance products segment was valued at USD 4.8 billion and is forecasted to grow at a CAGR of 6.6% between 2025 and 2034. This segment dominates because of the growing awareness and diagnosis of gluten-related disorders and the lifestyle adoption of gluten-free diets. There's been a wave of innovation in this space, particularly around improving taste, texture, and nutritional content in gluten-free snacks, bakery items, and ready-to-eat meals, driving long-term consumer interest and brand loyalty.
The food products segment in the food intolerance products market generated USD 5.4 billion in 2024 and is expected to maintain a 7% CAGR through 2034, accounting for a 53.3% share. This segment continues to thrive due to rising food sensitivity awareness and the increasing prevalence of dietary conditions like celiac disease and lactose intolerance. Brands are aggressively expanding their lines with allergen-conscious offerings, such as plant-based dairy alternatives, gluten-free snacks, and baked goods formulated without common irritants. The gap between demand and available options is gradually narrowing as companies step up to develop foods that meet both health needs and taste preferences.
United States Food Intolerance Products Market was valued at USD 4.7 billion in 2024 and is set to grow at a CAGR of 6.9% from 2025 to 2034. This significant growth is propelled by heightened consumer education, health-focused eating habits, and an increasing number of individuals identifying food sensitivities. American consumers are becoming more selective in their dietary choices, encouraging companies to invest in product diversification and innovation. As a result, producers must cater to specific nutritional demands, which has led to a broader offering of targeted food intolerance products throughout the country.
The leading companies operating in the Food Intolerance Products Industry include Lifeway Foods, Inc., McNeil Consumer Healthcare Lactaid, General Mills, Inc., Danone S.A., and Nestle S.A. These brands are actively engaged in expanding their footprint in this dynamic market. To solidify their presence, key players in the food intolerance space are using a mix of targeted strategies. They are expanding their product portfolios to cater to emerging intolerances, investing in R&D to improve the taste and texture of allergen-free foods, and forming collaborations with dieticians and healthcare professionals to enhance credibility. Companies are also adopting clean-label practices and leveraging digital platforms to engage with health-conscious audiences. Many are acquiring niche brands and launching specialized product lines to cater to evolving consumer demands, while also increasing their presence in e-commerce and retail shelves to maximize reach and visibility.
Table of Contents
Chapter 1 Methodology & Scope
- 1.1 Market scope and definition
- 1.2 Research design
- 1.2.1 Research approach
- 1.2.2 Data collection methods
- 1.3 Data mining sources
- 1.3.1 Global
- 1.3.2 Regional/Country
- 1.4 Base estimates and calculations
- 1.4.1 Base year calculation
- 1.4.2 Key trends for market estimation
- 1.5 Primary research and validation
- 1.5.1 Primary sources
- 1.6 Forecast model
- 1.7 Research assumptions and limitations
Chapter 2 Executive Summary
- 2.1 Industry 3600 synopsis
- 2.2 Key market trends
- 2.3 TAM analysis, 2025-2034
- 2.4 CXO perspectives: strategic imperatives
- 2.5 Executive decision points
- 2.6 Critical success factors
- 2.7 Future outlook and strategic recommendations
Chapter 3 Industry Insights
- 3.1 Industry ecosystem analysis
- 3.1.1 Supplier landscape
- 3.1.2 Profit margin
- 3.1.3 Value addition at each stage
- 3.1.4 Factor affecting the value chain
- 3.1.5 Disruptions
- 3.2 Industry impact forces
- 3.2.1 Growth drivers
- 3.2.1.1 Rising prevalence of food intolerances & allergies
- 3.2.1.2 Growing awareness & diagnosis rates
- 3.2.1.3 Increasing demand for free-from products
- 3.2.1.4 Expanding product availability & variety
- 3.2.2 Industry pitfalls and challenges
- 3.2.2.1 Premium pricing of specialty products
- 3.2.2.2 Formulation & taste challenges
- 3.2.3 Market opportunities
- 3.2.1 Growth drivers
- 3.3 Growth potential analysis
- 3.4 Regulatory landscape
- 3.4.1 North America
- 3.4.2 Europe
- 3.4.3 Asia pacific
- 3.4.4 Latin America
- 3.4.5 Middle east & Africa
- 3.5 Porter's analysis
- 3.6 Pestel analysis
- 3.7 Price trends
- 3.8 Future market trends
- 3.9 Technology and innovation landscape
- 3.9.1 Current technological trends
- 3.9.2 Emerging technologies
- 3.10 Patent landscape
- 3.11 Trade statistics (HS code) (Note: the trade statistics will be provided for key countries only)
- 3.11.1 Major importing countries
- 3.11.2 Major exporting countries
- 3.12 Sustainability and environmental aspects
- 3.12.1 Sustainable practices
- 3.12.2 Waste reduction strategies
- 3.12.3 Energy efficiency in production
- 3.12.4 Eco-friendly initiatives
Chapter 4 Competitive Landscape, 2024
- 4.1 Introduction
- 4.2 Company market share analysis
- 4.2.1 By region
- 4.2.1.1 North America
- 4.2.1.2 Europe
- 4.2.1.3 Asia Pacific
- 4.2.1.4 LATAM
- 4.2.1.5 MEA
- 4.2.1 By region
- 4.3 Company matrix analysis
- 4.4 Competitive analysis of major market players
- 4.5 Competitive positioning matrix
- 4.6 Key developments
- 4.6.1 Mergers & acquisitions
- 4.6.2 Partnerships & collaborations
- 4.6.3 New Product Launches
- 4.6.4 Expansion plans
Chapter 5 Market Estimates & Forecast, By Intolerance Type, 2021-2034 (USD Billion) (Kilo Tons)
- 5.1 Key trends
- 5.2 Lactose intolerance products
- 5.3 Gluten intolerance products
- 5.4 Fodmap intolerance products
- 5.5 Histamine intolerance products
- 5.6 Sulfite intolerance products
- 5.7 Other intolerance products
Chapter 6 Market Estimates & Forecast, By Product Category, 2021-2034 (USD Billion) (Kilo Tons)
- 6.1 Key trends
- 6.2 Food products
- 6.2.1 Bakery & cereal products
- 6.2.1.1 Bread & baked goods
- 6.2.1.2 Breakfast cereals & granola
- 6.2.1.3 Cookies & crackers
- 6.2.1.4 Other bakery products
- 6.2.2 Dairy alternatives
- 6.2.2.1 Milk alternatives
- 6.2.2.2 Cheese alternatives
- 6.2.2.3 Yogurt alternatives
- 6.2.2.4 Ice cream & dessert alternatives
- 6.2.2.5 Other dairy alternatives
- 6.2.3 Snacks & convenience foods
- 6.2.3.1 Chips & savory snacks
- 6.2.3.2 Nutrition & protein bars
- 6.2.3.3 Ready meals & prepared foods
- 6.2.3.4 Other snack products
- 6.2.4 Condiments, dressings & sauces
- 6.2.4.1 Confectionery & desserts
- 6.2.4.2 Baby food & infant formulas
- 6.2.4.3 Other food products
- 6.2.1 Bakery & cereal products
- 6.3 Beverages
- 6.3.1 Plant-based milk
- 6.3.2 Fruit & vegetable juices
- 6.3.3 Functional beverages
- 6.3.4 Other beverages
- 6.4 Supplements & digestive aids
- 6.4.1 Digestive enzymes
- 6.4.2 Probiotics & prebiotics
- 6.4.3 Other supplements
Chapter 7 Market Estimates & Forecast, By Distribution Channel, 2021-2034 (USD Billion) (Kilo Tons)
- 7.1 Key trends
- 7.2 Supermarkets & hypermarkets
- 7.3 Specialty stores & health food stores
- 7.4 Convenience stores
- 7.5 Online retail
- 7.5.1 E-commerce platforms
- 7.5.2 Direct-to-consumer websites
- 7.5.3 Subscription services
- 7.6 Pharmacies & drugstores
- 7.7 Foodservice & HoReCa
- 7.8 Others
Chapter 8 Market Estimates & Forecast, By Region, 2021-2034 (USD Billion) (Kilo Tons)
- 8.1 Key trends
- 8.2 North America
- 8.2.1 U.S.
- 8.2.2 Canada
- 8.3 Europe
- 8.3.1 UK
- 8.3.2 Germany
- 8.3.3 France
- 8.3.4 Italy
- 8.3.5 Spain
- 8.3.6 Netherlands
- 8.3.7 Rest of Europe
- 8.4 Asia Pacific
- 8.4.1 China
- 8.4.2 India
- 8.4.3 Japan
- 8.4.4 South Korea
- 8.4.5 Australia
- 8.4.6 Rest of Asia Pacific
- 8.5 Latin America
- 8.5.1 Brazil
- 8.5.2 Mexico
- 8.5.3 Argentina
- 8.5.4 Rest of Latin America
- 8.6 Middle East and Africa
- 8.6.1 South Africa
- 8.6.2 Saudi Arabia
- 8.6.3 UAE
- 8.6.4 Rest of Middle East and Africa
Chapter 9 Company Profiles
- 9.1 Alpro
- 9.2 Amy's Kitchen, Inc.
- 9.3 Conagra Brands, Inc.
- 9.4 Daiya Foods Inc.
- 9.5 Danone S.A.
- 9.6 Dr. Schar AG/SPA
- 9.7 Enjoy Life Foods (Mondelez International)
- 9.8 Follow Your Heart
- 9.9 Fody Food Co.
- 9.10 General Mills, Inc.
- 9.11 Glutino (The Glutino Food Group)
- 9.12 Kellogg Company
- 9.13 Lactaid (McNeil Nutritionals, LLC)
- 9.14 Mondelez International, Inc.
- 9.15 Nestle S.A.
- 9.16 Oatly Group AB
- 9.17 The Hain Celestial Group, Inc.
- 9.18 The Kraft Heinz Company
- 9.19 The Lactalis Group
- 9.20 Udis Gluten Free (Boulder Brands, Inc.)


