


 |
市场调查报告书
商品编码
1797828
针状焦市场机会、成长动力、产业趋势分析及 2025 - 2034 年预测Needle Coke Market Opportunity, Growth Drivers, Industry Trend Analysis, and Forecast 2025 - 2034 |
||||||
2024 年全球针状焦市场价值为 66 亿美元,预计到 2034 年将以 6.1% 的复合年增长率增长至 120 亿美元。该行业的成长在很大程度上受到其在製造电弧炉石墨电极方面的关键作用的影响,而电弧炉广泛用于钢铁生产。这种优质石油焦以其针状结构和低热膨胀係数而闻名,特别适合需要出色导热性和导电性的应用。由于电弧炉技术比传统高炉方法更节能且碳足迹更少,钢铁业越来越多地采用电弧炉技术,对高品质石墨电极的需求持续扩大,从而推动了针状焦市场的发展。精炼技术的进步、对性能改进的高度重视以及传统和新兴应用中不断变化的工业要求也塑造了行业动态。
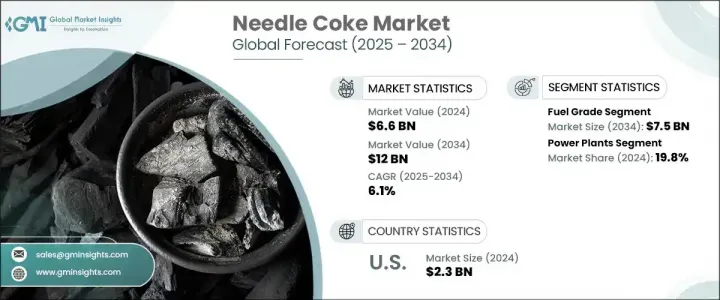
依等级,市场分为燃料等级和煅烧石油焦两大类。预计到2034年,燃料级市场规模将超过75亿美元,同期复合年增长率为6%。该领域的发展受到全球能源需求模式转变、炼油厂营运趋势以及环境法规收紧的影响。旨在提高燃烧效率和控制排放的创新技术正在开始重塑采购偏好,许多行业都在寻求既能最大限度地发挥燃料焦的优势,又能遵守更严格的环境标准的解决方案。这为生产商创造了将先进技术融入製造流程以满足性能和合规性目标的机会。
| 市场范围 | |
|---|---|
| 起始年份 | 2024 |
| 预测年份 | 2025-2034 |
| 起始值 | 66亿美元 |
| 预测值 | 120亿美元 |
| 复合年增长率 | 6.1% |
从应用角度来看,针状焦产业分为发电厂、水泥製造、钢铁生产、铝加工和其他工业用途。发电厂领域目前占最大份额,到2024年将占据19.8%的市场份额,预计到2034年将以6.1%的复合年增长率成长。随着全球能源基础设施向更高效、更永续的解决方案转型,针状焦在发电领域的应用日益增长,尤其是在高温和先进的储能係统中。这些发展与能源政策的变化、工业体系的现代化以及材料性能的技术进步密切相关。
从区域来看,北美市场依然占据主导地位,其中美国占据主导地位。 2024年,美国占据该地区约94%的份额,创造了23亿美元的收入。产业升级、永续发展措施的实施以及创新能源技术的采用,为北美市场的扩张提供了支持。旨在减少进口依赖和加速清洁能源系统部署的政策倡议,进一步促进了积极的市场前景。强劲的国内需求与有针对性的行业政策相结合,为未来的成长奠定了坚实的基础。
针状焦市场中的企业正在推行多种策略以巩固其市场地位。大量资金投入研发,重点在于永续精炼和先进加工技术,以提高产品纯度、密度以及电极和电池级应用的性能。企业正在与下游製造商建立策略联盟,包括合作伙伴关係和合资企业,以确保稳定的长期需求并实现协同产品创新。此外,透过新的生产设施和分销网络进军高成长新兴市场,正成为寻求多元化全球布局并挖掘尚未开发的需求潜力的供应商的首要任务。
技术进步、监管调整和策略性产业合作的结合正在重塑竞争环境。市场的成长轨迹不仅反映了钢铁业不断增长的需求,也反映了针状焦在多个行业各种高性能应用中日益增长的作用。
目录
第一章:方法论与范围
第二章:执行摘要
第三章:行业洞察
- 产业生态系统分析
- 监管格局
- 製造技术分析
- 延迟焦化製程的进步
- 共碳化技术
- 替代原料开发
- 品质增强技术
- 新兴生产方法
- 产业衝击力
- 成长动力
- 产业陷阱与挑战
- 进出口贸易分析
- 价格趋势分析
- 按年级
- 按地理位置
- 成长潜力分析
- 波特的分析
- PESTEL分析
第四章:竞争格局
- 介绍
- 公司市占率分析
- 北美洲
- 欧洲
- 亚太地区
- 中东和非洲
- 拉丁美洲
- 策略仪表板
- 策略倡议
- 竞争基准测试
- 创新与技术格局
第五章:市场规模及预测:依等级,2021-2034
- 主要趋势
- 燃料等级
- 煅烧石油焦
第六章:市场规模与预测:按应用,2021-2034 年
- 主要趋势
- 发电厂
- 水泥业
- 钢铁业
- 铝工业
- 其他的
第七章:市场规模及预测:依地区,2021-2034
- 主要趋势
- 北美洲
- 我们
- 加拿大
- 欧洲
- 西班牙
- 英国
- 义大利
- 法国
- 德国
- 亚太地区
- 中国
- 印度
- 日本
- 澳洲
- 中东和非洲
- 突尼西亚
- 土耳其
- 摩洛哥
- 拉丁美洲
- 巴西
- 阿根廷
- 智利
- 墨西哥
第八章:公司简介
- AMINCO RESOURCES
- Bharat Petroleum Corporation Limited
- BP plc
- Cenovus Inc
- Chevron Corporation
- Cocan graphite
- Exxon Mobil Corporation
- Fangda Carbon New Materials Technology Co., Ltd.
- GrafTech International
- Graphite India Limited
- Indian Oil Corporation
- Marathon Petroleum Corporation
- Mitsubishi Chemical Group Corporation
- Oxbow Corporation
- Reliance Industries Limited
- Rain Carbon Inc.
- Saudi Arabian Oil Company (Saudi Aramco)
- Shamokin Carbons
- Shell Plc
- Valero
The Global Needle Coke Market was valued at USD 6.6 billion in 2024 and is estimated to grow at a CAGR of 6.1% to reach USD 12 billion by 2034. Growth in this sector is strongly influenced by its critical role in manufacturing graphite electrodes for electric arc furnaces, which are widely used in steel production. This premium-grade petroleum coke, known for its acicular structure and low coefficient of thermal expansion, is especially suited for applications where exceptional thermal and electrical conductivity is essential. As the steel industry increasingly adopts electric arc furnace technology due to its energy efficiency and reduced carbon footprint compared to conventional blast furnace methods, the demand for high-quality graphite electrodes continues to expand, thereby driving the market for needle coke. Industry dynamics are also shaped by advances in refining technologies, heightened focus on performance improvements, and evolving industrial requirements in both traditional and emerging applications.
Based on grade, the market is split into fuel-grade and calcinated petroleum coke segments. The fuel-grade category is forecast to exceed USD 7.5 billion by 2034, advancing at a CAGR of 6% over the same period. Developments in this segment are influenced by shifting patterns in global energy demand, operational trends within refineries, and the tightening of environmental regulations. New innovations aimed at improving combustion efficiency and controlling emissions are beginning to reshape procurement preferences, with many industries seeking solutions that maximize the benefits of fuel coke while adhering to stricter environmental standards. This has created opportunities for producers to integrate advanced technologies into manufacturing processes to meet both performance and compliance targets.
| Market Scope | |
|---|---|
| Start Year | 2024 |
| Forecast Year | 2025-2034 |
| Start Value | $6.6 Billion |
| Forecast Value | $12 Billion |
| CAGR | 6.1% |
From an application perspective, the needle coke industry is divided into power plants, cement manufacturing, steel production, aluminum processing, and other industrial uses. The power plant sector currently accounts for the largest share, representing 19.8% of the market in 2024, and is projected to expand at a CAGR of 6.1% through 2034. The use of needle coke in power generation is gaining momentum, particularly in high-temperature and advanced energy storage systems, as global energy infrastructures transition toward more efficient and sustainable solutions. These developments are closely linked to changes in energy policy, the modernization of industrial systems, and technological advancements in material performance.
Regionally, North America remains a prominent market, with the United States holding a dominant position. In 2024, the U.S. accounted for around 94% of the regional share, generating USD 2.3 billion in revenue. Market expansion here is supported by industrial upgrades, the implementation of sustainability measures, and adoption of innovative energy technologies. Policy initiatives aimed at reducing import dependency and accelerating the deployment of clean energy systems have further contributed to the positive market outlook. The combination of robust domestic demand and targeted industry policies has established a strong foundation for future growth.
Companies operating in the needle coke market are pursuing multiple strategies to strengthen their position. Significant investments are being directed toward research and development, with a focus on sustainable refining and advanced processing technologies that enhance product purity, density, and performance for both electrode and battery-grade applications. Strategic alliances, including partnerships and joint ventures with downstream manufacturers, are being formed to secure stable long-term demand and enable collaborative product innovation. Additionally, expansion into high-growth emerging markets through new production facilities and distribution networks is becoming a key priority for suppliers seeking to diversify their global presence and tap into untapped demand potential.
This combination of technological progress, regulatory adaptation, and strategic industry collaboration is reshaping the competitive environment. The market's growth trajectory reflects not only the rising demand from the steel sector but also the expanding role of needle coke in various high-performance applications across multiple industries.
Table of Contents
Chapter 1 Methodology & Scope
- 1.1 Market definitions
- 1.2 Base estimates & calculations
- 1.3 Forecast calculation
- 1.4 Data sources
- 1.4.1 Primary
- 1.4.2 Secondary
- 1.4.2.1 Paid
- 1.4.2.2 Public
Chapter 2 Executive Summary
- 2.1 Industry synopsis, 2021 - 2034
- 2.1.1 Business trends
- 2.1.2 Grade trends
- 2.1.3 Application trends
- 2.1.4 Regional trends
Chapter 3 Industry Insights
- 3.1 Industry ecosystem analysis
- 3.2 Regulatory landscape
- 3.3 Manufacturing technology analysis
- 3.3.1 Delayed coking process advancements
- 3.3.2 Co-carbonization technologies
- 3.3.3 Alternative feedstock development
- 3.3.4 Quality enhancement techniques
- 3.3.5 Emerging production methodologies
- 3.4 Industry impact forces
- 3.4.1 Growth drivers
- 3.4.2 Industry pitfalls & challenges
- 3.5 Import/export trade analysis
- 3.6 Price trend analysis
- 3.6.1 By grade
- 3.6.2 By geography
- 3.7 Growth potential analysis
- 3.8 Porter's analysis
- 3.8.1 Bargaining power of suppliers
- 3.8.2 Bargaining power of buyers
- 3.8.3 Threat of new entrants
- 3.8.4 Threat of substitutes
- 3.9 PESTEL analysis
- 3.9.1 Political factors
- 3.9.2 Economic factors
- 3.9.3 Social factors
- 3.9.4 Technological factors
- 3.9.5 Environmental factors
- 3.9.6 Legal factors
Chapter 4 Competitive Landscape, 2025
- 4.1 Introduction
- 4.2 Company market share analysis, 2024
- 4.2.1 North America
- 4.2.2 Europe
- 4.2.3 Asia Pacific
- 4.2.4 Middle East & Africa
- 4.2.5 Latin America
- 4.3 Strategy dashboard
- 4.4 Strategic initiative
- 4.5 Competitive benchmarking
- 4.6 Innovation & technology landscape
Chapter 5 Market Size and Forecast, By Grade, 2021 - 2034, (MT and USD Billion)
- 5.1 Key trends
- 5.2 Fuel grade
- 5.3 Calcinated petcoke
Chapter 6 Market Size and Forecast, By Application, 2021 - 2034, (MT and USD Billion)
- 6.1 Key trends
- 6.2 Power plants
- 6.3 Cement industry
- 6.4 Steel industry
- 6.5 Aluminum industry
- 6.6 Others
Chapter 7 Market Size and Forecast, By Region, 2021 - 2034, (MT and USD Billion)
- 7.1 Key trends
- 7.2 North America
- 7.2.1 U.S.
- 7.2.2 Canada
- 7.3 Europe
- 7.3.1 Spain
- 7.3.2 UK
- 7.3.3 Italy
- 7.3.4 France
- 7.3.5 Germany
- 7.4 Asia Pacific
- 7.4.1 China
- 7.4.2 India
- 7.4.3 Japan
- 7.4.4 Australia
- 7.5 Middle East & Africa
- 7.5.1 Tunisia
- 7.5.2 Turkey
- 7.5.3 Morocco
- 7.6 Latin America
- 7.6.1 Brazil
- 7.6.2 Argentina
- 7.6.3 Chile
- 7.6.4 Mexico
Chapter 8 Company Profiles
- 8.1 AMINCO RESOURCES
- 8.2 Bharat Petroleum Corporation Limited
- 8.3 BP plc
- 8.4 Cenovus Inc
- 8.5 Chevron Corporation
- 8.6 Cocan graphite
- 8.7 Exxon Mobil Corporation
- 8.8 Fangda Carbon New Materials Technology Co., Ltd.
- 8.9 GrafTech International
- 8.10 Graphite India Limited
- 8.11 Indian Oil Corporation
- 8.12 Marathon Petroleum Corporation
- 8.13 Mitsubishi Chemical Group Corporation
- 8.14 Oxbow Corporation
- 8.15 Reliance Industries Limited
- 8.16 Rain Carbon Inc.
- 8.17 Saudi Arabian Oil Company (Saudi Aramco)
- 8.18 Shamokin Carbons
- 8.19 Shell Plc
- 8.20 Valero
 针状软木塞全球市场规模、份额、趋势和成长分析报告(2026-2034)
 针状焦市场 - 全球产业规模、份额、趋势、机会及预测(依产品类型、产品等级、应用、地区及竞争格局划分,2021-2031年)
 针状焦:市场占有率分析、产业趋势与统计、成长预测(2026-2031)
 针状焦市场规模、份额和成长分析(按产品类型、等级、应用、最终用途和地区划分)-2026-2033年产业预测针状焦市场规模、占有率、成长及全球产业分析:依类型、应用和地区划分的洞察与预测(2024-2032)
 2025 年至 2033 年针状焦市场规模、份额、趋势及预测(按类型、等级、应用、最终用途行业和地区)针状焦市场-2025年至2030年的预测
 针状焦市场,按类型、按等级、按应用、按最终用户、按国家和地区 - 2025 年至 2032 年全球行业分析、市场规模、市场份额及预测
 全球针状焦市场需求及预测分析(2018-2034)
 全球针状焦市场:市场规模、份额、趋势分析(按等级、应用和地区)、细分市场预测(2025-2030 年)