


 |
市场调查报告书
商品编码
1822612
浮动发电厂市场机会、成长动力、产业趋势分析及 2025 - 2034 年预测Floating Power Plants Market Opportunity, Growth Drivers, Industry Trend Analysis, and Forecast 2025 - 2034 |
||||||
根据 Global Market Insights, Inc. 发布的最新报告,2024 年全球浮动电厂市场价值为 39 亿美元,预计将从 2025 年的 42 亿美元增长到 2034 年的 86 亿美元,复合年增长率为 8.2%。
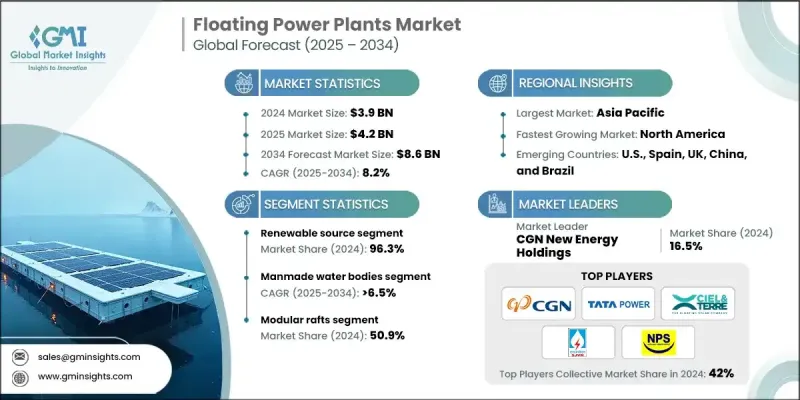
浮动电站 (FPP) 作为一种快速、可部署且灵活的能源选择,正日益兴起,以满足水资源丰富但土地有限的地区的能源需求。这些电站能够整合再生能源,降低输电损耗,并调节负载需求,而无需占用大量土地。
| 市场范围 | |
|---|---|
| 起始年份 | 2024 |
| 预测年份 | 2025-2034 |
| 起始值 | 39亿美元 |
| 预测值 | 86亿美元 |
| 复合年增长率 | 8.2% |
关键驱动因素:
1.重视再生能源整合:浮动太阳能/风能平台的出现使各国无需争夺有限的土地资源即可实现清洁能源目标。
2.需要在近海和岛屿地区快速部署: FPP 无需电网扩展即可为弱势的沿海和岛屿社区提供弹性能源的能力是不可估量的。
3.土地限制和水体利用问题:公共部门正在推动利用人工湖泊和水库来生产清洁能源。
4.模组化和混合技术的进步:利用太阳能、风能和储能的混合浮动生产平台的进步正在改变公用事业规模再生能源的实施。
关键参与者:
- 浮动电厂市场的 5 大领导者分别是中广核新能源控股、塔塔电力、Ciel & Terre、SJVN 绿色能源和国家电力供应公共公司,占 2024 年市场的约 42%。
- 西门子能源2025财年第三季财报显示,该公司第三季财务业绩表现强劲,营收年增13.5%,达113亿美元。
- 2025年上半年,GE Vernova报告营收为171亿美元。
- 2025年第三季度,川崎重工营收33亿美元。
主要挑战:
- 部署资本成本高:模组化的优势降低了成本,但繫泊和安装系统的成本仍然首次居高不下。
- 环境和监管要求:这包括与场地和环境问题相关的许可和水权,这些问题可能会影响部署,特别是在敏感的海洋栖息地。
- 各种极端天气下的维护和繫泊:海上浮动结构需要随时考虑海水腐蚀和风浪条件的影响。
1. 依能源类型划分-再生能源领先
再生浮动发电厂(尤其是太阳能和风能)在 2024 年占据了市场份额的主导地位。日益严格的环境法规和脱碳目标正在推动公用事业公司朝向混合和太阳能主导的浮动发电技术迈进。
2. 按应用-人造水体处于最前沿
由于许可简单且水位稳定,水库、池塘、人工湖和运河等人工水体是最主要的部署地点。这些施工地点最大限度地减少了潮汐和风浪作用的潜在影响,从而确保了FPP的长期可行性。
3. 透过部署 - 模组化筏提供动员
模组化筏板系统是2024年市场上最主流的系统。它们透过标准化製造为单元提供移动性和可移动性,使其在公用事业规模的电网应用以及农村电气化项目中都具有价值。这种方法的有效性也反映在维护成本更低、升级时间更短。
北美地区对清洁能源的雄心勃勃,被视为一个快速成长的市场。陆上和离岸风电(美国东海岸)、水库浮动太阳能(加利福尼亚州、德克萨斯州)以及其他领域正在推动该地区浮动发电能力的成长。
浮动发电厂市场的主要供应商包括 BW Ideol、中广核新能源控股、中国国家能源、Ciel & Terre、泰国电力局、Equinor、Floating Power Plant、GE Vernova、HEXA Renewables、Karadeniz Holding、川崎重工、MAN Energy Solutions、三菱重工、国家电力供应公共公司、Oteriz Holding、川崎重工、MAN Energy Solutions、三菱重工、国家电力供应公共公司、Oterizu Holding、Scoter、MAN Energy Solutions、三菱重工、全国电力供应Energy、Swimsol、塔塔电力、维斯塔斯和瓦锡兰。
为了提升竞争力,领先的企业正强调混合系统、全球合作伙伴关係和可扩展的模组化设计。 BW Ideol 和 Equinor 正在欧洲和北美增加浮动式离岸风电装置容量。 Karadeniz Holding 仍在向新兴市场派遣其「动力船」用于紧急电源。 GE Vernova 和西门子能源正致力于将浮动式再生能源与燃气涡轮机和电池储能係统结合。维斯塔斯和三菱重工之间的合作正在推动风力涡轮机整合浮动平台的发展。各企业也正在进军人工水体领域,依照当地法规和气候要求进行在地化部署。
目录
第一章:方法论与范围
第二章:执行摘要
第三章:行业洞察
- 产业生态系统分析
- 原料可用性和采购分析
- 製造能力评估
- 供应链弹性和风险因素
- 配电网路分析
- 监管格局
- 产业衝击力
- 成长动力
- 产业陷阱与挑战
- 成长潜力分析
- 波特的分析
- PESTEL分析
- 浮动电站成本结构分析
- 价格趋势分析
- 按地区
- 按容量
- 新兴机会和趋势
- 数位化和物联网集成
- 新兴市场渗透
- 投资分析及未来展望
第四章:竞争格局
- 介绍
- 按地区分析公司市场份额
- 北美洲
- 欧洲
- 亚太地区
- 中东和非洲
- 拉丁美洲
- 战略仪表板
- 策略倡议
- 重要伙伴关係与合作
- 重大併购活动
- 产品创新与发布
- 市场扩张策略
- 竞争基准测试
- 创新与技术格局
第五章:市场规模及预测:依电源分类,2021 - 2034
- 主要趋势
- 再生能源
- 太阳的
- 风
- 不可再生
- 瓦斯涡轮机
- 内燃机
第六章:市场规模及预测:依产能,2021 - 2034
- 主要趋势
- > 1 - 5 兆瓦
- > 5 - 20 兆瓦
- > 20 - 100 兆瓦
- > 100 兆瓦
第七章:市场规模及预测:依部署,2021 - 2034
- 主要趋势
- 船舶
- 驳船
- 模组化筏
- 其他的
第 8 章:市场规模与预测:按应用,2021 - 2034 年
- 主要趋势
- 人造水体
- 天然水体
第九章:市场规模及预测:按地区,2021 - 2034
- 主要趋势
- 北美洲
- 我们
- 加拿大
- 墨西哥
- 欧洲
- 英国
- 德国
- 法国
- 西班牙
- 亚太地区
- 中国
- 印度
- 日本
- 澳洲
- 中东和非洲
- 阿联酋
- 沙乌地阿拉伯
- 拉丁美洲
- 巴西
- 阿根廷
第十章:公司简介
- BW Ideol
- CGN New Energy Holdings
- CHN Energy
- Ciel & Terre
- Electricity Generating Authority of Thailand
- Equinor
- Floating Power Plant
- GE Vernova
- HEXA Renewables
- Karadeniz Holding
- Kawasaki Heavy Industries
- MAN Energy Solutions
- Mitsubishi Heavy Industries
- National Power Supply Public Company
- Ørsted
- RWE
- Siemens Energy
- SJVN Green Energy
- Sterling & Wilson Renewable Energy
- Swimsol
- Tata Power
- Vestas
- Wartsila
The global floating power plants market was valued at USD 3.9 billion in 2024 and is projected to grow from USD 4.2 billion in 2025 to USD 8.6 billion by 2034, expanding at a CAGR of 8.2%, according to the latest report published by Global Market Insights, Inc.
Floating power plants (FPPs) are on the rise as fast, deployable, flexible options to meet energy needs in regions with an abundance of water but a limited amount of land. These plants provide the ability to integrate renewable sources, lower transmission losses, and modulate load requirements without the need for large amounts of land.
| Market Scope | |
|---|---|
| Start Year | 2024 |
| Forecast Year | 2025-2034 |
| Start Value | $3.9 Billion |
| Forecast Value | $8.6 Billion |
| CAGR | 8.2% |
Key Drivers:
1. Emphasis on renewable energy integration: The emergence of floating solar/wind platforms allows countries to achieve clean energy goals without competing for limited land resources.
2. Need for fast deployment in offshore and island areas: The ability for FPPs to provide resilient energy to disadvantaged coastal and island communities without grid extension is immeasurable.
3. Land limitations and waterbody utilization issue: The public sector is pushing to use manmade lakes and reservoirs to produce clean power.
4. Modular and hybrid technology advancements: The advancement of hybrid floating producing platforms, which use solar, wind, and storage, is transforming the implementation of utility-scale renewables.
Key Players:
- The 5 leading players in the floating power plants market are CGN New Energy Holdings, Tata Power, Ciel & Terre, SJVN Green Energy, and National Power Supply Public Company, accounting for approximately 42% of the 2024 market.
- In quarter 3 FY 2025, Siemens Energy announced strong financial performance in the third quarter with revenue increasing by 13.5% on a comparable basis to USD 11.3 billion.
- In the first half of 2025, GE Vernova reported revenue of USD 17.1 billion.
- In Q3, 2025, Kawasaki Heavy Industries garnered revenue of USD 3.3 billion.
Key Challenges:
- High capital costs of deployment: The benefits of modularity have lessened costs, but the costs for the mooring and installation systems are still high for the first time.
- Environmental and regulatory requirements: This includes permitting and water rights related to site and environmental issues that may affect deployment, especially in sensitive marine habitats.
- Maintenance and mooring in all types of extreme weather: Offshore floating structures need to factor in saltwater corrosion and exposure to wind and wave conditions at all times.
1. By Power Source - Renewable Leading
Renewable floating power plants (especially solar and wind) dominated the market share in 2024. Increasingly rigorous environmental regulations and decarbonization goals are pushing utilities towards hybrid and solar-led floating generation technologies.
2. By Application - Manmade Water Bodies are at the Forefront
Due to simple permitting and consistent, steady water levels, manmade water bodies such as reservoirs, ponds, artificial lakes, and canals were the most prominent deployment locations. These job sites minimize potential complications around tides and wind wave action, preserving long-term FPP viability.
3. By Deployment - Modular Rafts Provide Mobilization
Modular raft systems were the most dominant system in the market in 2024. They offer mobilization and mobilization to units with standardization manufacturing, making these units valuable at both utility scale for grid situations as well as for rural electrification projects. Validation in this approach is also realized with lower maintenance and shorter times to upgrade.
With aspirational ambitions for clean energy, North America is being identified as a rapidly growing market. Onshore and offshore wind (U.S. East Coast), reservoir-based floating solar (California, Texas), and other segments are driving the floating power capacity of the region.
Key vendors in the floating power plants market are BW Ideol, CGN New Energy Holdings, CHN Energy, Ciel & Terre, Electricity Generating Authority of Thailand, Equinor, Floating Power Plant, GE Vernova, HEXA Renewables, Karadeniz Holding, Kawasaki Heavy Industries, MAN Energy Solutions, Mitsubishi Heavy Industries, National Power Supply Public Company, Orsted, RWE, Siemens Energy, SJVN Green Energy, Sterling & Wilson Renewable Energy, Swimsol, Tata Power, Vestas, and Wartsila.
To promote competitiveness, leading players are emphasizing hybrid systems, global partnerships, and scalable modular designs. BW Ideol and Equinor are increasing floating offshore wind capacity across Europe and North America. Karadeniz Holding is still sending its "Power Ships" out for emergency power supply in emerging markets. GE Vernova and Siemens Energy are emphasizing integrating floating renewables with gas turbines and battery storage. Collaborations like the one between Vestas and Mitsubishi Heavy Industries are driving wind-turbine-integrated floating platforms. Firms are also entering the manmade water bodies space with locally adapted deployments designed to meet regional regulatory and climatic requirements.
Table of Contents
Chapter 1 Methodology & Scope
- 1.1 Research design
- 1.1.1 Research approach
- 1.1.2 Data collection methods
- 1.1.3 Base estimates and calculations
- 1.1.4 Base year calculation
- 1.1.5 Key trends for market estimates
- 1.2 Forecast model
- 1.3 Primary research and validation
- 1.4 Some of the primary sources (but not limited to)
- 1.5 Data mining sources
- 1.5.1 Secondary
- 1.5.1.1 Paid sources
- 1.5.1.2 Public sources
- 1.5.1.3 Sources, by region
- 1.5.1 Secondary
- 1.6 Market definitions
Chapter 2 Executive Summary
- 2.1 Industry 360° synopsis, 2021 - 2034
- 2.2 Business trends
- 2.3 Power source trends
- 2.4 Capacity trends
- 2.5 Deployment trends
- 2.6 Application trends
- 2.7 Regional trends
Chapter 3 Industry Insights
- 3.1 Industry ecosystem analysis
- 3.1.1 Raw material availability & sourcing analysis
- 3.1.2 Manufacturing capacity assessment
- 3.1.3 Supply chain resilience & risk factors
- 3.1.4 Distribution network analysis
- 3.2 Regulatory landscape
- 3.3 Industry impact forces
- 3.3.1 Growth drivers
- 3.3.2 Industry pitfalls & challenges
- 3.4 Growth potential analysis
- 3.5 Porter's analysis
- 3.5.1 Bargaining power of suppliers
- 3.5.2 Bargaining power of buyers
- 3.5.3 Threat of new entrants
- 3.5.4 Threat of substitutes
- 3.6 PESTEL analysis
- 3.6.1 Political factors
- 3.6.2 Economic factors
- 3.6.3 Social factors
- 3.6.4 Technological factors
- 3.6.5 Legal factors
- 3.6.6 Environmental factors
- 3.7 Cost structure analysis of floating power plants
- 3.8 Price trend analysis
- 3.8.1 By region
- 3.8.2 By capacity
- 3.9 Emerging opportunities & trends
- 3.9.1 Digitalization and IoT integration
- 3.9.2 Emerging market penetration
- 3.10 Investment analysis & future outlook
Chapter 4 Competitive Landscape, 2025
- 4.1 Introduction
- 4.2 Company market share analysis, by region, 2024
- 4.2.1 North America
- 4.2.2 Europe
- 4.2.3 Asia Pacific
- 4.2.4 Middle East & Africa
- 4.2.5 Latin America
- 4.3 Strategic dashboard
- 4.4 Strategic initiatives
- 4.4.1 Key partnerships & collaborations
- 4.4.2 Major M&A activities
- 4.4.3 Product innovations & launches
- 4.4.4 Market expansion strategies
- 4.5 Competitive benchmarking
- 4.6 Innovation & technology landscape
Chapter 5 Market Size and Forecast, By Power Source, 2021 - 2034 (USD Million & MW)
- 5.1 Key trends
- 5.2 Renewable
- 5.2.1 Solar
- 5.2.2 Wind
- 5.3 Non-renewable
- 5.3.1 Gas turbine
- 5.3.2 IC engines
Chapter 6 Market Size and Forecast, By Capacity, 2021 - 2034 (USD Million & MW)
- 6.1 Key trends
- 6.2 > 1 - 5 MW
- 6.3 > 5 - 20 MW
- 6.4 > 20 - 100 MW
- 6.5 > 100 MW
Chapter 7 Market Size and Forecast, By Deployment, 2021 - 2034 (USD Million & MW)
- 7.1 Key trends
- 7.2 Ships
- 7.3 Barges
- 7.4 Modular rafts
- 7.5 Others
Chapter 8 Market Size and Forecast, By Application, 2021 - 2034 (USD Million & MW)
- 8.1 Key trends
- 8.2 Manmade water bodies
- 8.3 Natural water bodies
Chapter 9 Market Size and Forecast, By Region, 2021 - 2034 (USD Million & MW)
- 9.1 Key trends
- 9.2 North America
- 9.2.1 U.S.
- 9.2.2 Canada
- 9.2.3 Mexico
- 9.3 Europe
- 9.3.1 UK
- 9.3.2 Germany
- 9.3.3 France
- 9.3.4 Spain
- 9.4 Asia Pacific
- 9.4.1 China
- 9.4.2 India
- 9.4.3 Japan
- 9.4.4 Australia
- 9.5 Middle East & Africa
- 9.5.1 UAE
- 9.5.2 Saudi Arabia
- 9.6 Latin America
- 9.6.1 Brazil
- 9.6.2 Argentina
Chapter 10 Company Profiles
- 10.1 BW Ideol
- 10.2 CGN New Energy Holdings
- 10.3 CHN Energy
- 10.4 Ciel & Terre
- 10.5 Electricity Generating Authority of Thailand
- 10.6 Equinor
- 10.7 Floating Power Plant
- 10.8 GE Vernova
- 10.9 HEXA Renewables
- 10.10 Karadeniz Holding
- 10.11 Kawasaki Heavy Industries
- 10.12 MAN Energy Solutions
- 10.13 Mitsubishi Heavy Industries
- 10.14 National Power Supply Public Company
- 10.15 Ørsted
- 10.16 RWE
- 10.17 Siemens Energy
- 10.18 SJVN Green Energy
- 10.19 Sterling & Wilson Renewable Energy
- 10.20 Swimsol
- 10.21 Tata Power
- 10.22 Vestas
- 10.23 Wartsila
 浮体式发电厂市场:2026-2032年全球市场预测(依能源、输出、锚碇系统、安装类型、所有权类型和最终用户划分)
 浮体式发电厂市场规模、份额、成长及全球产业分析:按类型、应用和地区分類的洞察与预测(2026-2034 年)
 2026年全球浮体式发电厂市场报告
 浮式发电厂市场-全球产业规模、份额、趋势、机会及预测(依能源来源、容量、地区及竞争格局划分,2021-2031年)
 浮体式电站市场规模、份额和成长分析(按动力来源、额定功率和地区划分)—产业预测(2026-2033 年)全球浮体式发电厂市场-2025-2030年预测浮动核电厂 EPC 市场-全球产业规模、份额、趋势、机会和预测(按技术、按最终用户、按组件、按服务类型、按地区和竞争进行细分,2020-2030 年预测)
 全球浮体式发电厂市场:市场规模、市场份额和趋势分析(按电源、额定功率和地区)、按细分市场预测(2025-2030 年)
 至 2030 年浮体式核能发电厂EPC 市场预测:按类型、组件、技术、应用和地区进行的全球分析全球浮动发电厂市场规模(按来源、容量、地区、范围和预测)