


 |
市场调查报告书
商品编码
1892685
集换式卡牌游戏市场机会、成长驱动因素、产业趋势分析及预测(2026-2035年)Trading Card Games Market Opportunity, Growth Drivers, Industry Trend Analysis, and Forecast 2026 - 2035 |
||||||
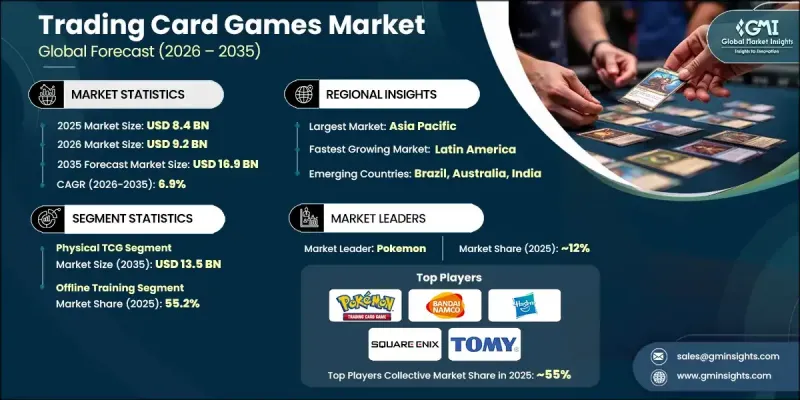
2025 年全球集换式卡牌游戏市场价值 84 亿美元,预计到 2035 年将以 6.9% 的复合年增长率增长至 169 亿美元。
随着区块链技术和NFT的出现,集换式卡牌游戏(TCG)产业格局正在经历一场重大变革,它们为数位资产的认证和所有权历史的确认提供了新的方式。许多历史悠久的集换式卡牌品牌正在开发可验证真实性的数位收藏卡,从而将传统收藏体验与现代数位互动完美融合。这种转变为发行商带来了新的机会,也吸引了那些重视数位购买透明度和安全性的新兴收藏家群体。数位资产作用的扩展正在创造新的参与形式,使收藏家能够跨平台与他们喜爱的作品互动。 TCG公司与娱乐品牌之间的合作项目正在推动这一趋势,扩大消费者覆盖面,并增强粉丝忠诚度。这些合作关係有助于新作品迅速获得认可,并使发行商更容易进入竞争激烈的市场。
| 市场范围 | |
|---|---|
| 起始年份 | 2025 |
| 预测年份 | 2026-2035 |
| 起始值 | 84亿美元 |
| 预测值 | 169亿美元 |
| 复合年增长率 | 6.9% |
实体集换式卡牌游戏市场在2025年创造了70亿美元的收入,预计到2035年将达到135亿美元。实体卡牌仍然深受收藏家的青睐,他们追求的是具有展示价值和长期投资潜力的实物。拥有和交换实体收藏品的乐趣推动了稳定的需求,并促进了其价值的增值。
2025年,线下零售市场规模将达到46亿美元,约占市占率的55.2%。分销管道包括爱好商店、大型商品零售商、漫画店、便利商店和专业游戏场所。专业游戏商店发挥核心作用,因为它们有助于促进社群互动,组织线下游戏活动,为玩家提供与专业店员交流的机会,并提供数位平台无法完全复製的产品和体验。
2025年美国集换式卡牌游戏市场规模达22亿美元,预计2026年至2035年将以8%的复合年增长率成长。美国占北美集换式卡牌游戏收入的近81%,加拿大贡献了剩余的19%。美国收藏家依然对经典系列情有独钟,即使市场不断涌现新的竞争者,这些经典系列也持续保持领先地位。
目录
第一章:方法论与范围
第二章:执行概要
第三章:行业洞察
- 产业生态系分析
- 出版商格局
- 利润率
- 每个阶段的价值增加
- 影响价值链的因素
- 产业影响因素
- 成长驱动因素
- 产业陷阱与挑战
- 机会
- 成长潜力分析
- 未来市场趋势
- 监理框架
- 按地区
- 波特五力分析
- PESTEL 分析
第四章:竞争格局
- 介绍
- 公司市占率分析
- 按地区
- 公司矩阵分析
- 主要市场参与者的竞争分析
- 竞争定位矩阵
- 产品组合基准测试
- 关键进展
- 併购
- 合作伙伴关係与合作
- 新产品发布
- 扩张计划
第五章:市场估算与预测:依产品类型划分 2022-2035 年
- 实体集换式卡牌游戏
- 补充包
- 补充包
- 起始牌
- 收藏品/高端产品
- 罐装和泡罩包装
- 数位集换式卡牌游戏
第六章:市场估算与预测:依特许经营类型划分,2022-2035年
- 宝可梦
- 万智牌
- 游戏王
- 动漫/漫画集换式卡牌游戏
- 星际大战
- 其他(先锋等)
第七章:市场估价与预测:依发行类型划分,2022-2035年
- 标准套装
- 特别版/限量版
- 促销产品
- 重印/再版
第八章:市场估算与预测:依价格区间划分,2022-2035年
- 经济型(3-15美元)
- 中檔(15 美元 - 50 美元)
- 高级版(50 美元 - 150 美元)
- 超高端(150 美元以上)
第九章:市场估算与预测:依消费族群划分,2022-2035年
- 玩家/游戏玩家
- 投资者/收藏家
- 儿童/家庭
第十章:市场估价与预测:依配销通路划分,2022-2035年
- 在线的
- 电子商务网站
- 公司自有网站
- 离线
- 大众零售商店
- 专卖店
- 其他的
第十一章:市场估计与预测:按地区划分,2022-2035年
- 北美洲
- 我们
- 加拿大
- 欧洲
- 德国
- 英国
- 法国
- 义大利
- 西班牙
- 亚太地区
- 中国
- 印度
- 日本
- 韩国
- 澳洲
- 拉丁美洲
- 巴西
- 墨西哥
- 阿根廷
- MEA
- 阿联酋
- 沙乌地阿拉伯
- 南非
第十二章:公司简介
- Bandai Namco
- Bushiroad Inc.
- Fanatics/Topps
- Fantasy Flight
- Hasbro
- Kayou
- Konami
- Legend Story Studios
- Nintendo Co., Ltd.
- Panini SpA
- Pokemon
- Ravensburger AG
- Square Enix
- Tomy Co. Ltd.
- Upper Deck Company
The Global Trading Card Games Market was valued at USD 8.4 billion in 2025 and is estimated to grow at a CAGR of 6.9% to reach USD 16.9 billion by 2035.
The landscape of the TCG industry is undergoing a major transformation as blockchain technology and NFTs introduce new ways to authenticate digital assets and confirm ownership history. Many long-standing trading card brands are developing digital collectible cards that maintain verifiable authenticity, helping bridge the experience of traditional collecting with modern digital engagement. This shift is bringing new opportunities for publishers and appealing to emerging collector communities who value transparency and security in their digital purchases. The expanded role of digital assets is creating new forms of participation, enabling collectors to interact with their favorite franchises across multiple platforms. Collaborative projects between TCG companies and entertainment brands are expanding this momentum, broadening consumer reach, and strengthening fan loyalty. These partnerships help new titles gain immediate recognition and make it easier for publishers to enter a highly competitive market.
| Market Scope | |
|---|---|
| Start Year | 2025 |
| Forecast Year | 2026-2035 |
| Start Value | $8.4 Billion |
| Forecast Value | $16.9 Billion |
| CAGR | 6.9% |
The physical trading card games segment generated USD 7 billion in 2025 and is forecasted to reach USD 13.5 billion by 2035. Physical cards remain deeply valued by collectors who seek tangible items with display appeal and long-term investment potential. The enjoyment of owning and exchanging physical collectibles drives steady demand and contributes to their ability to appreciate in value.
The offline retail segment generated USD 4.6 billion in 2025, representing about 55.2% of the market. Distribution involves hobby shops, mass merchandise retailers, comic stores, convenience outlets, and dedicated gaming venues. Specialty gaming stores play a central role because they support community interaction, facilitate in-person play events, connect players with knowledgeable staff, and provide immediate access to products and an experience that digital platforms cannot fully replicate.
U.S. Trading Card Games Market generated USD 2.2 billion in 2025 and is expected to grow at a CAGR of 8% from 2026 to 2035. The US accounts for nearly 81% of North American TCG revenue, with Canada contributing the remaining 19%. Collectors in the United States remain strongly attached to established franchises, and these titles continue to secure leading positions even as the market welcomes new competitors.
Key companies active in the Trading Card Games Market include Bandai Namco, Bushiroad Inc., Fanatics/Topps, Fantasy Flight, Hasbro, Kayou, Konami, Legend Story Studios, Nintendo Co., Ltd., Panini S.p.A., Pokemon, Ravensburger AG, Square Enix, Tomy Co. Ltd., and Upper Deck Company. Companies in the trading card games market are strengthening their competitive position by expanding cross-media partnerships, enhancing product storytelling, and investing in collectible innovations across physical and digital formats. Many publishers are adopting blockchain-based verification tools to increase consumer trust while developing premium card lines to attract long-term collectors. Firms are also focusing on organized play programs to build community engagement and encourage repeat purchases. Limited-edition releases, diversified licensing agreements, and franchise tie-ins remain central to sustaining brand visibility. To support global demand, companies continue to increase production capacity, streamline distribution networks, and enhance regional market penetration.
Table of Contents
Chapter 1 Methodology & Scope
- 1.1 Market scope and definition
- 1.2 Research design
- 1.2.1 Research approach
- 1.2.2 Data collection methods
- 1.3 Data mining sources
- 1.3.1 Global
- 1.3.2 Regional/Country
- 1.4 Base estimates and calculations
- 1.4.1 Base year calculation
- 1.4.2 Key trends for market estimation
- 1.5 Primary research and validation
- 1.5.1 Primary sources
- 1.6 Forecast model
- 1.7 Research assumptions and limitations
Chapter 2 Executive Summary
- 2.1 Industry 360° synopsis
- 2.2 Key market trends
- 2.2.1 Product type trends
- 2.2.2 Franchise trends
- 2.2.3 Release type trends
- 2.2.4 Price range trends
- 2.2.5 Consumer group trends
- 2.2.6 Distribution channel trends
- 2.3 CXO perspective: Strategic imperatives
- 2.3.1 Key decision points for industry executives
- 2.3.2 Critical success factors for market players
- 2.4 Future outlook and strategic recommendations
- 2.5 Strategic recommendations
- 2.5.1 Supply chain diversification strategy
- 2.5.2 Product portfolio enhancement
- 2.5.3 Partnership and alliance opportunities
- 2.5.4 Cost management and pricing strategy
- 2.6 Decision framework
- 2.6.1 Investment priority matrix
- 2.6.2 ROI analysis
Chapter 3 Industry Insights
- 3.1 Industry ecosystem analysis
- 3.1.1 Publisher Landscape
- 3.1.2 Profit Margin
- 3.1.3 Value addition at each stage
- 3.1.4 Factor affecting the value chain
- 3.2 Industry impact forces
- 3.2.1 Growth drivers
- 3.2.2 Industry pitfalls & challenges
- 3.2.3 Opportunities
- 3.3 Growth potential analysis
- 3.4 Future market trends
- 3.5 Regulatory framework
- 3.5.1 By region
- 3.6 Porter's five forces analysis
- 3.7 PESTEL analysis
Chapter 4 Competitive Landscape, 2025
- 4.1 Introduction
- 4.2 Company market share analysis
- 4.2.1 By Region
- 4.3 Company matrix analysis
- 4.4 Competitive analysis of major market players
- 4.5 Competitive positioning matrix
- 4.6 Product portfolio benchmarking
- 4.7 Key developments
- 4.7.1 Mergers & acquisitions
- 4.7.2 Partnerships & collaborations
- 4.7.3 New Product Launches
- 4.7.4 Expansion Plans
Chapter 5 Market Estimates & Forecast, By Product Type 2022 - 2035 (USD Billion) (Million Cards)
- 5.1 Key trends
- 5.2 Physical TCG
- 5.2.1 Booster Packs
- 5.2.2 Booster Boxes
- 5.2.3 Starter Decks
- 5.2.4 Collector/Premium Products
- 5.2.5 Tins & Blister Packs
- 5.3 Digital TCG
Chapter 6 Market Estimates & Forecast, By Franchise, 2022 - 2035 (USD Billion) (Million Cards)
- 6.1 Key trends
- 6.2 Pokemon
- 6.3 Magic: The Gathering
- 6.4 Yu-Gi-Oh!
- 6.5 Anime/Manga TCGs
- 6.6 Star Wars
- 6.7 Others (Vanguard, etc.)
Chapter 7 Market Estimates & Forecast, By Release Type, 2022 - 2035 (USD Billion) (Million Cards)
- 7.1 Key trends
- 7.2 Standard Sets
- 7.3 Special/Limited Editions
- 7.4 Promotional Products
- 7.5 Reprints/Reissues
Chapter 8 Market Estimates & Forecast, By Price Range, 2022 - 2035 (USD Billion) (Million Cards)
- 8.1 Key trends
- 8.2 Economy (USD 3- USD 15)
- 8.3 Mid-Tier (USD 15 - USD 50)
- 8.4 Premium (USD 50 - USD 150)
- 8.5 Ultra-Premium (Above USD 150)
Chapter 9 Market Estimates & Forecast, By Consumer Group, 2022 - 2035 (USD Billion) (Million Cards)
- 9.1 Key trends
- 9.2 Players/Gamers
- 9.3 Investors/Collector
- 9.4 Children/Families
Chapter 10 Market Estimates & Forecast, By Distribution Channel, 2022 - 2035, (USD Billion) (Million Cards)
- 10.1 Key trends
- 10.2 Online
- 10.2.1 E-commerce website
- 10.2.2 Company owned website
- 10.3 Offline
- 10.3.1 Mass Retail Stores
- 10.3.2 Specialty Stores
- 10.3.3 Others
Chapter 11 Market Estimates & Forecast, By Region, 2022 - 2035, (USD Billion) (Million Cards)
- 11.1 Key trends
- 11.2 North America
- 11.2.1 U.S.
- 11.2.2 Canada
- 11.3 Europe
- 11.3.1 Germany
- 11.3.2 U.K.
- 11.3.3 France
- 11.3.4 Italy
- 11.3.5 Spain
- 11.4 Asia Pacific
- 11.4.1 China
- 11.4.2 India
- 11.4.3 Japan
- 11.4.4 South Korea
- 11.4.5 Australia
- 11.5 Latin America
- 11.5.1 Brazil
- 11.5.2 Mexico
- 11.5.3 Argentina
- 11.6 MEA
- 11.6.1 UAE
- 11.6.2 Saudi Arabia
- 11.6.3 South Africa
Chapter 12 Company Profiles (Business Overview, Financial Data, Product Landscape, Strategic Outlook, SWOT Analysis)
- 12.1 Bandai Namco
- 12.2 Bushiroad Inc.
- 12.3 Fanatics/Topps
- 12.4 Fantasy Flight
- 12.5 Hasbro
- 12.6 Kayou
- 12.7 Konami
- 12.8 Legend Story Studios
- 12.9 Nintendo Co., Ltd.
- 12.10 Panini S.p.A.
- 12.11 Pokemon
- 12.12 Ravensburger AG
- 12.13 Square Enix
- 12.14 Tomy Co. Ltd.
- 12.15 Upper Deck Company
 按产品类型、格式、价格范围、年龄层、分销管道和应用分類的集换式卡牌市场-2026年至2032年全球预测
 行动集换式卡牌游戏(TCG):全球市场份额和排名、总收入和需求预测(2025-2031 年)收藏卡:全球市场占有率和排名、总收入和需求预测(2025-2031年)热门集换式卡牌:全球市场份额和排名、总销售额和需求预测(2025-2031年)集换式卡牌:全球市场份额和排名、总收入和需求预测(2025-2031年)
 全球集换式卡牌游戏市场
 全球集换式卡牌游戏市场行动集换式卡牌游戏市场按游戏机制、年龄层、模组、平台类型、受众人口统计和收益模式划分 - 2025 年至 2030 年全球预测
 行动交换卡游戏(TCG)的全球市场:2030年为止的预测
 收藏集换卡牌的全球市场:2030年为止的预测