


 |
市场调查报告书
商品编码
1892714
自动驾驶共享出行服务市场机会、成长驱动因素、产业趋势分析及预测(2025-2034年)Autonomous Ride-Sharing Services Market Opportunity, Growth Drivers, Industry Trend Analysis, and Forecast 2025 - 2034 |
||||||
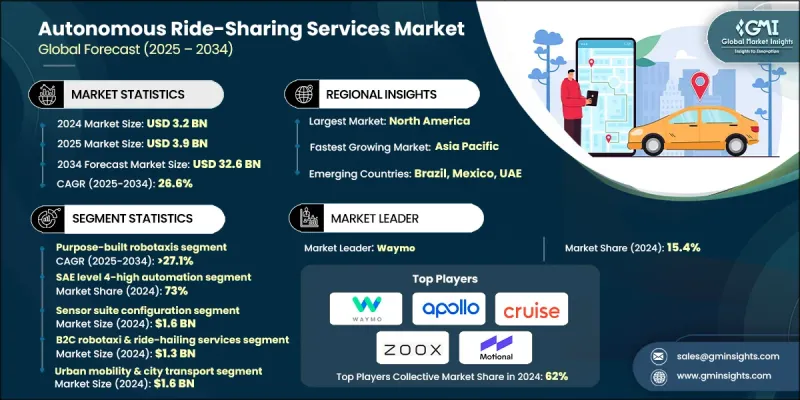
2024 年全球自动驾驶共享旅游服务市场价值为 32 亿美元,预计到 2034 年将以 26.6% 的复合年增长率成长至 326 亿美元。
快速发展的自动驾驶系统创新、日益增长的经济型城市出行需求以及对智慧交通网络投资的不断扩大,共同推动了自动驾驶共享出行平台的普及。随着城市致力于缓解交通压力、减少排放并提高出行效率,自动驾驶共享出行平台正成为未来交通运输中可扩展的支柱。人工智慧感知、先进的自动化功能、连网感测器、高速网路和即时车队智慧的融合,正在重塑自动驾驶车队的运作方式。这些技术支援精准操控、预测路线规划、碰撞规避决策流程以及对车辆性能的持续监控。透过自适应学习模型、路线模拟环境和云端协调的车队工具,营运商能够提升安全性、减少营运中断,并提供更快捷、更可靠的按需出行服务。自动驾驶共享出行平台、协调的车队管理系统、整合式出行即服务框架和自动调度技术的扩展,也加速了其应用。这些解决方案简化了用户註册流程,支援响应式定价,增强了与道路基础设施的通信,并实现了多种出行方式之间的更顺畅协调。出行服务提供者、技术开发商和交通运输机构之间的合作,正在进一步推动共享和私人出行环境中的自动驾驶出行。
| 市场范围 | |
|---|---|
| 起始年份 | 2024 |
| 预测年份 | 2025-2034 |
| 起始值 | 32亿美元 |
| 预测值 | 326亿美元 |
| 复合年增长率 | 26.6% |
2024年,专用无人驾驶计程车市占率达到48%,预计到2034年将以27.1%的年增长率持续成长。该细分市场之所以占据领先地位,是因为其车辆专为自动驾驶而设计,配备了高冗余度的感测系统、优化的共享内装以及高效的电力基础。这些车辆能够实现更低的营运成本、更高的利用率和可扩展的部署,从而巩固了其在各大都会地区的市场主导地位。
2024年,SAE 4级高自动化系统市占率达到73%,预计2025年至2034年间将以26.2%的年成长率成长。这个类别之所以占据领先地位,是因为它支援在预定义运行区域内实现完全自主运行,从而在结构化环境中建立可靠的商用车队。营运商越来越多地选择4级系统,原因在于其性能稳定、对人工监控的依赖性降低以及与现有行动基础设施的兼容性。
美国自动驾驶共享旅游服务市场占88%的份额,预计2024年市场规模将达到11亿美元。该地区的强劲地位得益于其强大的数位化能力、高度发展的出行生态系统以及对自动驾驶技术的早期应用。有利的监管环境、广泛的测试项目以及对大规模车队部署的大量投资,使北美成为全球领先者,而用户对更安全、更清洁、更高效的出行方式日益增长的需求,进一步巩固了北美在该领域的领先地位。
目录
第一章:方法论与范围
第二章:执行概要
第三章:行业洞察
- 产业生态系分析
- 供应商格局
- 利润率
- 成本结构
- 每个阶段的价值增加
- 影响价值链的因素
- 中断
- 产业影响因素
- 成长驱动因素
- 自动驾驶技术的快速发展
- 对经济高效的城市交通的需求日益增长
- 政府大力推动智慧交通和低排放出行
- 科技巨头和出行业者的投资不断增加
- 产业陷阱与挑战
- 自动驾驶车队部署成本高
- 监管和安全方面的不确定性
- 市场机会
- 拓展至智慧城市与旅游即服务(MaaS)领域
- 采用电动自动驾驶车队
- 企业、校园与封闭环境的流动性
- 技术进步与人工智慧融合
- 成长驱动因素
- 成长潜力分析
- 监管环境
- 联邦法规(NHTSA、FMCSA、FTA 指南)
- 州级许可和测试要求
- 地方法规(路边管理、地理围篱、营业时间)
- ADA合规性和无障碍要求
- 安全标准与自愿性自我评估
- 责任与保险框架
- 资料隐私和网路安全法规
- 国际监管协调
- 波特的分析
- PESTEL 分析
- 技术与创新格局
- 感测器技术演进(光达、雷达、摄影机、融合)
- 感知与定位演算法
- 运动规划与控制系统
- 高清地图和无地图导航方法
- V2 X 通讯与协作自动化
- 远端操作和遥操作系统
- 网路安全与资料隐私技术
- 无障碍车辆设计及自动化安全系统
- 价格趋势
- 按地区
- 副产品
- 成本細項分析
- 专利分析
- 永续性和环境方面
- 永续实践
- 减少废弃物策略
- 生产中的能源效率
- 环保倡议
- 最佳情况
- 专利与智慧财产权分析
- 按技术领域分類的专利申请趋势
- 主要专利持有者(Waymo、Cruise、Zoox、Motional、Aurora)
- 感测器融合与知觉专利格局
- 运动规划与控制专利集群
- 高清地图和定位 IP
- 专利诉讼与许可动态
- 投资与融资分析
- 创投与私募股权投资趋势
- 企业策略投资
- 联邦拨款项目
- 公开市集活动
- 开发阶段的资金
- 投资的地理分布
- 运行设计域(ODD)分析
- 地理 ODD 限制(地理围栏、城市覆盖范围)
- 道路类型 ODD(城市干道、高速公路、住宅街道)
- 速度范围 ODD
- 天气与环境异常
- ODD 扩展策略及时间表
- 无障碍设计与通用设计实施标准
- ADA对自动驾驶共享出行的合规要求
- 无障碍车辆设计要求
- 无障碍人机介面
- 寻路与导航辅助
- 联邦无障碍研究与资助
- 自动驾驶车辆的通用设计原则
- 合规性监控与执行
- 远端操作与远端操作基础设施分析
- 远端运维架构及用例
- 远端操作与远端协助的区别
- 美国国家公路交通安全管理局 (NHTSA) 对远端操作安全性的研究
- 网路基础设施需求
- 远端营运中心设计
- 远端操作的监管要求
- 经济因素
- 基础设施依赖性和生态系统准备度评估
- 道路基础设施需求
- 车路通讯(V2I)
- 电动自动驾驶车队的充电基础设施
- 高清地图基础设施及维护
- 路边空间管理与上下客区
- 电信基础设施
- 生态系准备度评估框架
第四章:竞争格局
- 介绍
- 公司市占率分析
- 北美洲
- 欧洲
- 亚太地区
- 拉丁美洲
- 中东和非洲
- 主要市场参与者的竞争分析
- 竞争定位矩阵
- 战略展望矩阵
- 关键进展
- 併购
- 合作伙伴关係与合作
- 新产品发布
- 扩张计划和资金
第五章:市场估算与预测:依自动化程度划分,2021-2034年
- SAE 4级-高度自动化
- SAE 5级-全自动
第六章:市场估计与预测:依技术平台划分,2021-2034年
- 感测器套件配置
- 光达-主系统
- 雷达演进系统
- 多模态感测器融合
- 运算架构
- 连接类型
- 地图绘製与定位方法
第七章:市场估算与预测:依服务模式划分,2021-2034年
- B2C 机器人计程车与叫车服务
- B2B 企业及校园接驳车服务
- B2G市政与交通综合服务
- 机场及专用通道接驳车
第八章:市场估算与预测:依车辆类型划分,2021-2034年
- 专用无人计程车
- 乘用车和轿车
- 厢型车和多用途车辆
- 低速自动穿梭巴士
- 全尺寸公车(40英尺以上)
第九章:市场估计与预测:依应用领域划分,2021-2034年
- 城市交通与城市交通
- 首末公里交通连接
- 校园及封闭环境交通
- 农村和欠发达地区的流动性
- 辅助客运与无障碍服务
第十章:市场估计与预测:依地区划分,2021-2034年
- 北美洲
- 我们
- 加拿大
- 欧洲
- 英国
- 德国
- 法国
- 义大利
- 西班牙
- 比利时
- 荷兰
- 瑞典
- 亚太地区
- 中国
- 印度
- 日本
- 澳洲
- 新加坡
- 韩国
- 越南
- 印尼
- 拉丁美洲
- 巴西
- 墨西哥
- 阿根廷
- MEA
- 阿联酋
- 南非
- 沙乌地阿拉伯
第十一章:公司简介
- Global Player
- Cruise LLC
- Geely/Zeekr
- General Motors
- Hyundai Motor Group
- Jaguar Land Rover
- Motional
- Toyota Motor Corporation
- Volkswagen Group
- Waymo LLC
- Zoox Inc.
- Regional Player
- Alphabet Inc.
- Amazon
- Aptiv PLC
- Continental AG
- EasyMile
- Intel/Mobileye
- May Mobility
- New Flyer
- NVIDIA Corporation
- Qualcomm
- 新兴参与者
- Aurora Innovation
- Beep Inc.
- Innoviz Technologies
- Luminar Technologies
- Perrone Robotics
The Global Autonomous Ride-Sharing Services Market was valued at USD 3.2 billion in 2024 and is estimated to grow at a CAGR of 26.6% to reach USD 32.6 billion by 2034.
Growth is fueled by fast-moving innovation in autonomous driving systems, increasing demand for affordable urban travel options, and expanding investment in intelligent transportation networks. As cities work toward reducing traffic pressure, cutting emissions, and improving mobility efficiency, autonomous ride-sharing platforms are becoming a scalable pillar of future transportation. The fusion of AI-based perception, advanced automation features, connected sensors, high-speed networks, and real-time fleet intelligence is reshaping how self-driving fleets function. These technologies support accurate maneuvering, predictive routing, collision-avoidance decision processes, and continuous monitoring of vehicle performance. Through adaptive learning models, route simulation environments, and cloud-coordinated fleet tools, operators improve safety outcomes, reduce operational disruptions, and deliver quicker and more dependable mobility on demand. Adoption is also gaining momentum with the expansion of autonomous ride-service platforms, orchestrated fleet management systems, integrated mobility-as-a-service frameworks, and automated dispatch technologies. These solutions streamline user onboarding, support responsive pricing, enhance communication with roadway infrastructure, and enable smoother coordination across multiple modes of travel. Collaboration among mobility providers, technology developers, and transportation agencies is further advancing autonomous mobility in both shared and private travel settings.
| Market Scope | |
|---|---|
| Start Year | 2024 |
| Forecast Year | 2025-2034 |
| Start Value | $3.2 Billion |
| Forecast Value | $32.6 Billion |
| CAGR | 26.6% |
The purpose-built robotaxis category held a 48% share in 2024 and is projected to grow at a 27.1% through 2034. This segment leads due to vehicles designed specifically for autonomous operation, engineered with high-redundancy sensing, optimized interiors for shared use, and efficient electric foundations. Their ability to achieve lower operating costs, higher utilization, and scalable deployment has reinforced their dominance across major metropolitan areas.
The SAE Level 4-High Automation segment accounted for a 73% share in 2024 and is set to grow at 26.2% from 2025 to 2034. This category leads because it supports fully autonomous service within predefined operating zones, enabling dependable commercial fleets across structured environments. Operators increasingly choose Level 4 systems due to their consistent performance, reduced reliance on human monitors, and compatibility with existing mobility infrastructure.
US Autonomous Ride-Sharing Services Market held an 88% share, generating USD 1.1 billion in 2024. The region's strong position reflects robust digital capabilities, a highly developed mobility ecosystem, and early adoption of autonomous technologies. Supportive regulatory pathways, extensive testing programs, and significant investment in large-scale fleet rollout have positioned North America as a global leader, strengthened by rising user interest in safer, cleaner, and more efficient mobility options.
Major companies active in the Autonomous Ride-Sharing Services Market include Hyundai Motor Group, Zoox, Cruise, Waymo, Baidu Apollo, Motional, General Motors, AutoX, Pony.ai, and Jaguar Land Rover. Companies in the Autonomous Ride-Sharing Services Market are enhancing their market foothold by accelerating development of autonomous driving stacks, investing in scalable electric fleet platforms, and expanding AI-based operational intelligence. Many firms focus on forming alliances with automakers, software developers, and mobility partners to secure technology integration and broaden deployment opportunities. Continuous testing across controlled environments helps improve system reliability and regulatory acceptance.
Table of Contents
Chapter 1 Methodology & Scope
- 1.1 Market scope and definition
- 1.2 Research design
- 1.2.1 Research approach
- 1.2.2 Data collection methods
- 1.3 Data mining sources
- 1.3.1 Global
- 1.3.2 Regional/Country
- 1.4 Base estimates and calculations
- 1.4.1 Base year calculation
- 1.4.2 Key trends for market estimation
- 1.5 Primary research and validation
- 1.5.1 Primary sources
- 1.6 Forecast
- 1.7 Research assumptions and limitations
Chapter 2 Executive Summary
- 2.1 Industry 3600 synopsis, 2021 - 2034
- 2.2 Key market trends
- 2.2.1 Regional
- 2.2.2 Automation level
- 2.2.3 Technology platform
- 2.2.4 Service model
- 2.2.5 Vehicle
- 2.2.6 Application
- 2.3 TAM Analysis, 2025-2034
- 2.4 CXO perspectives: Strategic imperatives
- 2.4.1 Executive decision points
- 2.4.2 Critical success factors
- 2.5 Future outlook and strategic recommendations
Chapter 3 Industry Insights
- 3.1 Industry ecosystem analysis
- 3.1.1 Supplier Landscape
- 3.1.2 Profit Margin
- 3.1.3 Cost structure
- 3.1.4 Value addition at each stage
- 3.1.5 Factor affecting the value chain
- 3.1.6 Disruptions
- 3.2 Industry impact forces
- 3.2.1 Growth drivers
- 3.2.1.1 Rapid advancements in autonomous driving technologies
- 3.2.1.2 Rising demand for cost-efficient urban mobility
- 3.2.1.3 Government push for smart transportation & low-emission mobility
- 3.2.1.4 Increasing investments from tech giants & mobility operators
- 3.2.2 Industry pitfalls and challenges
- 3.2.2.1 High cost of autonomous fleet deployment
- 3.2.2.2 Regulatory & safety uncertainty
- 3.2.3 Market opportunities
- 3.2.3.1 Expansion into smart cities & mobility-as-a-service (maas)
- 3.2.3.2 Adoption of electric autonomous fleets
- 3.2.3.3 Corporate, campus, and closed-environment mobility
- 3.2.3.4 Technological advancements and AI integration
- 3.2.1 Growth drivers
- 3.3 Growth potential analysis
- 3.4 Regulatory landscape
- 3.4.1 Federal regulations (NHTSA, FMCSA, FTA guidance)
- 3.4.2 State-level permitting & testing requirements
- 3.4.3 Local ordinances (curb management, geofencing, operating hours)
- 3.4.4 Ada compliance & accessibility mandates
- 3.4.5 Safety standards & voluntary self-assessments
- 3.4.6 Liability & insurance framework
- 3.4.7 Data privacy & cybersecurity regulations
- 3.4.8 International regulatory harmonization
- 3.5 Porter's analysis
- 3.6 PESTEL analysis
- 3.7 Technology and Innovation Landscape
- 3.7.1 Sensor technology evolution (lidar, radar, camera, fusion)
- 3.7.2 Perception & localization algorithms
- 3.7.3 Motion planning & control systems
- 3.7.4 HD mapping & map-less navigation approaches
- 3.7.5. V2 X communication & cooperative automation
- 3.7.6 Remote operations & teleoperation systems
- 3.7.7 Cybersecurity & data privacy technologies
- 3.7.8 Accessible vehicle design & automated securement systems
- 3.8 Price trends
- 3.8.1 By region
- 3.8.2 By product
- 3.9 Cost breakdown analysis
- 3.10 Patent analysis
- 3.11 Sustainability and Environmental Aspects
- 3.11.1 Sustainable practices
- 3.11.2 Waste reduction strategies
- 3.11.3 Energy efficiency in production
- 3.11.4 Eco-friendly initiatives
- 3.12 Best case scenarios
- 3.13 Patent & Intellectual Property Analysis
- 3.13.1 Patent filing trends by technology domain
- 3.13.2 Leading patent holders (waymo, cruise, zoox, motional, aurora)
- 3.13.3 Sensor fusion & perception patent landscape
- 3.13.4 Motion planning & control patent clusters
- 3.13.5 HD mapping & localization IP
- 3.13.6 Patent litigation & licensing dynamics
- 3.14 Investment & Funding Analysis
- 3.14.1 Venture capital & private equity investment trends
- 3.14.2 Corporate strategic investments
- 3.14.3 Federal grant programs
- 3.14.4 Public market activity
- 3.14.5 Funding by development stage
- 3.14.6 Geographic distribution of investment
- 3.15 Operational Design Domain (ODD) Analysis
- 3.15.1 Geographic ODD Constraints (Geofencing, City Coverage)
- 3.15.2 Road Type ODD (Urban Arterials, Highways, Residential Streets)
- 3.15.3 Speed Range ODD
- 3.15.4 Weather & Environmental ODD
- 3.15.5 ODD Expansion Strategies & Timelines
- 3.16 Accessibility & Universal Design Implementation Standards
- 3.16.1 ADA compliance requirements for autonomous ride-sharing
- 3.16.2 Accessible vehicle design requirements
- 3.16.3 Accessible human-machine interface
- 3.16.4 Wayfinding & navigation assistance
- 3.16.5 Federal accessibility research & funding
- 3.16.6 Universal design principles for autonomous vehicles
- 3.16.7 Compliance monitoring & enforcement
- 3.17 Remote Operations & Teleoperation Infrastructure Analysis
- 3.17.1 Remote operations architecture & use cases
- 3.17.2 Teleoperation vs. Remote assistance distinction
- 3.17.3 NHTSA research on remote operations safety
- 3.17.4 Network infrastructure requirements
- 3.17.5 Remote operations center design
- 3.17.6 Regulatory requirements for remote operations
- 3.17.7 Economic considerations
- 3.18 Infrastructure Dependencies & Ecosystem Readiness Assessment
- 3.18.1 Road infrastructure requirements
- 3.18.2 Vehicle-to-infrastructure (V2I) communication
- 3.18.3 Charging infrastructure for electric autonomous fleets
- 3.18.4 HD mapping infrastructure & maintenance
- 3.18.5 Curb space management & pick-up/drop-off zones
- 3.18.6 Telecommunications infrastructure
- 3.18.7 Ecosystem readiness assessment framework
Chapter 4 Competitive Landscape, 2024
- 4.1 Introduction
- 4.2 Company market share analysis
- 4.2.1 North America
- 4.2.2 Europe
- 4.2.3 Asia Pacific
- 4.2.4 Latin America
- 4.2.5 Middle East & Africa
- 4.3 Competitive analysis of major market players
- 4.4 Competitive positioning matrix
- 4.5 Strategic outlook matrix
- 4.6 Key developments
- 4.6.1 Mergers & acquisitions
- 4.6.2 Partnerships & collaborations
- 4.6.3 New product launches
- 4.6.4 Expansion plans and funding
Chapter 5 Market Estimates & Forecast, By Automation Level, 2021 - 2034 ($ Bn)
- 5.1 Key trends
- 5.2 SAE level 4-high automation
- 5.3 SAE level 5-full automation
Chapter 6 Market Estimates & Forecast, By Technology Platform, 2021 - 2034 ($ Bn)
- 6.1 Key trends
- 6.2 Sensor suite configuration
- 6.2.1 Lidar-primary system
- 6.2.2 Radar-evolving system
- 6.2.3 Multi-modal sensor fusion
- 6.3 Compute architecture
- 6.4 Connectivity type
- 6.5 Mapping & localization approach
Chapter 7 Market Estimates & Forecast, By Service Model, 2021 - 2034 ($ Bn, Fleet Size)
- 7.1 Key trends
- 7.2 B2C robotaxi & ride-hailing services
- 7.3 B2B corporate & campus shuttle services
- 7.4 B2G municipal & transit-integrated services
- 7.5 Airport & specialized corridor shuttles
Chapter 8 Market Estimates & Forecast, By Vehicle, 2021 - 2034 ($ Bn, Fleet Size)
- 8.1 Key trends
- 8.2 Purpose-built robotaxis
- 8.3 Passenger cars & sedans
- 8.4 Vans & multi-purpose vehicles
- 8.5 Low-speed automated shuttles
- 8.6 Full-size transit buses (40-ft+)
Chapter 9 Market Estimates & Forecast, By Application, 2021 - 2034 ($ Bn, Fleet Size)
- 9.1 Key trends
- 9.2 Urban mobility & city transport
- 9.3 First/last-mile transit connectivity
- 9.4 Campus & closed-environment transport
- 9.5 Rural & underserved area mobility
- 9.6 Paratransit & accessibility services
Chapter 10 Market Estimates & Forecast, By Region, 2021 - 2034 ($ Bn, Fleet Size)
- 10.1 Key trends
- 10.2 North America
- 10.2.1 US
- 10.2.2 Canada
- 10.3 Europe
- 10.3.1 UK
- 10.3.2 Germany
- 10.3.3 France
- 10.3.4 Italy
- 10.3.5 Spain
- 10.3.6 Belgium
- 10.3.7 Netherlands
- 10.3.8 Sweden
- 10.4 Asia Pacific
- 10.4.1 China
- 10.4.2 India
- 10.4.3 Japan
- 10.4.4 Australia
- 10.4.5 Singapore
- 10.4.6 South Korea
- 10.4.7 Vietnam
- 10.4.8 Indonesia
- 10.5 Latin America
- 10.5.1 Brazil
- 10.5.2 Mexico
- 10.5.3 Argentina
- 10.6 MEA
- 10.6.1 UAE
- 10.6.2 South Africa
- 10.6.3 Saudi Arabia
Chapter 11 Company Profiles
- 11.1 Global Player
- 11.1.1 Cruise LLC
- 11.1.2 Geely/Zeekr
- 11.1.3 General Motors
- 11.1.4 Hyundai Motor Group
- 11.1.5 Jaguar Land Rover
- 11.1.6 Motional
- 11.1.7 Toyota Motor Corporation
- 11.1.8 Volkswagen Group
- 11.1.9 Waymo LLC
- 11.1.10 Zoox Inc.
- 11.2 Regional Player
- 11.2.1 Alphabet Inc.
- 11.2.2 Amazon
- 11.2.3 Aptiv PLC
- 11.2.4 Continental AG
- 11.2.5 EasyMile
- 11.2.6 Intel/Mobileye
- 11.2.7 May Mobility
- 11.2.8 New Flyer
- 11.2.9 NVIDIA Corporation
- 11.2.10 Qualcomm
- 11.3 Emerging Players
- 11.3.1 Aurora Innovation
- 11.3.2 Beep Inc.
- 11.3.3 Innoviz Technologies
- 11.3.4 Luminar Technologies
- 11.3.5 Perrone Robotics
 2026年全球共享旅游市场报告
 2026-2034年全球共乘市场规模、份额、趋势和成长分析报告
 共乘:市场占有率分析、产业趋势与统计、成长预测(2026-2031)
 社区共享共乘市场预测至2032年:按服务类型、车辆类型、平台类型、支付方式、最终用户和地区分類的全球分析
 共乘:全球市场份额和排名、总收入和需求预测(2025-2031 年)
 2025 年至 2033 年按服务类型、预订模式、会员类型、通勤类型和地区分類的共乘市场报告2025年共享旅游保险全球市场报告
 全球共乘保险市场
 共乘市场规模、份额及成长分析(按服务类型、资讯服务、车辆类型、距离、类型和地区)-2025 年至 2032 年产业预测
 2025-2029 年全球共乘市场