


 |
市场调查报告书
商品编码
1907346
共乘:市场占有率分析、产业趋势与统计、成长预测(2026-2031)Ridesharing - Market Share Analysis, Industry Trends & Statistics, Growth Forecasts (2026 - 2031) |
||||||
※ 本网页内容可能与最新版本有所差异。详细情况请与我们联繫。
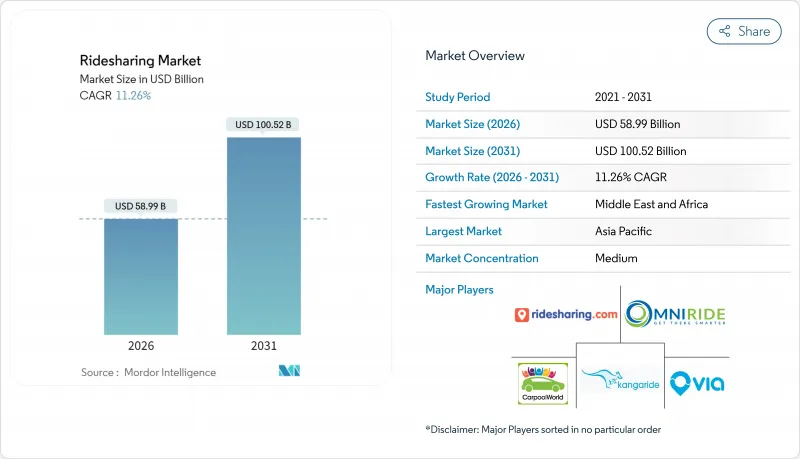
预计到 2025 年,共乘市场规模将达到 530.2 亿美元,到 2026 年将达到 589.9 亿美元,到 2031 年将达到 1005.2 亿美元,2026 年至 2031 年的复合年增长率为 11.26%。
智慧型手机普及率的提高、5G的广泛应用、企业永续性倡议以及拥塞收费等扶持政策正在推动市场需求。平台主导的车辆电动化正在降低每英里的成本,而超级应用则透过捆绑Scooter、自行车和公车票等服务来提高用户留存率。竞争格局分散但日益整合,这有利于那些能够获得自动驾驶汽车伙伴关係和企业合约的营运商。随着平台跨国扩张,关于员工分类和资料本地化的监管清晰度仍将是决定未来成长的关键因素。
全球共乘市场趋势与洞察
整合微出行功能的超级应用的兴起
平台透过扩展服务组合,在同一介面提供Scooter和自行车,从而创造网路效应,降低获客成本并提升客户终身价值。 Lyft 应用用户目前可以租用Scooter和城市自行车,预计到 2024 年,其 35,000 辆自行车将完成 4,500 万次骑行。像旧金山这样的城市正在透过实施统一许可证来简化合规流程,允许单一营运商运作多种交通方式。这项变更提高了使用率,尤其是在两英里以内的短途出行中,汽车的效率较低。由于用户使用相同应用,高利润的汽车出行交叉销售也随之增加。此外,该策略还能使营运商免受各自领域监管衝击的影响。
不断扩大的企业永续发展需求
各公司正将共乘纳入其范围 3排放计划,并透过以共乘取代计程车和租赁车辆来降低每位员工的碳足迹。美国主要银行和科技公司已采取相关政策,仅报销机场接送的共乘,导致工作日需求出现可预见的激增。专用的企业仪錶板提供碳排放追踪、自动计费和政策管理功能,为企业共乘在预测期内实现两位数成长创造了有利条件。稳定的企业需求缓解了季节性波动,从而提高了司机的收入,并提升了平台的企业估值倍数。
限制驾驶员数量并提高额外费用价格上限
美国各城市的最低工资法规迫使叫车平台减少驾驶人数或提高车费。明尼亚波利斯市规定,到2024年,司机每小时最低工资必须达到15美元,导致各大叫车平台暂时停止服务,以便重新调整定价模式。尖峰时段的额外费用倍数限制降低了供给弹性,导致等待时间延长,使用者满意度下降。
细分市场分析
随着越来越多的公司製定优先考虑低碳共乘出行的商务旅游政策,企业客户正在重塑全球共享旅游市场。企业客户在全球共享旅游市场的市占率稳定成长,预计到2031年将以17.85%的复合年增长率成长。企业客户的预订往往集中在工作日的高峰时段,因此每英里的盈利高于消费者在非高峰时段的使用。动态共乘仍将维持销售领先地位,预计到2025年将占总收入的45.62%,但其成长速度落后于高端企业客户,不过动态共享出行利用了密集的都市区网络,实现了高效的乘客匹配。
大型企业重视温室气体减排的端到端报告和自动化费用报销介面,这些功能在消费性产品中很少提供。企业合约通常为多年期,降低了客户流失风险,平台也能更准确地预测司机工时和车队电气化需求。竞争优势正转向整合安全功能,例如运作行程的碳排放仪錶板和与行程负责人的即时行程共用。由于其广泛的潜在基本客群,动态共乘在预测期内的绝对收入将持续增长,而市场份额的转移表明,企业需求正在成为全球共乘市场的稳定因素。
以应用程式为中心的模式将继续占据主导地位,预计到2025年将占总收入的71.84%。行动介面在推播通知、需求高峰期的票价上涨提醒以及便捷的数位钱包等方面仍然无可匹敌,这些都构成了全球叫车市场用户参与的基础。然而,混合型网页和应用程式服务将以15.05%的复合年增长率成长,因为企业差旅部门和无障碍法规要求使用基于浏览器的预订方式。
整合管道将服务范围扩展至非智慧型手机用户,并在网路连线不稳定时提供冗余备份。内建于应用程式中的客户服务人工智慧已将 Lyft 的问题解决时间缩短了 87%,负责人能够专注于处理复杂案例。同时,入口网站支援活动和会议的大量预订,而行动应用程式尚不具备此功能。随着全通路存取成为必需,一个能够跨装置简化程式码库的平台可以降低维护成本、加快功能发布速度,并增强 Lyft 在全球共乘市场的品牌偏好。
区域分析
2025年,亚太地区将占据全球叫车市场37.48%的份额,主要得益于该地区人口密度高、私家车拥有率低以及政府对共用出行的政策支持。滴滴出行2025年第一季营收成长8.5%,凸显了其在中国监管改革后的韧性。在印度,Ola在需求激增的情况下,将2023财年的亏损减少了65%,实现了永续盈利。 5G的高普及率和数位钱包的广泛使用,使得平台能够添加更先进的安全和忠诚度功能,从而增强从大都会圈到区域城市的网路效应。
非洲的成长速度最快,复合年增长率高达16.55%,主要得益于都市区进程和行动支付的普及。 Bolt计划在非洲大陆投资5亿欧元,凸显了该地区对全球营运商的战略重视。内罗毕、拉各斯和约翰尼斯堡是最早受益的城市,其年轻的人口结构推动了行动支付的快速普及。然而,道路基础设施和电力供应的不稳定性给营运带来了挑战,平台透过社区司机援助中心和线下预订终端来应对这些挑战。
北美和欧洲是成熟的市场,在技术创新和企业专案的推动下,正经历稳定成长。 Uber和Waymo的合作在亚特兰大和奥斯丁推出了每週25万次的自动驾驶出行服务,这标誌着在降低驾驶人成本方面迈出了突破性的一步。欧盟平台工作者指令计画于2026年12月生效,该指令将要求福利标准化,并提高小规模应用程式营运商的合规门槛。产业整合正在加速,Lyft收购FREENOW便是例证,此次收购使其业务版图扩展至欧洲九个市场。监管环境的明朗化和较高的可支配收入支撑着这两个地区持续(但缓慢)的用户成长,巩固了叫车在全球叫车市场的核心收入来源地位。
其他福利:
- Excel格式的市场预测(ME)表
- 分析师支持(3个月)
目录
第一章 引言
- 研究假设和市场定义
- 调查范围
第二章调查方法
第三章执行摘要
第四章 市场洞察
- 市场概览
- 产业吸引力-波特五力分析
- 供应商的议价能力
- 消费者议价能力
- 新进入者的威胁
- 替代品的威胁
- 竞争对手之间的竞争
- 产业价值链分析
- 宏观经济趋势如何影响市场
- 技术进步
第五章 市场动态
- 市场驱动因素
- 成本优势与共乘服务/企业共乘服务日益普及
- 政府在主要市场的奖励和退税
- 车辆拥有成本增加和环境效益
- 市场挑战
- 最后一公里连接问题、产业的动态特性以及叫车供应商的崛起,都为现有企业带来了挑战。
- 市场机会
- 汽车共享监管参数
- 商业/收入模式用例
第六章 市场细分
- 依会员类型
- 固定共乘市场
- 动态共乘市场
- 企业共乘市场
- 按服务类型
- 基于网路的
- 基于应用程式
- 基于网页和应用程式
- 按地区
- 北美洲
- 欧洲
- 亚洲
- 澳洲和纽西兰
- 拉丁美洲
- 中东和非洲
第七章 竞争情势
- 公司简介
- OmniRide(Potomac and Rappahannock Transportation Commission)
- Kangaride
- Plante Covoiturage Inc./CarpoolWorld Inc.
- Via Transportation Inc.
- Ridesharing.com(COVOITURAGEMONTREAL Inc.)
- Scoop Commute Inc.(Spacer Technologies)
- BlaBlaCar(Comuto SA)
- KINTO Join Limited(TOYOTA MOTOR CORPORATION)
- GoMore ApS
- Hitch Technologies Inc.
- Liftshare(Mobilityways Limited)
- gobyRIDE(RideShark Corporation)
- Sameride LLC
- Carma Technology Corporation
- Enterprise Holdings Inc.
- 共享出行商业模式中的供应商市场定位
第八章 投资分析
第九章:未来市场展望
The ridesharing market is expected to grow from USD 53.02 billion in 2025 to USD 58.99 billion in 2026 and is forecast to reach USD 100.52 billion by 2031 at 11.26% CAGR over 2026-2031.
Rising smartphone adoption, the spread of 5G, corporate sustainability mandates, and supportive policy measures such as congestion pricing are reinforcing demand. Platform-led electrification of driver fleets is lowering per-mile economics while super-apps bundle scooters, bikes, and transit tickets to lift user retention. Fragmented but consolidating competitive dynamics favour operators that secure autonomous-vehicle partnerships and enterprise contracts. Regulatory clarity on worker classification and data localization will remain a decisive growth moderator as platforms scale across borders.
Global Ridesharing Market Trends and Insights
Rise of Super-Apps Integrating Micromobility
Platforms are widening their service mix to include scooters and bikes within the same interface, creating network effects that cut customer-acquisition costs and lengthen lifetime value. Lyft's app users can now rent scooters and Citi Bikes, completing 45 million rides across 35,000 bikes in 2024. Cities such as San Francisco have rolled out unified permits that let one operator serve multiple modes, simplifying compliance. The shift boosts trip frequency, especially for journeys under two miles, where cars are less efficient. Because users stay inside a single app, cross-selling rates on higher-margin car trips improve. The strategy also buffers operators against regulatory shocks in any one segment.
Growing Corporate Sustainability Mandates
Enterprises are embedding ridesharing into Scope-3 emission plans, replacing taxis and rental cars with pooled trips that cut per-employee carbon footprints. Large U.S. banks and tech firms now reimburse only shared rides for airport transfers, creating predictable weekday demand spikes. Dedicated business dashboards offer carbon tracking, automated billing, and policy controls, positioning corporate ridesharing well for double-digit expansion over the forecast period. Steady enterprise volumes cushion seasonality, improve driver earnings, and raise platform valuation multiples.
Increasing Regulatory Caps on Drivers and Surge Pricing
Minimum-wage ordinances in U.S. cities are pushing platforms to trim driver pools or raise fares. Minneapolis mandated USD 15 per driver hour in 2024, triggering temporary ride suspensions by leading platforms while they recalibrated pricing models. Restrictions on surge multipliers dampen supply elasticity during peak demand, elongating wait times and eroding user satisfaction.
Other drivers and restraints analyzed in the detailed report include:
- Urban Congestion Pricing and Curbside Reform
- High Smartphone and 5G Penetration in Emerging Economies
- Safety-Related Brand Perception Issues
For complete list of drivers and restraints, kindly check the Table Of Contents.
Segment Analysis
Corporate customers are reshaping the global ridesharing market as firms formalize travel policies that prioritize low-carbon, pooled mobility. The corporate segment is on an 17.85% CAGR path to 2031, steadily enlarging its slice of the global ridesharing market size. Enterprise bookings often occur during business-day peaks, yielding higher per-mile yields than consumer off-peak trips. Dynamic ridesharing, still the volume leader with 45.62% of 2025 revenue, benefits from dense urban networks that match riders efficiently, but its growth rate now lags the premium corporate tier.
Large companies value end-to-end reporting of greenhouse-gas savings and automatic expensing interfaces, capabilities that consumer-focused products rarely offer. As corporate contracts typically run multi-year, churn risk is lower, allowing platforms to forecast driver hours and fleet electrification needs with greater accuracy. Competitive differentiation pivots on integrating ride-level carbon dashboards and duty-of-care features like real-time itinerary sharing with travel managers. Over the forecast period, dynamic ridesharing will keep enlarging absolute revenue given its broad addressable base, yet the share shift underscores how enterprise demand is becoming a stabilizing anchor for the global ridesharing market.
App-centric models continue to dominate, capturing 71.84% of 2025 turnover. The mobile interface remains unrivalled for push notifications, surge alerts, and digital-wallet convenience, anchoring user engagement in the global ridesharing market. Nonetheless, hybrid web-plus-app services are expanding fastest at 15.05% CAGR because corporate travel desks and accessibility regulations require browser-based booking.
Integrated channels broaden reach to non-smartphone users and offer redundancy when cellular data is spotty. Customer-service AI embedded in apps cut resolution times by 87% for Lyft, freeing agents for complex cases. Web portals, meanwhile, allow batch booking for events and conferences, a capability mobile apps lack. As omnichannel access becomes table stakes, platforms that streamline code bases across devices will curb maintenance costs and speed feature deployment, reinforcing brand preference in the global ridesharing market.
The Global Ridesharing Market Report is Segmented by Membership Type (Fixed, Dynamic, Corporate), Service Type (Web-Based, App-Based, Web and App-Based), Vehicle Type (ICE Vehicle, Hybrid Vehicle, Electric Vehicle, Micro-Mobility), Trip Distance (Intracity, Intercity), Payment Mode (Cash, Card, Digital Wallets), and Geography. The Market Forecasts are Provided in Terms of Value (USD).
Geography Analysis
Asia-Pacific's 37.48% share anchored the global ridesharing market in 2025, supported by population density, low car ownership, and policymaker support for shared mobility. DiDi's Q1 2025 rebound, with revenue up 8.5%, affirmed post-regulation resilience in China. India followed with Ola trimming FY23 losses by 65%, achieving sustainable profitability amid surging demand. High 5G penetration and digital-wallet ubiquity enable platforms to overlay advanced safety and loyalty features, strengthening network effects across megacities and Tier-2 towns.
Africa posted the fastest trajectory, projected at 16.55% CAGR, propelled by urban migration and mobile-money ubiquity. Bolt's commitment to invest EUR 500 million across the continent underscores the region's strategic priority for global operators. Nairobi, Lagos, and Johannesburg are early beneficiaries, with young demographics fostering rapid uptake. Nonetheless, inconsistent road infrastructure and electricity reliability pose operational challenges that platforms address through localized driver-support hubs and offline booking kiosks.
North America and Europe display mature yet incremental growth driven by technological upgrades and corporate programs. Uber's tie-up with Waymo began offering 250,000 weekly autonomous rides in Atlanta and Austin, a milestone that trims driver-cost overheads. The EU's Platform Worker Directive, effective December 2026, will standardize benefits, elevating compliance barriers for smaller apps. Consolidation is intensifying, exemplified by Lyft's purchase of FREENOW that enlarged its European reach to nine markets. Regulatory certainty plus high disposable incomes underpins sustained, if moderate, volume expansion in both regions, keeping them pivotal revenue pools within the global ridesharing market.
- OmniRide (Potomac and Rappahannock Transportation Commission)
- Kangaride
- Plante Covoiturage Inc./CarpoolWorld Inc.
- Via Transportation Inc.
- Ridesharing.com (COVOITURAGEMONTREAL Inc.)
- Scoop Commute Inc. (Spacer Technologies)
- BlaBlaCar (Comuto SA)
- KINTO Join Limited (TOYOTA MOTOR CORPORATION)
- GoMore ApS
- Hitch Technologies Inc.
- Liftshare (Mobilityways Limited)
- gobyRIDE (RideShark Corporation)
- Sameride LLC
- Carma Technology Corporation
- Enterprise Holdings Inc.
Additional Benefits:
- The market estimate (ME) sheet in Excel format
- 3 months of analyst support
TABLE OF CONTENTS
1 INTRODUCTION
- 1.1 Study Assumptions and Market Definition
- 1.2 Scope of the Study
2 RESEARCH METHODOLOGY
3 EXECUTIVE SUMMARY
4 MARKET INSIGHTS
- 4.1 Market Overview
- 4.2 Industry Attractiveness - Porter's Five Forces Analysis
- 4.2.1 Bargaining Power of Suppliers
- 4.2.2 Bargaining Power of Consumers
- 4.2.3 Threat of New Entrants
- 4.2.4 Threat of Substitute Products
- 4.2.5 Intensity of Competitive Rivalry
- 4.3 Industry Value Chain Analysis
- 4.4 Impact of Macroeconomic Trends on the Market
- 4.5 Technological Developments
5 MARKET DYNAMICS
- 5.1 Market Drivers
- 5.1.1 Cost Advantage and Increasing Availability of Carpooling/Corporate Pooling Services
- 5.1.2 Incentives and Rebates Provided by Governments in Major Markets
- 5.1.3 Increasing Cost of Vehicle Ownership and Environmental Benefits
- 5.2 Market Challenges
- 5.2.1 Last-mile Connectivity Concerns and Dynamic Nature of the Industry and Increasing Number of Ride Hailing Vendors Poses a Challenge for Existing Operators
- 5.3 Market Opportunties
- 5.4 Parameters for Car-sharing Regulation
- 5.5 Business/Revenue Model Use Cases
6 MARKET SEGMENTATION
- 6.1 By Membership Type
- 6.1.1 Fixed Ridesharing
- 6.1.2 Dynamic Ridesharing
- 6.1.3 Corporate Ridesharing
- 6.2 By Service Type
- 6.2.1 Web-Based
- 6.2.2 App-Based
- 6.2.3 Web and App Based
- 6.3 By Geography
- 6.3.1 North America
- 6.3.2 Europe
- 6.3.3 Asia
- 6.3.4 Australia and New Zealand
- 6.3.5 Latin America
- 6.3.6 Middle East and Africa
7 COMPETITIVE LANDSCAPE
- 7.1 Company Profiles
- 7.1.1 OmniRide (Potomac and Rappahannock Transportation Commission)
- 7.1.2 Kangaride
- 7.1.3 Plante Covoiturage Inc./CarpoolWorld Inc.
- 7.1.4 Via Transportation Inc.
- 7.1.5 Ridesharing.com (COVOITURAGEMONTREAL Inc.)
- 7.1.6 Scoop Commute Inc. (Spacer Technologies)
- 7.1.7 BlaBlaCar (Comuto SA)
- 7.1.8 KINTO Join Limited (TOYOTA MOTOR CORPORATION)
- 7.1.9 GoMore ApS
- 7.1.10 Hitch Technologies Inc.
- 7.1.11 Liftshare (Mobilityways Limited)
- 7.1.12 gobyRIDE (RideShark Corporation)
- 7.1.13 Sameride LLC
- 7.1.14 Carma Technology Corporation
- 7.1.15 Enterprise Holdings Inc.
- 7.2 Market Positioning of Vendors in Ridesharing Business Models
8 INVESTMENT ANALYSIS
9 FUTURE OF THE MARKET
 2026年全球共享旅游市场报告
 2026-2034年全球共乘市场规模、份额、趋势和成长分析报告
 社区共享共乘市场预测至2032年:按服务类型、车辆类型、平台类型、支付方式、最终用户和地区分類的全球分析
 自动驾驶共享出行服务市场机会、成长驱动因素、产业趋势分析及预测(2025-2034年)
 共乘:全球市场份额和排名、总收入和需求预测(2025-2031 年)
 2025 年至 2033 年按服务类型、预订模式、会员类型、通勤类型和地区分類的共乘市场报告2025年共享旅游保险全球市场报告
 全球共乘保险市场
 共乘市场规模、份额及成长分析(按服务类型、资讯服务、车辆类型、距离、类型和地区)-2025 年至 2032 年产业预测
 2025-2029 年全球共乘市场