


 |
市场调查报告书
商品编码
1892744
营养保健品原料市场机会、成长驱动因素、产业趋势分析及预测(2026-2035年)Nutraceutical Ingredients Market Opportunity, Growth Drivers, Industry Trend Analysis, and Forecast 2026 - 2035 |
||||||
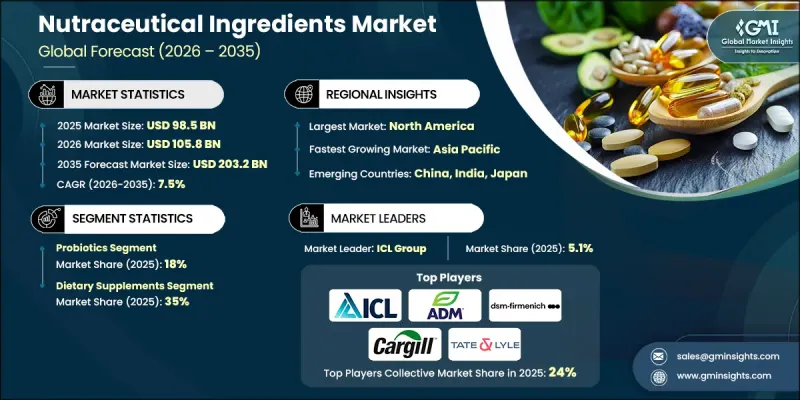
2025年全球营养保健品原料市场价值为985亿美元,预计2035年将以7.5%的复合年增长率成长至2032亿美元。
短期成长主要得益于功能性食品和即饮产品的日益普及,而中期扩张则由个人化营养和易于消费者理解的、经临床验证的健康声明所驱动。即使整体食品产业成长放缓,营养保健品原料市场仍展现出韧性,因为其成长已扩展到多个通路和应用领域。消费者越来越重视饮食与慢性病预防之间的联繫,这持续推动对支持消化系统健康、免疫功能、心血管健康和整体活力的原料的需求。消费者对植物基、有机和符合道德标准的原料日益增长的兴趣,也进一步促使製造商创新配方,以吸引那些具有健康和环保意识的消费者。
| 市场范围 | |
|---|---|
| 起始年份 | 2025 |
| 预测年份 | 2026-2035 |
| 起始值 | 985亿美元 |
| 预测值 | 2032亿美元 |
| 复合年增长率 | 7.5% |
2025年,益生菌市场占有率预计将达到18%,这主要得益于消化健康解决方案日益普及。消费者越来越意识到肠道健康、免疫支持和整体健康的重要性,这促使益生菌被整合到功能性食品、饮料和非处方保健品中。对科学验证的菌株和针对性配方的重视增强了消费者的信心,从而提高了益生菌的普及率。
预计到2025年,膳食补充剂市占率将达到35%,凸显了消费者对精准剂量、多成分组合和明确功效声明的需求。消费者越来越倾向于选择能够实际改善免疫力、精力、认知功能和整体健康的补充剂。以便捷的剂型提供标准化的生物活性化合物,包括维生素、矿物质、胺基酸和植物萃取物,能够显着提升产品的吸引力。
北美营养保健品原料市场预计到2025年将占据38%的市场份额,这主要得益于成熟的膳食补充剂文化、强大的零售和电商基础设施,以及《膳食补充剂健康与教育法案》(DSHEA)带来的清晰监管环境。美国受益于高端品牌定位、临床行销和专业人士的推荐,而加拿大则面临着对植物性成分、益生菌和由内而外美容解决方案日益增长的需求。
目录
第一章:方法论与范围
第二章:执行概要
第三章:行业洞察
- 产业生态系分析
- 供应商格局
- 利润率
- 每个阶段的价值增加
- 影响价值链的因素
- 中断
- 产业影响因素
- 成长驱动因素
- 产业陷阱与挑战
- 市场机会
- 成长潜力分析
- 监管环境
- 北美洲
- 欧洲
- 亚太地区
- 拉丁美洲
- 中东和非洲
- 波特的分析
- PESTEL 分析
- 价格趋势
- 按地区
- 未来市场趋势
- 技术与创新格局
- 当前技术趋势
- 新兴技术
- 专利格局
- 贸易统计(HS编码)(註:仅提供重点国家的贸易统计资料)
- 主要进口国
- 主要出口国
- 永续性和环境方面
- 永续实践
- 减少废弃物策略
- 生产中的能源效率
- 环保倡议
- 碳足迹考量
第四章:竞争格局
- 介绍
- 公司市占率分析
- 按地区
- 北美洲
- 欧洲
- 亚太地区
- 拉丁美洲
- 中东和非洲
- 按地区
- 公司矩阵分析
- 主要市场参与者的竞争分析
- 竞争定位矩阵
- 关键进展
- 併购
- 合作伙伴关係与合作
- 新产品发布
- 扩张计划
第五章:市场规模及预测:依产品划分,2022-2035年
- 益生菌
- 乳酸桿菌
- 双歧桿菌
- 芽孢桿菌
- 链球菌
- 酿酒酵母
- 其他的
- 益生元
- 低聚果糖 (FOS)
- 菊粉
- GOS(低聚半乳糖)
- 甘露寡糖 (MOS)
- 其他的
- 维生素
- 维生素A
- 维生素C
- 维生素D
- 维生素E
- 维生素K
- 维生素B群(B1、B2、B6、B12、生物素、叶酸、烟碱酸)
- 胺基酸
- 赖氨酸
- 蛋胺酸
- 苏胺酸
- 色氨酸
- 类胡萝卜素
- β-胡萝卜素
- 叶黄素
- 虾红素
- 角黄素
- 番茄红素
- 其他的
- 植物化学物质和植物萃取物
- 植物固醇
- 黄酮类化合物
- 多酚
- 其他的
- 蛋白质
- 植物蛋白
- 小麦蛋白
- 大豆蛋白浓缩物(SPC)
- 大豆分离蛋白(SPI)
- 组织化大豆蛋白
- 豌豆蛋白
- 菜籽蛋白
- 其他的
- 动物性蛋白质
- 鸡蛋蛋白
- 乳蛋白浓缩物/分离物
- 乳清蛋白浓缩物(WPC 80、WPC 35)
- 乳清蛋白水解物(WPH)
- 乳清蛋白分离物(WPI)
- 明胶
- 酪蛋白/酪酸盐
- 植物蛋白
- EPA/DHA(ω-3脂肪酸)
- 凤尾鱼/沙丁鱼
- 藻油
- 鲔鱼油
- 鳕鱼肝油
- 鲑鱼油
- 磷虾油
- 鲱鱼油
- 矿物
- 纤维和碳水化合物
- 谷物
- 水果和蔬菜
- 其他的
第六章:市场规模及预测:依应用领域划分,2022-2035年
- 功能性食品
- 强化乳製品
- 强化果汁
- 功能性烘焙
- 强化谷物
- 功能饮料
- 运动饮料
- 能量饮料
- 强化水
- 美容饮品
- 膳食补充剂
- 胶囊
- 片剂
- 粉末
- 软糖
- 软胶囊
- 液体
- 个人护理及药妆品
- 营养美容品(口服美容补充)
- 外用製剂
- 动物营养
- 伴侣动物
- 家畜
- 水产养殖
- 临床营养
- 医用食品
- 治疗性营养
- 婴儿配方奶粉
- 老年营养
- 其他的
第七章:市场规模及预测:依产品类型划分,2022-2035年
- 干粉
- 粉末
- 胶囊
- 片剂
- 软糖和咀嚼片
- 珠粒和微珠
- 晶体
- 液态
- 溶液和糖浆
- 软胶囊
- 乳液和悬浮液
- 脂质体配方
- 半固体形式
- 锭剂
- 口服袋
第八章:市场规模及预测:依最终用途产业划分,2022-2035年
- 製药业
- 临床营养
- 医用食品
- 治疗性补充剂
- 食品饮料业
- 功能性食品製造商
- 饮料强化
- 运动健身产业
- 化妆品及个人护理行业
- 动物饲料业
- 其他的
第九章:市场规模及预测:依地区划分,2022-2035年
- 北美洲
- 我们
- 加拿大
- 欧洲
- 英国
- 德国
- 法国
- 义大利
- 西班牙
- 欧洲其他地区
- 亚太地区
- 中国
- 印度
- 日本
- 韩国
- 澳洲
- 亚太其他地区
- 拉丁美洲
- 巴西
- 墨西哥
- 阿根廷
- 拉丁美洲其他地区
- 中东和非洲
- 南非
- 沙乌地阿拉伯
- 阿联酋
- 中东和非洲其他地区
第十章:公司简介
- BASF SE
- ADM
- Ingredion
- DSM NV
- Cargill Incorporated
- Tate & Lyle
- Ajinomoto
- Prinova Group
- Roquette Freres
- Arla Food Ingredients
- Dupont Nutrition & Biosciences
- Divis Laboratories
- Barentz
- BI Nutraceuticals
- Cosucra Groupe Warcoing
- Ambe Phytoextracts
- Nutraland USA
- Nutra Food Ingredients
- Aurobindo Pharma
- Associated British Foods Plc
- Aurea Biolabs
- Innophos
- AVT Natural Products
The Global Nutraceutical Ingredients Market was valued at USD 98.5 billion in 2025 and is estimated to grow at a CAGR of 7.5% to reach USD 203.2 billion by 2035.
The near-term growth is fueled by the rising adoption of functional foods and ready-to-drink formats, while medium-term expansion is driven by personalized nutrition and clinically substantiated health claims that are easy for consumers to understand. The nutraceutical ingredients market demonstrates resilience even when broader food sectors slow down, as its growth is diversified across multiple channels and applications. Consumers increasingly link diet to chronic disease prevention, which continues to propel demand for ingredients supporting digestive health, immune function, cardiovascular wellness, and overall vitality. Rising interest in plant-based, organic, and ethically sourced ingredients is further encouraging manufacturers to innovate formulations that appeal to health-conscious and environmentally aware buyers.
| Market Scope | |
|---|---|
| Start Year | 2025 |
| Forecast Year | 2026-2035 |
| Start Value | $98.5 Billion |
| Forecast Value | $203.2 Billion |
| CAGR | 7.5% |
The probiotics segment accounted for an 18% share in 2025, fueled by the growing mainstream adoption of digestive wellness solutions. Consumers are increasingly recognizing the importance of gut health, immunity support, and overall well-being, which has led to the integration of probiotics across functional foods, beverages, and over-the-counter supplements. The emphasis on scientifically validated strains and targeted formulations has strengthened consumer confidence, driving higher adoption rates.
The dietary supplements segment held a 35% share in 2025, underscoring the demand for precise dosing, multi-ingredient combinations, and clear efficacy claims. Consumers increasingly seek supplements that offer measurable benefits for immunity, energy, cognitive function, and overall wellness. The ability to deliver standardized bioactive compounds, including vitamins, minerals, amino acids, and plant extracts, in convenient dosage forms enhances product appeal.
North America Nutraceutical ingredients Market held 38% share in 2025, led by a mature supplement culture, strong retail and e-commerce infrastructure, and regulatory clarity under DSHEA. The U.S. benefits from premium brand positioning, clinical marketing, and professional recommendations, while Canada sees increasing demand for plant-based ingredients, probiotics, and beauty-from-within solutions.
Key players in the Global Nutraceutical Ingredients Market include Tate & Lyle, DSM NV, BASF SE, DuPont Nutrition & Biosciences, Cargill Incorporated, Arla Food Ingredients, Divis Laboratories, Ajinomoto, Ingredion, Prinova Group, Roquette Freres, Barentz, and BI Nutraceuticals. Companies in the Global Nutraceutical ingredients Market are focusing on strategies such as investing in research and development to create clinically substantiated and innovative ingredients. They are expanding product portfolios to cater to functional foods, beverages, and dietary supplements. Strategic partnerships and collaborations with food manufacturers, distributors, and healthcare professionals help enhance market penetration. Firms are emphasizing clean-label, plant-based, and sustainable formulations to appeal to evolving consumer preferences. Mergers and acquisitions are pursued to strengthen geographic presence and diversify product offerings.
Table of Contents
Chapter 1 Methodology & Scope
- 1.1 Market scope and definition
- 1.2 Research design
- 1.2.1 Research approach
- 1.2.2 Data collection methods
- 1.3 Data mining sources
- 1.3.1 Global
- 1.3.2 Regional/Country
- 1.4 Base estimates and calculations
- 1.4.1 Base year calculation
- 1.4.2 Key trends for market estimation
- 1.5 Primary research and validation
- 1.5.1 Primary sources
- 1.6 Forecast model
- 1.7 Research assumptions and limitations
Chapter 2 Executive Summary
- 2.1 Industry 3600 synopsis
- 2.2 Key market trends
- 2.2.1 Product
- 2.2.2 Application
- 2.2.3 Form
- 2.2.4 End use industry
- 2.3 TAM analysis, 2025-2034
- 2.4 CXO perspectives: Strategic imperatives
- 2.4.1 Executive decision points
- 2.4.2 Critical success factors
- 2.5 Outlook and strategic recommendations
Chapter 3 Industry Insights
- 3.1 Industry ecosystem analysis
- 3.1.1 Supplier landscape
- 3.1.2 Profit margin
- 3.1.3 Value addition at each stage
- 3.1.4 Factor affecting the value chain
- 3.1.5 Disruptions
- 3.2 Industry impact forces
- 3.2.1 Growth drivers
- 3.2.2 Industry pitfalls and challenges
- 3.2.3 Market opportunities
- 3.3 Growth potential analysis
- 3.4 Regulatory landscape
- 3.4.1 North America
- 3.4.2 Europe
- 3.4.3 Asia Pacific
- 3.4.4 Latin America
- 3.4.5 Middle East & Africa
- 3.5 Porter's analysis
- 3.6 PESTEL analysis
- 3.7 Price trends
- 3.7.1 By region
- 3.8 Future market trends
- 3.9 Technology and innovation landscape
- 3.9.1 Current technological trends
- 3.9.2 Emerging technologies
- 3.10 Patent landscape
- 3.11 Trade statistics (HS code) (Note: the trade statistics will be provided for key countries only)
- 3.11.1 Major importing countries
- 3.11.2 Major exporting countries
- 3.12 Sustainability and environmental aspects
- 3.12.1 Sustainable practices
- 3.12.2 Waste reduction strategies
- 3.12.3 Energy efficiency in production
- 3.12.4 Eco-friendly initiatives
- 3.13 Carbon footprint considerations
Chapter 4 Competitive Landscape, 2025
- 4.1 Introduction
- 4.2 Company market share analysis
- 4.2.1 By region
- 4.2.1.1 North America
- 4.2.1.2 Europe
- 4.2.1.3 Asia Pacific
- 4.2.1.4 Latin America
- 4.2.1.5 Middle East & Africa
- 4.2.1 By region
- 4.3 Company matrix analysis
- 4.4 Competitive analysis of major market players
- 4.5 Competitive positioning matrix
- 4.6 Key developments
- 4.6.1 Mergers & acquisitions
- 4.6.2 Partnerships & collaborations
- 4.6.3 New product launches
- 4.6.4 Expansion plans
Chapter 5 Market Size and Forecast, By Product, 2022-2035 (USD Billion, Kilo Tons)
- 5.1 Key trends
- 5.2 Probiotics
- 5.2.1 Lactobacilli
- 5.2.2 Bifidobacterium
- 5.2.3 Bacillus
- 5.2.4 Streptococcus
- 5.2.5 Saccharomyces (yeast)
- 5.2.6 Others
- 5.3 Prebiotics
- 5.3.1 FOS (fructooligosaccharides)
- 5.3.2 Inulin
- 5.3.3 GOS (galactooligosaccharides)
- 5.3.4 MOS (mannanoligosaccharides)
- 5.3.5 Others
- 5.4 Vitamins
- 5.4.1.1 Vitamin A
- 5.4.1.2 Vitamin C
- 5.4.1.3 Vitamin D
- 5.4.1.4 Vitamin E
- 5.4.1.5 Vitamin K
- 5.4.1.6 Vitamin B-complex (B1, B2, B6, B12, Biotin, Folic Acid, Niacin)
- 5.5 Amino acids
- 5.5.1.1 Lysine
- 5.5.1.2 Methionine
- 5.5.1.3 Threonine
- 5.5.1.4 Tryptophan
- 5.6 Carotenoids
- 5.6.1.1 Beta-carotene
- 5.6.1.2 Lutein
- 5.6.1.3 Astaxanthin
- 5.6.1.4 Canthaxanthin
- 5.6.1.5 Lycopene
- 5.6.1.6 Others
- 5.7 Phytochemicals & plant extracts
- 5.7.1.1 Phytosterols
- 5.7.1.2 Flavonoids
- 5.7.1.3 Polyphenols
- 5.7.1.4 Others
- 5.8 Protein
- 5.8.1 Plant proteins
- 5.8.1.1 Wheat protein
- 5.8.1.2 Soy protein concentrates (SPC)
- 5.8.1.3 Soy protein isolates (SPI)
- 5.8.1.4 Textured soy protein
- 5.8.1.5 Pea protein
- 5.8.1.6 Canola protein
- 5.8.1.7 Others
- 5.8.2 Animal proteins
- 5.8.2.1 Egg protein
- 5.8.2.2 Milk protein concentrates/isolates
- 5.8.2.3 Whey protein concentrates (WPC 80, WPC 35)
- 5.8.2.4 Whey protein hydrolysates (WPH)
- 5.8.2.5 Whey protein isolates (WPI)
- 5.8.2.6 Gelatin
- 5.8.2.7 Casein/caseinates
- 5.8.1 Plant proteins
- 5.9 EPA/DHA (omega-3 fatty acids)
- 5.9.1 Anchovy/sardine
- 5.9.2 Algae oil
- 5.9.3 Tuna oil
- 5.9.4 Cod liver oil
- 5.9.5 Salmon oil
- 5.9.6 Krill oil
- 5.9.7 Menhaden oil
- 5.10 Minerals
- 5.11 Fiber & carbohydrates
- 5.11.1 Cereals & grains
- 5.11.2 Fruits & vegetables
- 5.12 Others
Chapter 6 Market Size and Forecast, By Application, 2022-2035 (USD Billion, Kilo Tons)
- 6.1 Key trends
- 6.2 Functional food
- 6.2.1 Fortified dairy products
- 6.2.2 Fortified juices
- 6.2.3 Functional bakery
- 6.2.4 Fortified cereals
- 6.3 Functional beverages
- 6.3.1 Sports drinks
- 6.3.2 Energy drinks
- 6.3.3 Fortified water
- 6.3.4 Beauty drinks
- 6.4 Dietary supplements
- 6.4.1 Capsules
- 6.4.2 Tablets
- 6.4.3 Powders
- 6.4.4 Gummies
- 6.4.5 Softgels
- 6.4.6 Liquids
- 6.5 Personal care & cosmeceuticals
- 6.5.1 Nutricosmetics (oral beauty supplements)
- 6.5.2 Topical formulations
- 6.6 Animal nutrition
- 6.6.1 Companion animals
- 6.6.2 Livestock
- 6.6.3 Aquaculture
- 6.7 Clinical nutrition
- 6.7.1 Medical foods
- 6.7.2 Therapeutic nutrition
- 6.7.3 Infant formula
- 6.7.4 Geriatric nutrition
- 6.8 Others
Chapter 7 Market Size and Forecast, By Form, 2022-2035 (USD Billion, Kilo Tons)
- 7.1 Key trends
- 7.2 Dry form
- 7.2.1 Powders
- 7.2.2 Capsules
- 7.2.3 Tablets
- 7.2.4 Gummies & chewables
- 7.2.5 Beadlets & microbeads
- 7.2.6 Crystals
- 7.3 Liquid form
- 7.3.1 Solutions & syrups
- 7.3.2 Softgels
- 7.3.3 Emulsions & suspensions
- 7.3.4 Liposomal formulations
- 7.4 Semi-solid form
- 7.4.1 Lozenges
- 7.4.2 Oral pouches
Chapter 8 Market Size and Forecast, By End Use Industry, 2022-2035 (USD Billion, Kilo Tons)
- 8.1 Key trends
- 8.2 Pharmaceutical industry
- 8.2.1 Clinical nutrition
- 8.2.2 Medical foods
- 8.2.3 Therapeutic supplements
- 8.3 Food & beverage industry
- 8.3.1 Functional food manufacturers
- 8.3.2 Beverage fortification
- 8.4 Sports & fitness industry
- 8.5 Cosmetics & personal care industry
- 8.6 Animal feed industry
- 8.7 Others
Chapter 9 Market Size and Forecast, By Region, 2022-2035 (USD Billion, Kilo Tons)
- 9.1 Key trends
- 9.2 North America
- 9.2.1 U.S.
- 9.2.2 Canada
- 9.3 Europe
- 9.3.1 UK
- 9.3.2 Germany
- 9.3.3 France
- 9.3.4 Italy
- 9.3.5 Spain
- 9.3.6 Rest of Europe
- 9.4 Asia Pacific
- 9.4.1 China
- 9.4.2 India
- 9.4.3 Japan
- 9.4.4 South Korea
- 9.4.5 Australia
- 9.4.6 Rest of Asia Pacific
- 9.5 Latin America
- 9.5.1 Brazil
- 9.5.2 Mexico
- 9.5.3 Argentina
- 9.5.4 Rest of Latin America
- 9.6 Middle East & Africa
- 9.6.1 South Africa
- 9.6.2 Saudi Arabia
- 9.6.3 UAE
- 9.6.4 Rest of Middle East & Africa
Chapter 10 Company Profiles
- 10.1 BASF SE
- 10.2 ADM
- 10.3 Ingredion
- 10.4 DSM NV
- 10.5 Cargill Incorporated
- 10.6 Tate & Lyle
- 10.7 Ajinomoto
- 10.8 Prinova Group
- 10.9 Roquette Freres
- 10.10 Arla Food Ingredients
- 10.11 Dupont Nutrition & Biosciences
- 10.12 Divis Laboratories
- 10.13 Barentz
- 10.14 BI Nutraceuticals
- 10.15 Cosucra Groupe Warcoing
- 10.16 Ambe Phytoextracts
- 10.17 Nutraland USA
- 10.18 Nutra Food Ingredients
- 10.19 Aurobindo Pharma
- 10.20 Associated British Foods Plc
- 10.21 Aurea Biolabs
- 10.22 Innophos
- 10.23 AVT Natural Products


