


 |
市场调查报告书
商品编码
1892803
电动车(EV)计程车市场机会、成长驱动因素、产业趋势分析及预测(2026-2035年)Electric Vehicle (EV) Taxi Market Opportunity, Growth Drivers, Industry Trend Analysis, and Forecast 2026 - 2035 |
||||||
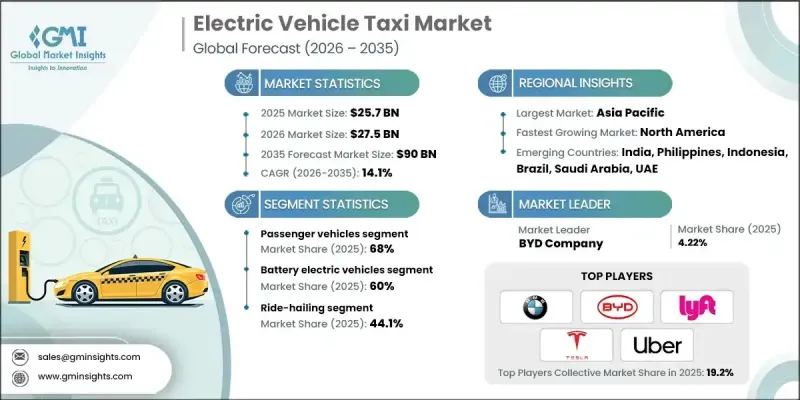
2025 年全球电动车计程车市场价值 257 亿美元,预计到 2035 年将以 14.1% 的复合年增长率成长至 900 亿美元。
全球向永续交通、智慧车队管理和电气化城市出行系统的转型推动了电动计程车产业的成长。现代电动计程车平台融合了高容量电池、人工智慧驱动的车队优化、即时车辆监控和智慧充电网络,从而提高效率、降低营运成本、减少排放并提升乘客安全。各国政府和旅游服务提供者正日益转向电动计程车,以满足监管要求、减少对燃料的依赖并提升城市交通的可持续性。这些创新也有助于营运商预测维护需求、规避油价波动并优化路线规划。产业整合、策略联盟和技术合作正在重塑电动计程车格局,製造商、电池供应商和软体供应商携手合作,共同开发长续航里程车辆、超快速充电解决方案和整合数位平台,以确保无缝营运和节能路线规划。
| 市场范围 | |
|---|---|
| 起始年份 | 2025 |
| 预测年份 | 2026-2035 |
| 起始值 | 257亿美元 |
| 预测值 | 900亿美元 |
| 复合年增长率 | 14.1% |
预计到2025年,乘用车市占率将达到68%,并有望在2035年之前以13.6%的复合年增长率成长。紧凑型和中型车因其价格实惠、能源效率高且适合日常城市路线,在电动计程车行业中占据主导地位。它们与电动车动力系统的兼容性使车队营运商能够利用补贴、降低燃料成本和减少排放,同时简化维护工作。
预计到2025年,纯电动车市占率将达到60%,到2035年将以14.4%的复合年增长率成长。由于零排放、营运成本低、续航里程长、充电速度快以及安全性能优异,纯电动车成为计程车营运的首选。政府激励措施以及不断扩展的公共和私人充电网路进一步推动了纯电动车的普及,确保了计程车营运的持续性并提高了车队效率。
中国电动计程车市场占37%的市场份额,预计2024年市场规模将达到40.2亿美元。车队快速电气化、政府强有力的激励措施以及积极的减排政策正在加速电动计程车的普及,尤其是在主要城市中心。补贴、降低牌照费用以及优惠充电计划鼓励计程车业者从传统燃油车转型为电动车。
目录
第一章:方法论
第二章:执行概要
第三章:行业洞察
- 产业生态系分析
- 供应商格局
- 利润率分析
- 成本结构
- 每个阶段的价值增加
- 影响价值链的因素
- 中断
- 产业影响因素
- 成长驱动因素
- 政府激励措施和更严格的排放标准
- 汽油动力车辆的燃料价格不断上涨
- 电池技术的进步
- 人们越来越意识到气候变迁以及对永续交通解决方案的需求。
- 快速城市化和智慧城市计划
- 产业陷阱与挑战
- 电动车初始成本高
- 充电基础设施有限
- 市场机会
- 扩大充电基础设施
- 与智慧城市计画的融合
- 企业车队电气化计划
- 电池和电动车零件的技术进步
- 成长驱动因素
- 成长潜力分析
- 监管环境
- 北美洲
- 美国联邦政府的激励措施(税收抵免、拨款)以及基础设施资金(NEVI/IIJA)支持车队电气化和车辆段充电。
- 欧洲
- 德国:《电动车法案》(EmoG)
- 英国:插电式计程车补贴计画 (PiTG)
- 法国:《出行指导法》(LOM法案)
- 义大利:国家能源与气候综合计画(PNIEC)
- 亚太地区
- 中国:新能源汽车(NEV)强制令
- 印度:FAME II 计画(电动车激励计画)
- 日本:电动车/燃料电池汽车部署战略路线图
- 澳洲:各州零排放车辆强制令
- 拉丁美洲
- 巴西:国家电动车政策(PNME)
- 墨西哥:城市零排放计程车项目
- 阿根廷:省级电动计程车法规(布宜诺斯艾利斯)
- MEA
- 阿联酋:电动车充电基础设施监管条例(ADDM/DEWA)
- 沙乌地阿拉伯:电动车部署规范架构(SASO)
- 南非:绿色交通战略
- 北美洲
- 波特的分析
- PESTEL 分析
- 技术与创新格局
- 当前技术趋势
- 新兴技术
- 专利分析
- 定价分析
- 按地区
- 透过推进
- 成本細項分析
- 车辆成本
- 营运成本
- 总拥有成本(TCO)
- 充电基础设施成本
- 安装和启动费用
- 研发成本
- 永续性和环境影响分析
- 永续实践
- 减少废弃物策略
- 生产中的能源效率
- 环保倡议
- 碳足迹考量
- 未来展望与机会
- 技术路线图和演进时间表
- 新兴应用机会
- 投资需求及资金来源
- 风险评估与缓解策略
- 针对市场参与者的策略建议
第四章:竞争格局
- 介绍
- 公司市占率分析
- 主要市场参与者的竞争分析
- 竞争定位矩阵
- 战略展望矩阵
- 关键进展
- 併购
- 合作伙伴关係与合作
- 新产品发布
- 扩张计划和资金
第五章:市场估价与预测:依车辆类型划分,2022-2035年
- 搭乘用车
- 掀背车
- 轿车
- SUV
- 商用车辆
- 轻型商用车(LCV)
- 中型商用车(MCV)
- 重型商用车(HCV)
第六章:市场估算与预测:以推进方式划分,2022-2035年
- 电池电动车(BEV)
- 混合动力电动车(HEV)
- 插电式混合动力车(PHEV)
第七章:市场估算与预测:依服务类型划分,2022-2035年
- 叫车
- 计程车服务
- 车队营运服务
- 机器人计程车服务
第八章:市场估算与预测:依所有权模式划分,2022-2035年
- 车队所有
- 个人驾驶员所有
- 订阅
- 合作模式
- 其他的
第九章:市场估算与预测:依区间划分,2022-2035年
- 短续航里程(每次充电后少于150公里)
- 中等续航里程(每次充电可行驶 150-250 公里)
- 长续航里程(每次充电可行驶250公里以上)
第十章:市场估价与预测:依充电基础设施划分,2022-2035年
- 快速充电
- 充电速度慢
- 无线充电
第十一章:市场估计与预测:按地区划分,2022-2035年
- 北美洲
- 我们
- 加拿大
- 欧洲
- 德国
- 英国
- 法国
- 义大利
- 西班牙
- 俄罗斯
- 北欧
- 亚太地区
- 中国
- 印度
- 日本
- 澳洲
- 韩国
- 菲律宾
- 印尼
- 拉丁美洲
- 巴西
- 墨西哥
- 阿根廷
- MEA
- 南非
- 沙乌地阿拉伯
- 阿联酋
第十二章:公司简介
- 全球参与者
- BAIC
- BYD
- Didi Chuxing
- GoGreen Cab Services
- Green Cab
- Lyft
- Nissan Motor
- Tesla
- Uber
- Volkswagen
- Waymo (Alphabet)
- 区域玩家
- Alto
- BluSmart Mobility
- EEE-Taxi Mobility Solutions
- EV Capital
- EVERA Auto
- Grab Holdings
- Ola
- 新兴参与者
- Cruise LLC (General Motors)
- Evera Cabs
- GSM Green and Smart Mobility
- Xanh SM
The Global Electric Vehicle Taxi Market was valued at USD 25.7 billion in 2025 and is estimated to grow at a CAGR of 14.1% to reach USD 90 billion by 2035.
Growth is fueled by the global shift toward sustainable transportation, intelligent fleet management, and electrified urban mobility systems. Modern EV taxi platforms combine high-capacity batteries, AI-driven fleet optimization, real-time vehicle monitoring, and smart charging networks to enhance efficiency, reduce operating costs, minimize emissions, and elevate passenger safety. Governments and mobility service providers are increasingly transitioning to electric taxis to meet regulatory mandates, reduce fuel dependency, and improve city-wide transport sustainability. These innovations also help operators anticipate maintenance needs, avoid fuel price volatility, and optimize route planning. Industry consolidation, strategic alliances, and technology partnerships are reshaping the EV taxi landscape, with manufacturers, battery suppliers, and software providers working together to develop long-range vehicles, ultra-fast charging solutions, and integrated digital platforms that ensure seamless operations and energy-efficient routing.
| Market Scope | |
|---|---|
| Start Year | 2025 |
| Forecast Year | 2026-2035 |
| Start Value | $25.7 Billion |
| Forecast Value | $90 Billion |
| CAGR | 14.1% |
The passenger vehicle segment held a 68% share in 2025 and is expected to grow at a CAGR of 13.6% through 2035. Compact and mid-sized cars dominate the EV taxi industry due to their affordability, efficient energy consumption, and suitability for daily urban routes. Their compatibility with EV powertrains allows fleet operators to leverage subsidies, reduce fuel expenses, and lower emissions while simplifying maintenance.
The battery electric vehicles segment held a 60% share in 2025 and is projected to grow at a CAGR of 14.4% by 2035. BEVs are preferred for taxi operations due to zero-emission operation, lower running costs, longer ranges, faster charging, and superior safety features. Government incentives and expanding public and private charging networks further drive adoption, ensuring continuous operations and increased fleet efficiency.
China Electric Vehicle Taxi Market held a 37% share, generating USD 4.02 billion in 2024. Rapid fleet electrification, strong government incentives, and aggressive emission-reduction policies are accelerating adoption, especially in major urban centers. Subsidies, reduced licensing fees, and preferential charging programs encourage taxi operators to transition from traditional ICE vehicles to EVs.
Prominent companies operating in the Electric Vehicle Taxi Market include Tesla, BYD Company, Uber Electric, Didi Chuxing, OLA, BMW, BAIC, EV Capital, EVERA Auto, and Lyft. Companies are strengthening their Electric Vehicle Taxi Market positions by developing long-range EV taxis and integrating solid-state or high-density battery systems to enhance vehicle performance and reliability. Strategic partnerships with charging network providers, fleet management software companies, and urban mobility platforms enable seamless operations, optimized routing, and energy-efficient trip allocation. Leading players are investing in AI-driven fleet optimization, predictive maintenance tools, and real-time telematics to reduce downtime and operating costs. Incentive programs, fleet subscription models, and flexible leasing solutions help attract taxi operators to EV adoption.
Table of Contents
Chapter 1 Methodology
- 1.1 Market scope and definition
- 1.2 Research design
- 1.2.1 Research approach
- 1.2.2 Data collection methods
- 1.3 Data mining sources
- 1.3.1 Global
- 1.3.2 Regional/Country
- 1.4 Base estimates and calculations
- 1.4.1 Base year calculation
- 1.4.2 Key trends for market estimation
- 1.5 Primary research and validation
- 1.5.1 Primary sources
- 1.6 Forecast model
- 1.7 Research assumptions and limitations
Chapter 2 Executive Summary
- 2.1 Industry 3600 synopsis, 2022 - 2035
- 2.2 Key market trends
- 2.2.1 Regional
- 2.2.2 Vehicle
- 2.2.3 Propulsion
- 2.2.4 Service
- 2.2.5 Ownership Model
- 2.2.6 Range
- 2.2.7 Charging Infrastructure
- 2.3 TAM Analysis, 2026-2035
- 2.4 CXO perspectives: Strategic imperatives
- 2.4.1 Executive decision points
- 2.4.2 Critical success factors
- 2.5 Future outlook and strategic recommendations
Chapter 3 Industry Insights
- 3.1 Industry ecosystem analysis
- 3.1.1 Supplier landscape
- 3.1.2 Profit margin analysis
- 3.1.3 Cost structure
- 3.1.4 Value addition at each stage
- 3.1.5 Factor affecting the value chain
- 3.1.6 Disruptions
- 3.2 Industry impact forces
- 3.2.1 Growth drivers
- 3.2.1.1 Government incentives and stricter emission norms
- 3.2.1.2 Rising fuel prices of gasoline-powered vehicles
- 3.2.1.3 Advancements in battery technology
- 3.2.1.4 Growing awareness about climate change and the need for sustainable transportation solutions
- 3.2.1.5 Rapid urbanization and smart city initiatives
- 3.2.2 Industry pitfalls and challenges
- 3.2.2.1 High initial costs of electric vehicles
- 3.2.2.2 Limited charging infrastructure
- 3.2.3 Market opportunities
- 3.2.3.1 Expansion of charging infrastructure
- 3.2.3.2 Integration with smart city initiatives
- 3.2.3.3 Fleet electrification programs by corporations
- 3.2.3.4 Technological advancements in batteries and EV components
- 3.2.1 Growth drivers
- 3.3 Growth potential analysis
- 3.4 Regulatory landscape
- 3.4.1 North America
- 3.4.1.1 US Federal incentives (tax credits, grants) plus infrastructure funding (NEVI/IIJA) support fleet electrification and depot charging.
- 3.4.2 Europe
- 3.4.2.1 Germany: Electric Mobility Act (EmoG)
- 3.4.2.2 UK: Plug-in Taxi Grant Scheme (PiTG)
- 3.4.2.3 France: Mobility Orientation Law (LOM Act)
- 3.4.2.4 Italy: National Integrated Plan for Energy and Climate (PNIEC)
- 3.4.3 Asia Pacific
- 3.4.3.1 China: New Energy Vehicle (NEV) Mandate
- 3.4.3.2 India: FAME II Scheme (EV Incentives)
- 3.4.3.3 Japan: Strategic Roadmap for EV/FCV Deployment
- 3.4.3.4 Australia: State-Level Zero-Emission Vehicle Mandates
- 3.4.4 Latin America
- 3.4.4.1 Brazil: National Electric Mobility Policy (PNME)
- 3.4.4.2 Mexico: Urban Zero-Emission Taxi Programs
- 3.4.4.3 Argentina: Provincial EV Taxi Regulations (Buenos Aires)
- 3.4.5 MEA
- 3.4.5.1 UAE: EV Charging Infrastructure Regulation (ADDM/DEWA)
- 3.4.5.2 Saudi Arabia: EV Deployment Regulatory Framework (SASO)
- 3.4.5.3 South Africa: Green Transport Strategy
- 3.4.1 North America
- 3.5 Porter's analysis
- 3.6 PESTEL analysis
- 3.7 Technology and Innovation landscape
- 3.7.1 Current technological trends
- 3.7.2 Emerging technologies
- 3.8 Patent analysis
- 3.9 Pricing Analysis
- 3.9.1 By region
- 3.9.2 By propulsion
- 3.10 Cost breakdown analysis
- 3.10.1 Vehicle Cost
- 3.10.2 Operational Cost
- 3.10.3 Total cost of ownership (TCO)
- 3.10.4 Charging Infrastructure Cost
- 3.10.5 Installation & activation costs
- 3.10.6 Research & development costs
- 3.11 Sustainability and environmental impact analysis
- 3.11.1 Sustainable practices
- 3.11.2 Waste reduction strategies
- 3.11.3 Energy efficiency in production
- 3.11.4 Eco-friendly initiatives
- 3.11.5 Carbon footprint considerations
- 3.12 Future outlook & opportunities
- 3.12.1 Technology roadmap & evolution timeline
- 3.12.2 Emerging application opportunities
- 3.12.3 Investment requirements & funding sources
- 3.12.4 Risk assessment & mitigation strategies
- 3.12.5 Strategic recommendations for market participants
Chapter 4 Competitive Landscape, 2025
- 4.1 Introduction
- 4.2 Company market share analysis
- 4.2.1 North America
- 4.2.2 Europe
- 4.2.3 Asia Pacific
- 4.2.4 Latin America
- 4.2.5 MEA
- 4.3 Competitive analysis of major market players
- 4.4 Competitive positioning matrix
- 4.5 Strategic outlook matrix
- 4.6 Key developments
- 4.6.1 Mergers & acquisitions
- 4.6.2 Partnerships & collaborations
- 4.6.3 New Product Launches
- 4.6.4 Expansion Plans and funding
Chapter 5 Market Estimates & Forecast, By Vehicle, 2022 - 2035 ($Bn, Units)
- 5.1 Key trends
- 5.2 Passenger vehicles
- 5.2.1 Hatchbacks
- 5.2.2 Sedans
- 5.2.3 SUV
- 5.3 Commercial vehicles
- 5.3.1 Light commercial vehicles (LCV)
- 5.3.2 Medium commercial vehicles (MCV)
- 5.3.3 Heavy commercial vehicles (HCV)
Chapter 6 Market Estimates & Forecast, By Propulsion, 2022 - 2035 ($Bn, Units)
- 6.1 Key trends
- 6.2 Battery electric vehicles (BEVs)
- 6.3 Hybrid electric vehicles (HEVs)
- 6.4 Plug-in hybrid electric vehicles (PHEVs)
Chapter 7 Market Estimates & Forecast, By Service, 2022 - 2035 ($Bn, Units)
- 7.1 Key trends
- 7.2 Ride-Hailing
- 7.3 Cab Services
- 7.4 Fleet Operator Services
- 7.5 Robotaxi Services
Chapter 8 Market Estimates & Forecast, By Ownership Model, 2022 - 2035 ($Bn, Units)
- 8.1 Key trends
- 8.2 Fleet-Owned
- 8.3 Individual Driver-Owned
- 8.4 Subscription
- 8.5 Cooperative Models
- 8.6 Others
Chapter 9 Market Estimates & Forecast, By Range, 2022 - 2035 ($Bn, Units)
- 9.1 Key trends
- 9.2 Short Range (<150 km per charge)
- 9.3 Medium Range (150-250 km per charge)
- 9.4 Long Range (250+ km per charge)
Chapter 10 Market Estimates & Forecast, By Charging infrastructure, 2022 - 2035 ($Bn, Units)
- 10.1 Key trends
- 10.2 Fast charging
- 10.3 Slow charging
- 10.4 Wireless charging
Chapter 11 Market Estimates & Forecast, By Region, 2022 - 2035 ($Bn, Units)
- 11.1 Key trends
- 11.2 North America
- 11.2.1 US
- 11.2.2 Canada
- 11.3 Europe
- 11.3.1 Germany
- 11.3.2 UK
- 11.3.3 France
- 11.3.4 Italy
- 11.3.5 Spain
- 11.3.6 Russia
- 11.3.7 Nordics
- 11.4 Asia Pacific
- 11.4.1 China
- 11.4.2 India
- 11.4.3 Japan
- 11.4.4 Australia
- 11.4.5 South Korea
- 11.4.6 Philippines
- 11.4.7 Indonesia
- 11.5 Latin America
- 11.5.1 Brazil
- 11.5.2 Mexico
- 11.5.3 Argentina
- 11.6 MEA
- 11.6.1 South Africa
- 11.6.2 Saudi Arabia
- 11.6.3 UAE
Chapter 12 Company Profiles
- 12.1 Global Players
- 12.1.1 BAIC
- 12.1.2 BYD
- 12.1.3 Didi Chuxing
- 12.1.4 GoGreen Cab Services
- 12.1.5 Green Cab
- 12.1.6 Lyft
- 12.1.7 Nissan Motor
- 12.1.8 Tesla
- 12.1.9 Uber
- 12.1.10 Volkswagen
- 12.1.11 Waymo (Alphabet)
- 12.2 Regional Players
- 12.2.1 Alto
- 12.2.2 BluSmart Mobility
- 12.2.3 EEE-Taxi Mobility Solutions
- 12.2.4 EV Capital
- 12.2.5 EVERA Auto
- 12.2.6 Grab Holdings
- 12.2.7 Ola
- 12.3 Emerging Players
- 12.3.1 Cruise LLC (General Motors)
- 12.3.2 Evera Cabs
- 12.3.3 GSM Green and Smart Mobility
- 12.3.4 Xanh SM
 计程车:市场占有率分析、产业趋势和统计数据、成长预测(2026-2031 年)
 全球摩托车计程车服务市场 2026-2030
 全球电动车计程车市场-产业规模、份额、趋势、机会和预测,按类型(混合动力汽车和纯电动汽车)、车辆类型(四轮和两轮)、地区和竞争格局划分,2021-2031年预测
 计程车市场规模、份额和成长分析(按预订类型、车辆类型、服务类型和地区划分)-2026-2033年产业预测
 摩托车计程车服务市场规模、份额和成长分析(按提供者、类型、车辆类型、应用和地区划分):产业预测(2026-2033 年)
 新能源计程车市场规模、份额及成长分析(按车辆类型、续航里程、车辆等级、所有权类型、车辆等级及地区划分)-2026-2033年产业预测
 2025-2032 年全球新能源计程车市场预测(按动力传动系统、充电方式、电池容量和行驶里程)按服务类型、车辆类型、使用週期、客户类型和应用程式分類的摩托计程车服务市场-2025-2032年全球预测摩托车计程车服务市场:依服务类型、车辆类型、服务时间、车款和使用者类型划分-全球预测,2025-2032年计程车服务市场按服务类型、车辆类型、行驶距离、预订平台和客户类型划分-2025-2032年全球预测