


 |
市场调查报告书
商品编码
1913347
逆向物流市场机会、成长要素、产业趋势分析及预测(2026年至2035年)Reverse Logistics Market Opportunity, Growth Drivers, Industry Trend Analysis, and Forecast 2026 - 2035 |
||||||
全球逆向物流市场预计到 2025 年将达到 8,726 亿美元,到 2035 年将达到 1.75 兆美元,年复合成长率为 7.3%。
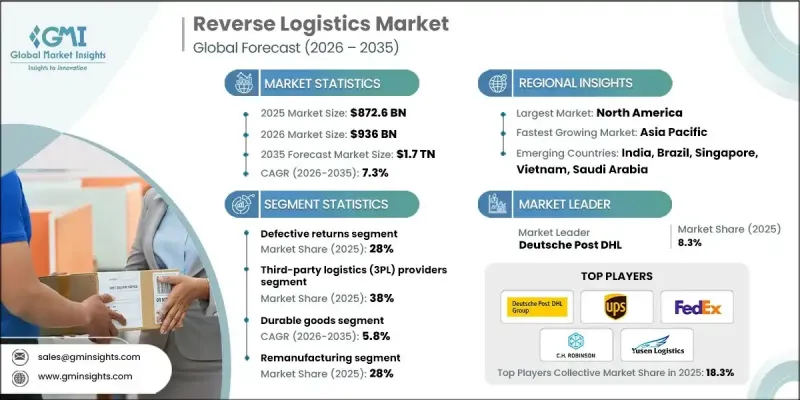
市场成长的驱动力在于企业日益重视环境责任,并致力于实现更广泛的永续性目标。逆向物流透过系统性地收集、再利用和负责任地处置退货产品,协助企业减少废弃物,从而帮助企业降低环境影响,并加强其企业社会责任。永续性也正成为竞争优势,消费者越来越支持那些实践负责任商业营运的企业。数位商务的快速发展显着增加了退货量,因此需要一个高效率的系统来管理产品在供应链中的流动。简化的退货流程与客户满意度、品牌可靠性和长期客户维繫密切相关。逆向物流还能透过回收退货价值、提高材料利用效率和减少对新投入的依赖来支持成本控制。随着企业追求循环经济模式和业务永续营运,逆向物流作为一项战略能力,在全球范围内对零售、製造和分销网络的重要性日益凸显。
| 市场覆盖范围 | |
|---|---|
| 开始年份 | 2025 |
| 预测年份 | 2026-2035 |
| 起始值 | 8726亿美元 |
| 预测金额 | 1.75兆美元 |
| 复合年增长率 | 7.3% |
预计到2025年,缺陷退货将占总退货量的28%。大量不合格产品持续推动逆向物流,尤其是在技术主导和消费导向产业。各组织正越来越多地利用先进的诊断工具和供应商协作工具来控制缺陷相关的成本。随着监管审查力度加大和透明度要求提高,产品召回事件也增加。
预计2026年至2035年,耐用消费品产业将以5.8%的复合年增长率成长。高回收率、可再生以及持续的次市场需求是推动其强劲成长的主要因素。此外,由于合规要求、生命週期管理和环境因素的影响,与消费品相关的逆向物流活动也不断扩展。
美国逆向物流市场预计到2025年将达到1,600亿美元,并有望在2035年前保持强劲成长。高回收率推动了对自动化、数据驱动分类和更快处理週期的投资。许多公司正在将逆向物流业务外包,以提高效率和客户体验,而永续性和ESG(环境、社会和治理)倡议也持续推动再利用和回收专案的加速发展。
目录
第一章调查方法
第二章执行摘要
第三章业界考察
- 生态系分析
- 供应商情况
- 利润率分析
- 成本结构
- 每个阶段的附加价值
- 影响价值链的因素
- 中断
- 产业影响因素
- 司机
- 由于网路购物的成长,电子商务退货率上升
- 废弃物管理和回收的监管要求
- 人们对永续性和循环经济的日益关注
- 从退货和可再生材料中回收成本的潜力
- 技术进步:人工智慧、物联网和区块链在追踪和自动化领域的应用
- 产业潜在风险与挑战
- 退货运输和处理成本高昂
- 多通路退货管理的复杂性
- 市场机会
- 与绿色物流和碳足迹减少倡议相结合
- 翻新和二手市场的扩张
- 引进智慧逆向物流解决方案(人工智慧、预测分析)
- 製造商、零售商和回收公司之间的合作
- 成长潜力分析
- 监管环境
- 北美洲
- 美国-《资源保护与回收法》(RCRA)与《生产者延伸责任法》(EPR)
- 加拿大—《加拿大环境保护法》(CEPA)和省级生产者责任延伸计划
- 欧洲
- 英国- 废弃电子电气设备 (WEEE) 法规
- 德国 - 循环经济法 (Kreislaufwirtschaftsgesetz)
- 法国-循环经济废弃物减量法案(AGEC法案)
- 义大利 - 环境法(第 152/2006 号法令)
- 西班牙—废弃物和污染土壤法
- 亚太地区
- 中国——生产者延伸责任制和固态废弃物污染防治法
- 日本-家用电器回收法和汽车回收法
- 印度 - 电子废弃物管理规则和塑胶废弃物管理规则
- 拉丁美洲
- 巴西 - 国家固态废弃物政策 (PNRS)
- 墨西哥 -废弃物预防和综合管理总法 (LGPGIR)
- 阿根廷 - 综合废弃物管理法
- 中东和非洲
- 阿联酋 - 联邦废弃物管理法
- 南非 - 国家环境管理:废弃物法
- 沙乌地阿拉伯 -废弃物管理法规
- 北美洲
- 波特五力分析
- PESTEL 分析
- 科技与创新趋势
- 当前技术趋势
- 新兴技术
- 成本細項分析
- 开发成本结构
- 研发费用分析
- 行销和销售成本
- 专利分析
- 永续性和环境方面
- 永续实践
- 减少废弃物策略
- 生产中的能源效率
- 环保倡议
- 回报行为和回报率的趋势
- 按产业和产品类型分析回报率
- 宽鬆的退货政策对逆向物流量的影响
- 季节性和促销活动带来的收益波动
- 逆向物流营运中的风险状况
- 未来营运模式与产业演变
- 基于平台的逆向物流生态系统
- 去中心化和按需退货处理
- 零废弃物政策的长期影响
第四章 竞争情势
- 介绍
- 公司市占率分析
- 北美洲
- 欧洲
- 亚太地区
- 拉丁美洲
- 中东和非洲
- 主要市场公司的竞争分析
- 竞争定位矩阵
- 战略展望矩阵
- 重大进展
- 併购
- 伙伴关係与合作
- 新产品发布
- 企业扩张计画和资金筹措
第五章 依製造流程分類的市场估算与预测,2021-2034年
- 退货管理
- 再製造
- 回收利用
- 处理
- 其他的
6. 2021-2034年按收入分類的市场估计与预测
- 瑕疵退货
- 征收的收入
- B2B 和商业回报
- 可修復退货
- 生命终点回归
- 其他的
7.服务供应商市场估算与预测,2021-2034 年
- 内部逆向物流
- 第三方物流(3PL) 供应商
- 回收公司
- 废弃物管理公司
第八章 按类别分類的市场估计和预测,2022-2035年
- 耐久性消费品
- 消耗品
- 工业设备
- 包装材料
- 其他的
第九章 依最终用途分類的市场估计与预测,2021-2034年
- 零售与电子商务
- 电子设备
- 车
- 製药
- 製造业
- 其他的
第十章 2022-2035年各地区市场估计与预测
- 北美洲
- 美国
- 加拿大
- 欧洲
- 德国
- 英国
- 法国
- 义大利
- 西班牙
- 俄罗斯
- 北欧国家
- 葡萄牙
- 克罗埃西亚
- 比荷卢经济联盟
- 亚太地区
- 中国
- 印度
- 日本
- 澳洲
- 韩国
- 新加坡
- 泰国
- 印尼
- 越南
- 拉丁美洲
- 巴西
- 墨西哥
- 阿根廷
- 哥伦比亚
- 中东和非洲
- 南非
- 沙乌地阿拉伯
- 阿拉伯聯合大公国
- 土耳其
第十一章 公司简介
- 世界玩家
- Deutsche Post DHL
- United Parcel Service(UPS)
- FedEx
- CMA CGM
- DB Schenker
- CEVA Logistics
- XPO Logistics
- Ryder System
- CH Robinson Worldwide
- Yusen Logistics
- Kintetsu World Express
- Ingram Micro Commerce &Lifecycle Services
- Logistics Plus
- 区域玩家
- NFI Industries
- Pitney Bowes
- Blue Dart Express
- Safexpress
- Reverse Logistics
- Stena Recycling
- R2 Logistics
- Inmar Intelligence
- Emerging/Disruptor Players
- Happy Returns(a PayPal company)
- Optoro
- ReverseLogix
- Apto Solutions
- Forterra Solutions
- Core Logistic
- Softbox Systems
- R2 Logistics
- Forterra Solutions
The Global Reverse Logistics Market was valued at USD 872.6 billion in 2025 and is estimated to grow at a CAGR of 7.3% to reach USD 1.75 trillion by 2035.
Market growth is driven by stronger corporate focus on environmental responsibility and alignment with broader sustainability objectives. Reverse logistics supports waste reduction by enabling structured recovery, reuse, and responsible disposal of returned products, helping organizations reduce environmental impact while strengthening corporate responsibility commitments. Sustainability has also become a competitive differentiator, as consumers increasingly favor companies that demonstrate responsible operational practices. The rapid expansion of digital commerce has significantly increased return volumes, intensifying the need for efficient systems to manage product movement back through the supply chain. Streamlined return handling is now closely tied to customer satisfaction, brand trust, and long-term retention. Reverse logistics also supports cost control by recovering value from returned goods, improving material efficiency, and reducing reliance on new inputs. As companies pursue circular economy models and operational resilience, reverse logistics has become a strategic function across retail, manufacturing, and distribution networks worldwide.
| Market Scope | |
|---|---|
| Start Year | 2025 |
| Forecast Year | 2026-2035 |
| Start Value | $872.6 Billion |
| Forecast Value | $1.75 Trillion |
| CAGR | 7.3% |
The defective returns segment held 28% share in 2025. High volumes of nonconforming products continue to drive reverse flows, particularly across technology-driven and consumer-focused industries. Organizations are increasingly applying advanced diagnostics and supplier collaboration tools to limit defect-related costs. Product recalls are also rising as regulatory oversight and transparency expectations continue to increase.
The durable goods segment is forecast to grow at a CAGR of 5.8% from 2026 to 2035. Strong performance is supported by higher return frequency, refurbishment potential, and sustained secondary market demand. Reverse logistics activity related to consumable products is also expanding, influenced by compliance requirements, lifecycle management, and environmental considerations.
U.S. Reverse Logistics Market reached USD 160 billion in 2025 and is expected to show strong growth through 2035. High return rates are driving investment in automation, data-driven sorting, and faster processing cycles. Many businesses are outsourcing reverse operations to improve efficiency and customer experience, while sustainability mandates and ESG initiatives continue to accelerate reuse and recovery programs.
Major companies operating in the Global Reverse Logistics Market include United Parcel Service (UPS), Deutsche Post DHL, FedEx, DB Schenker, CEVA Logistics, C.H. Robinson Worldwide, Yusen Logistics, Kintetsu World Express, NFI Industries, Optoro, and ReverseLogix. Companies in the Global Reverse Logistics Market are strengthening their competitive position through automation, digital platforms, and service integration. Investments in artificial intelligence and data analytics are improving return visibility, grading accuracy, and processing speed. Strategic partnerships with retailers and manufacturers help expand service scope and secure long-term contracts. Many providers are enhancing sustainability-focused offerings to support recycling, refurbishment, and resale initiatives. Geographic expansion and localized return centers are being used to reduce transportation costs and turnaround times. Firms are also differentiating through end-to-end solutions that integrate transportation, warehousing, and data management.
Table of Contents
Chapter 1 Methodology
- 1.1 Market scope and definition
- 1.2 Research design
- 1.2.1 Research approach
- 1.2.2 Data collection methods
- 1.3 Data mining sources
- 1.3.1 Global
- 1.3.2 Regional/Country
- 1.4 Base estimates and calculations
- 1.4.1 Base year calculation
- 1.4.2 Key trends for market estimation
- 1.5 Primary research and validation
- 1.5.1 Primary sources
- 1.6 Forecast
- 1.7 Research assumptions and limitations
Chapter 2 Executive Summary
- 2.1 Industry 360° synopsis, 2022 - 2035
- 2.2 Key market trends
- 2.2.1 Regional
- 2.2.2 Processes
- 2.2.3 Return
- 2.2.4 Service provider
- 2.2.5 Category
- 2.2.6 End use
- 2.3 TAM Analysis, 2026-2035
- 2.4 CXO perspectives: Strategic imperatives
- 2.4.1 Executive decision points
- 2.4.2 Critical success factors
- 2.5 Future outlook & strategic recommendations
Chapter 3 Industry Insights
- 3.1 Industry ecosystem analysis
- 3.1.1 Supplier landscape
- 3.1.2 Profit margin analysis
- 3.1.3 Cost structure
- 3.1.4 Value addition at each stage
- 3.1.5 Factor affecting the value chain
- 3.1.6 Disruptions
- 3.2 Industry impact forces
- 3.2.1.1 Growth drivers
- 3.2.1.2 Increasing e-commerce returns due to online shopping growth.
- 3.2.1.3 Regulatory mandates for waste management and recycling.
- 3.2.1.4 Rising focus on sustainability and circular economy adoption.
- 3.2.1.5 Cost recovery potential from returned goods and recyclable materials.
- 3.2.1.6 Technological advancements: AI, IoT, and blockchain for tracking and automation
- 3.2.2 Industry pitfalls and challenges
- 3.2.2.1 High operational costs for transportation and processing of returns.
- 3.2.2.2 Complexity in managing multi-channel returns.
- 3.2.3 Market opportunities
- 3.2.3.1 Integration with green logistics and carbon footprint reduction initiatives.
- 3.2.3.2 Expansion of refurbished and secondary markets.
- 3.2.3.3 Adoption of smart reverse logistics solutions (AI, predictive analytics).
- 3.2.3.4 Partnerships between manufacturers, retailers, and recycling firms.
- 3.3 Growth potential analysis
- 3.4 Regulatory landscape
- 3.4.1 North America
- 3.4.1.1 U.S. - Resource Conservation and Recovery Act (RCRA) & Extended Producer Responsibility (EPR) Laws
- 3.4.1.2 Canada - Canadian Environmental Protection Act (CEPA) & Provincial EPR Programs
- 3.4.2 Europe
- 3.4.2.1 UK - Waste Electrical and Electronic Equipment (WEEE) Regulations
- 3.4.2.2 Germany - Circular Economy Act (Kreislaufwirtschaftsgesetz)
- 3.4.2.3 France - Anti-Waste Law for a Circular Economy (AGEC Law)
- 3.4.2.4 Italy - Environmental Code (Legislative Decree 152/2006)
- 3.4.2.5 Spain - Waste and Contaminated Soils Law
- 3.4.3 Asia Pacific
- 3.4.3.1 China - Extended Producer Responsibility System & Solid Waste Pollution Prevention Law
- 3.4.3.2 Japan - Home Appliance Recycling Act & End-of-Life Vehicle Recycling Law
- 3.4.3.3 India - E-Waste Management Rules & Plastic Waste Management Rules
- 3.4.4 Latin America
- 3.4.4.1 Brazil - National Solid Waste Policy (PNRS)
- 3.4.4.2 Mexico - General Law for Waste Prevention and Integral Management (LGPGIR)
- 3.4.4.3 Argentina - Integrated Waste Management Law
- 3.4.5 Middle East & Africa
- 3.4.5.1 UAE - Federal Law on Waste Management
- 3.4.5.2 South Africa - National Environmental Management: Waste Act
- 3.4.5.3 Saudi Arabia - Waste Management Regulation
- 3.4.1 North America
- 3.5 Porter's analysis
- 3.6 PESTEL analysis
- 3.7 Technology and innovation landscape
- 3.7.1 Current technological trends
- 3.7.2 Emerging technologies
- 3.8 Cost breakdown analysis
- 3.8.1 Development cost structure
- 3.8.2 R&D cost analysis
- 3.8.3 Marketing & sales costs
- 3.9 Patent analysis
- 3.10 Sustainability and environmental aspects
- 3.10.1 Sustainable practices
- 3.10.2 Waste reduction strategies
- 3.10.3 Energy efficiency in production
- 3.10.4 Eco-friendly Initiatives
- 3.11 Returns behavior & return-rate dynamics
- 3.11.1 Return rate analysis by industry and product category
- 3.11.2 Impact of liberal return policies on reverse logistics volumes
- 3.11.3 Seasonal and promotional return fluctuations
- 3.12 Risk landscape in reverse logistics operations
- 3.13 Future operating models & industry evolution
- 3.13.1 Platform-based reverse logistics ecosystems
- 3.13.2 Decentralized and on-demand return processing
- 3.13.3 Long-term implications of zero-waste mandates
Chapter 4 Competitive Landscape, 2025
- 4.1 Introduction
- 4.2 Company market share analysis
- 4.2.1 North America
- 4.2.2 Europe
- 4.2.3 Asia Pacific
- 4.2.4 LATAM
- 4.2.5 MEA
- 4.3 Competitive analysis of major market players
- 4.4 Competitive positioning matrix
- 4.5 Strategic outlook matrix
- 4.6 Key developments
- 4.6.1 Mergers & acquisitions
- 4.6.2 Partnerships & collaborations
- 4.6.3 New Product Launches
- 4.6.4 Expansion Plans and funding
Chapter 5 Market Estimates & Forecast, By Processes, 2021 - 2034 ($Bn)
- 5.1 Key trends
- 5.2 Returns management
- 5.3 Remanufacturing
- 5.4 Recycling
- 5.5 Disposal
- 5.6 Others
Chapter 6 Market Estimates & Forecast, By Return, 2021 - 2034 ($Bn)
- 6.1 Key trends
- 6.2 Defective returns
- 6.3 Recalled returns
- 6.4 B2B returns and commercial returns
- 6.5 Repairable returns
- 6.6 End of life returns
- 6.7 Others
Chapter 7 Market Estimates & Forecast, By Service Provider, 2021 - 2034 ($Bn)
- 7.1 Key trends
- 7.2 In-house reverse logistics
- 7.3 Third-party logistics (3PL) Providers
- 7.4 Recycling companies
- 7.5 Waste management companies
Chapter 8 Market Estimates & Forecast, By Category, 2022 - 2035 (USD Mn)
- 8.1 Key trends
- 8.2 Durable Goods
- 8.3 Consumables
- 8.4 Industrial Equipment
- 8.5 Packaging Materials
- 8.6 Others
Chapter 9 Market Estimates & Forecast, By End Use, 2021 - 2034 ($Bn)
- 9.1 Key trends
- 9.2 Retail & E-commerce
- 9.3 Electronics
- 9.4 Automotive
- 9.5 Pharmaceuticals
- 9.6 Manufacturing
- 9.7 Others
Chapter 10 Market Estimates & Forecast, By Region, 2022 - 2035 (USD Mn)
- 10.1 Key trends
- 10.2 North America
- 10.2.1 US
- 10.2.2 Canada
- 10.3 Europe
- 10.3.1 Germany
- 10.3.2 UK
- 10.3.3 France
- 10.3.4 Italy
- 10.3.5 Spain
- 10.3.6 Russia
- 10.3.7 Nordics
- 10.3.8 Portugal
- 10.3.9 Croatia
- 10.3.10 Benelux
- 10.4 Asia Pacific
- 10.4.1 China
- 10.4.2 India
- 10.4.3 Japan
- 10.4.4 Australia
- 10.4.5 South Korea
- 10.4.6 Singapore
- 10.4.7 Thailand
- 10.4.8 Indonesia
- 10.4.9 Vietnam
- 10.5 Latin America
- 10.5.1 Brazil
- 10.5.2 Mexico
- 10.5.3 Argentina
- 10.5.4 Colombia
- 10.6 MEA
- 10.6.1 South Africa
- 10.6.2 Saudi Arabia
- 10.6.3 UAE
- 10.6.4 Turkey
Chapter 11 Company Profiles
- 11.1 Global Players
- 11.1.1 Deutsche Post DHL
- 11.1.2 United Parcel Service (UPS)
- 11.1.3 FedEx
- 11.1.4 CMA CGM
- 11.1.5 DB Schenker
- 11.1.6 CEVA Logistics
- 11.1.7 XPO Logistics
- 11.1.8 Ryder System
- 11.1.9 C.H. Robinson Worldwide
- 11.1.10 Yusen Logistics
- 11.1.11 Kintetsu World Express
- 11.1.12 Ingram Micro Commerce & Lifecycle Services
- 11.1.13 Logistics Plus
- 11.2 Regional Players
- 11.2.1 NFI Industries
- 11.2.2 Pitney Bowes
- 11.2.3 Blue Dart Express
- 11.2.4 Safexpress
- 11.2.5 Reverse Logistics
- 11.2.6 Stena Recycling
- 11.2.7 R2 Logistics
- 11.2.8 Inmar Intelligence
- 11.3 Emerging / Disruptor Players
- 11.3.1 Happy Returns (a PayPal company)
- 11.3.2 Optoro
- 11.3.3 ReverseLogix
- 11.3.4 Apto Solutions
- 11.3.5 Forterra Solutions
- 11.3.6 Core Logistic
- 11.3.7 Softbox Systems
- 11.3.8 R2 Logistics
- 11.3.9 Forterra Solutions
 逆向物流市场规模、份额、成长及全球产业分析:按类型、应用和地区划分,并提供 2026-2034 年的洞察和预测
 美国逆向物流:市场占有率分析、产业趋势与统计、成长预测(2026-2031)
 逆向物流市场报告:按退货类型、服务、最终用户和地区划分(2026-2034 年)
 2026-2030年全球逆向物流自动化软体市场
 逆向供应链解决方案市场按服务类型、技术、流程步骤、通路类型、材料类型、最终用户和应用划分-2026-2032年全球预测日本逆向物流市场报告(依退货类型、服务、最终用户和地区划分,2026-2034年)
 逆向物流市场规模、份额和成长分析(按退货类型、服务、最终用户产业和地区划分)-2026-2033年产业预测
 2032年农业价值链逆向物流市场预测:按产品类型、逆向物流类型、最终用户和地区分類的全球分析可回收包装市场预测至2032年:逆向物流-按材料、包装类型、应用、最终用户和地区分類的全球分析
 全球逆向物流市场