


 |
市场调查报告书
商品编码
1913373
豌豆淀粉市场:市场机会、成长驱动因素、产业趋势分析及预测(2026-2035)Pea Starch Market Opportunity, Growth Drivers, Industry Trend Analysis, and Forecast 2026 - 2035 |
||||||
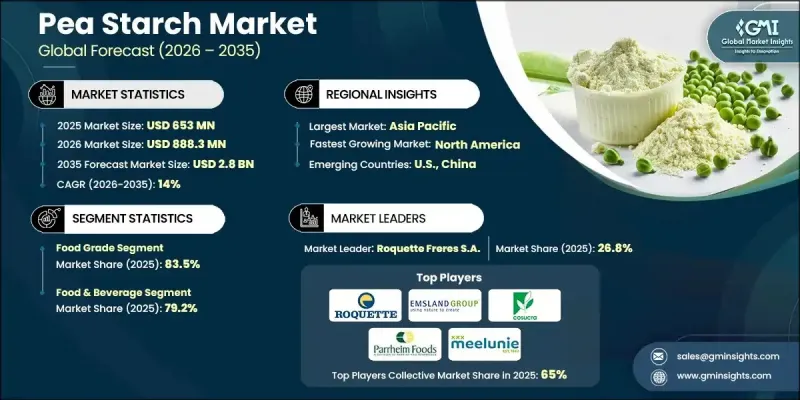
全球豌豆淀粉市场预计到 2025 年将价值 6.53 亿美元,到 2035 年将达到 28 亿美元,年复合成长率为 14%。
全球食品饮料产业的结构性变革推动了豌豆淀粉市场的扩张。製造商越来越依赖植物来源原料来增强产品的功能性、质地和营养价值。豌豆淀粉因其优异的性能和符合洁净标示趋势的特点,作为一种用途广泛的原料,在各种加工食品和包装食品配方中备受关注。消费者饮食习惯向便利和健康食品的转变,尤其是在已开发国家,推动了豌豆淀粉需求的稳定成长。同时,新兴市场的快速都市化、可支配收入的增加以及生活方式的改变,正在加速包装食品的消费,进一步增强了市场成长势头。欧洲食品产业也为市场成长做出了贡献,製造商优先考虑植物来源原料,以满足监管标准和消费者对透明度和永续性的日益增长的期望。这些趋势共同作用,使豌豆淀粉成为全球淀粉和特种碳水化合物市场中成长最快的原料之一。
| 市场覆盖范围 | |
|---|---|
| 开始年份 | 2025 |
| 预测年份 | 2026-2035 |
| 起始值 | 6.53亿美元 |
| 预测金额 | 28亿美元 |
| 复合年增长率 | 14% |
2025年,食品级产品市占率将达到83.5%,这主要得益于其卓越的品质标准和在人类消费领域的广泛应用。认证和合规要求将继续影响该领域产品的市场推广。
到 2025 年,食品和饮料行业将占 79.2% 的份额,这主要得益于豌豆淀粉相对于其他淀粉来源的功能优势,特别是其性能的稳定性和配方效率。
预计到 2025 年,北美豌豆淀粉市场份额将达到 17%,其成长主要得益于美国食品业的稳步扩张以及对便捷加工食品需求的不断增长。
目录
第一章:分析方法和范围
第二章执行摘要
第三章业界考察
- 产业生态系分析
- 供应商情况
- 利润率
- 每个阶段的附加价值
- 影响价值链的因素
- 中断
- 产业影响因素
- 司机
- 产业潜在风险与挑战
- 市场机会
- 成长潜力分析
- 监管环境
- 北美洲
- 欧洲
- 亚太地区
- 拉丁美洲
- 中东和非洲
- 波特五力分析
- PESTEL 分析
- 价格趋势
- 按地区
- 按形状
- 未来市场趋势
- 科技与创新趋势
- 当前技术趋势
- 新兴技术
- 专利状态
- 贸易统计(HS编码)
(註:贸易统计数据仅涵盖主要国家。)
- 主要进口国
- 主要出口国
第四章 竞争情势
- 介绍
- 公司市占率分析
- 按地区
- 北美洲
- 欧洲
- 亚太地区
- 拉丁美洲
- 中东和非洲
- 按地区
- 企业矩阵分析
- 主要企业的竞争分析
- 竞争定位矩阵
- 主要趋势
- 企业合併(M&A)
- 伙伴关係与合作
- 新产品发布
- 业务拓展计划
第五章 按产品分類的市场估算与预测(2022-2035 年)
- 食品级
- 工业级
- 饲料级
第六章 按应用领域分類的市场估算与预测(2022-2035 年)
- 製药
- 食品/饮料
- 麵包和糖果甜点
- 乳製品
- 汤、酱汁、调味料
- 零食和即食食品
- 饲料
- 纸张和纺织品
- 其他的
- 黏合剂
- 生质塑胶
第七章 按功能分類的市场估计和预测(2022-2035 年)
- 增稠剂
- 粘合剂
- 胶凝剂
- 成膜剂
- 增稠剂
第八章 按分销管道分類的市场估算和预测(2022-2035 年)
- 直销(B2B)
- 零售
- 超级市场
- 专卖店
- 其他的
- 线上管道
第九章 各地区市场估算与预测(2022-2035 年)
- 北美洲
- 美国
- 加拿大
- 欧洲
- 德国
- 英国
- 法国
- 西班牙
- 义大利
- 其他欧洲
- 亚太地区
- 中国
- 印度
- 日本
- 澳洲
- 韩国
- 亚太其他地区
- 拉丁美洲
- 巴西
- 墨西哥
- 阿根廷
- 其他拉丁美洲
- 中东和非洲
- 沙乌地阿拉伯
- 南非
- 阿拉伯聯合大公国
- 其他中东和非洲地区
第十章:公司简介
- Roquette Freres SA
- Yantai Oriental Protein Tech Co. Ltd.
- Cosucra-Groupe Warcoing
- Emsland-Starke GmbH
- Shandong Jianyuan Bioengineering Co., Ltd.
- Vestkorn Milling AS
- Dakota Dry Bean Inc.
- Yantai T.Full Biotech Co Ltd.
- Parrheim Foods
- Meelunie BV
- American Key Products Inc.
- AGT Food and Ingredients Inc.
- The Scoular Company
- Qingdao CBH Co., Ltd.
The Global Pea Starch Market was valued at USD 653 million in 2025 and is estimated to grow at a CAGR of 14% to reach USD 2.8 billion by 2035.
Market expansion is driven by structural changes within the global food and beverage sector, where manufacturers increasingly rely on plant-based ingredients to improve functionality, texture, and nutritional positioning. Pea starch is gaining strong traction as a versatile ingredient used across a wide range of processed and packaged food formulations due to its favorable performance characteristics and compatibility with clean-label trends. Shifts in consumer eating patterns toward convenience-oriented and health-conscious food options are supporting steady demand growth, particularly in developed economies. At the same time, rapid urbanization, rising disposable incomes, and lifestyle changes across emerging markets are accelerating the consumption of packaged foods, further strengthening market momentum. The European food industry is also contributing to growth as manufacturers prioritize plant-derived ingredients to meet evolving regulatory standards and consumer expectations related to transparency and sustainability. Together, these dynamics are positioning pea starch as a high-growth ingredient within the global starch and specialty carbohydrate landscape.
| Market Scope | |
|---|---|
| Start Year | 2025 |
| Forecast Year | 2026-2035 |
| Start Value | $653 Million |
| Forecast Value | $2.8 Billion |
| CAGR | 14% |
The food-grade products segment accounted for 83.5% share in 2025, supported by its superior quality standards and widespread use in human consumption applications. Certification and compliance requirements continue to shape product adoption within this segment.
The food & beverage segment held 79.2% share in 2025, driven by the functional advantages pea starch offers over alternative starch sources, including performance consistency and formulation efficiency.
North America Pea Starch Market held 17% share in 2025, with growth primarily supported by steady expansion in the U.S. food industry and increasing demand for convenient and processed food products.
Key companies operating in the Global Pea Starch Market include Roquette Freres S.A., Cosucra-Groupe Warcoing, Emsland-Starke GmbH, Vestkorn Milling AS, AGT Food and Ingredients Inc., Meelunie B.V., Dakota Dry Bean Inc., The Scoular Company, American Key Products Inc., Parrheim Foods, Yantai Oriental Protein Tech Co. Ltd., Qingdao CBH Co., Ltd., Shandong Jianyuan Bioengineering Co., Ltd., and Yantai T.Full Biotech Co Ltd. Companies in the Global Pea Starch Market are strengthening their competitive position by expanding processing capacities and securing long-term raw material sourcing agreements to ensure supply stability. Continuous investment in product innovation allows manufacturers to improve functional performance and tailor starch solutions for specific application needs. Strategic collaborations with food processors support the co-development of customized formulations and accelerate market penetration. Firms are also focusing on certifications, clean-label compliance, and sustainability messaging to align with evolving consumer and regulatory expectations.
Table of Contents
Chapter 1 Methodology & Scope
- 1.1 Market scope and definition
- 1.2 Research design
- 1.2.1 Research approach
- 1.2.2 Data collection methods
- 1.3 Data mining sources
- 1.3.1 Global
- 1.3.2 Regional/Country
- 1.4 Base estimates and calculations
- 1.4.1 Base year calculation
- 1.4.2 Key trends for market estimation
- 1.5 Primary research and validation
- 1.5.1 Primary sources
- 1.6 Forecast model
- 1.7 Research assumptions and limitations
Chapter 2 Executive Summary
- 2.1 Industry 360° synopsis
- 2.2 Key market trends
- 2.2.1 Regional
- 2.2.2 Product
- 2.2.3 End Use
- 2.3 TAM Analysis, 2026-2035
- 2.4 CXO perspectives: Strategic imperatives
- 2.4.1 Executive decision points
- 2.4.2 Critical success factors
- 2.5 Future Outlook and Strategic Recommendations
Chapter 3 Industry Insights
- 3.1 Industry ecosystem analysis
- 3.1.1 Supplier landscape
- 3.1.2 Profit margin
- 3.1.3 Value addition at each stage
- 3.1.4 Factor affecting the value chain
- 3.1.5 Disruptions
- 3.2 Industry impact forces
- 3.2.1 Growth drivers
- 3.2.2 Industry pitfalls and challenges
- 3.2.3 Market opportunities
- 3.3 Growth potential analysis
- 3.4 Regulatory landscape
- 3.4.1 North America
- 3.4.2 Europe
- 3.4.3 Asia Pacific
- 3.4.4 Latin America
- 3.4.5 Middle East & Africa
- 3.5 Porter's analysis
- 3.6 PESTEL analysis
- 3.7 Price trends
- 3.7.1 By region
- 3.7.2 By form
- 3.8 Future market trends
- 3.9 Technology and Innovation landscape
- 3.9.1 Current technological trends
- 3.9.2 Emerging technologies
- 3.10 Patent Landscape
- 3.11 Trade statistics (HS code)
( Note: The trade statistics will be provided for key countries only)
- 3.11.1 Major importing countries
- 3.11.2 Major exporting countries
Chapter 4 Competitive Landscape, 2025
- 4.1 Introduction
- 4.2 Company market share analysis
- 4.2.1 By region
- 4.2.1.1 North America
- 4.2.1.2 Europe
- 4.2.1.3 Asia Pacific
- 4.2.1.4 LATAM
- 4.2.1.5 MEA
- 4.2.1 By region
- 4.3 Company matrix analysis
- 4.4 Competitive analysis of major market players
- 4.5 Competitive positioning matrix
- 4.6 Key developments
- 4.6.1 Mergers & acquisitions
- 4.6.2 Partnerships & collaborations
- 4.6.3 New Product Launches
- 4.6.4 Expansion Plans
Chapter 5 Market Estimates and Forecast, By Product, 2022-2035 (USD Billion & Tons)
- 5.1 Key trends
- 5.2 Food grade
- 5.3 Industrial grade
- 5.4 Feed grade
Chapter 6 Market Estimates and Forecast, By Application, 2022-2035 (USD Billion & Tons)
- 6.1 Key trends
- 6.2 Pharmaceutical
- 6.3 Food & beverage
- 6.3.1 Bakery & Confectionery
- 6.3.2 Dairy Products
- 6.3.3 Soups, Sauces & Dressings
- 6.3.4 Snacks & Convenience Foods
- 6.4 Animal feed
- 6.5 Paper & textiles
- 6.6 Others
- 6.6.1 Adhesives
- 6.6.2 Bioplastics
Chapter 7 Market Estimates and Forecast, By Functionality, 2022-2035 (USD Billion & Tons)
- 7.1 Key trends
- 7.2 Thickening Agent
- 7.3 Binding Agent
- 7.4 Gelling Agent
- 7.5 Film-forming Agent
- 7.6 Texturizing Agent
Chapter 8 Market Estimates and Forecast, By Distribution Channel, 2022-2035 (USD Billion & Tons)
- 8.1 Key trends
- 8.2 Direct Sales (B2B)
- 8.3 Retail
- 8.3.1 Supermarkets
- 8.3.2 Specialty Stores
- 8.3.3 Others
- 8.4 Online Channels
Chapter 9 Market Estimates and Forecast, By Region, 2022-2035 (USD Billion & Tons)
- 9.1 Key trends
- 9.2 North America
- 9.2.1 U.S.
- 9.2.2 Canada
- 9.3 Europe
- 9.3.1 Germany
- 9.3.2 UK
- 9.3.3 France
- 9.3.4 Spain
- 9.3.5 Italy
- 9.3.6 Rest of Europe
- 9.4 Asia Pacific
- 9.4.1 China
- 9.4.2 India
- 9.4.3 Japan
- 9.4.4 Australia
- 9.4.5 South Korea
- 9.4.6 Rest of Asia Pacific
- 9.5 Latin America
- 9.5.1 Brazil
- 9.5.2 Mexico
- 9.5.3 Argentina
- 9.5.4 Rest of Latin America
- 9.6 Middle East and Africa
- 9.6.1 Saudi Arabia
- 9.6.2 South Africa
- 9.6.3 UAE
- 9.6.4 Rest of Middle East and Africa
Chapter 10 Company Profiles
- 10.1 Roquette Freres S.A.
- 10.2 Yantai Oriental Protein Tech Co. Ltd.
- 10.3 Cosucra-Groupe Warcoing
- 10.4 Emsland-Starke GmbH
- 10.5 Shandong Jianyuan Bioengineering Co., Ltd.
- 10.6 Vestkorn Milling AS
- 10.7 Dakota Dry Bean Inc.
- 10.8 Yantai T.Full Biotech Co Ltd.
- 10.9 Parrheim Foods
- 10.10 Meelunie B.V.
- 10.11 American Key Products Inc.
- 10.12 AGT Food and Ingredients Inc.
- 10.13 The Scoular Company
- 10.14 Qingdao CBH Co., Ltd.
 豌豆淀粉市场-全球产业规模、份额、趋势、机会、预测:按产品类型、功能、最终用途、地区和竞争格局划分,2021-2031年
 豌豆淀粉市场规模、份额及成长分析(按来源、应用及地区划分)-2026-2033年产业预测
 豌豆淀粉:全球市占率及排名、总销售额及需求预测(2025-2031年)
 豌豆淀粉的全球市场(~2035年):各类型原料,各等级类型,各应用领域,各功能类型,各加工方法类型,各形状类型,企业规模,各主要地区,产业趋势,预测
 豌豆淀粉市场预测至2032年:按产品、功能、来源、应用、最终用户和地区进行的全球分析
 全球豌豆淀粉市场:按应用、按形式、按功能、按等级、按特性、按产品类型、按原材料、按技术类型、按地区 - 预测至 2029 年