


 |
市场调查报告书
商品编码
1928876
家用电子电器产品用高压电容器市场:机会、成长要素、产业趋势分析及2026年至2035年预测Consumer Electronics High Voltage Electric Capacitor Market Opportunity, Growth Drivers, Industry Trend Analysis, and Forecast 2026 - 2035 |
||||||
全球家用电子电器用高压电容器市场预计到 2025 年将达到 9.3 亿美元,到 2035 年将达到 16 亿美元,年复合成长率为 6%。
这种成长是由现代家用电子电器日益增长的功率需求以及向更高电压电源架构的加速过渡所驱动的。高功率 USB-C 快速充电标准的广泛应用,推动电源设计向更高电压水平发展,同时保持紧凑的尺寸和散热效率。向更先进的 USB Power Delivery 规范的过渡引入了 28V、36V 和 48V 的固定电压轨,以及高达 240W 的可编程功率输出,这对功率级组件提出了更高的性能要求。随着设备製造商将介面整合到 USB-C 平台,安全合规性、全球互通性和一致的电气性能变得越来越重要。这种环境需要可靠、标准化且具有高电气稳定性的高压电容器。小型化趋势,加上电压和电容密度的提高,进一步强化了这项需求。为了提高效率和缩小组件尺寸,电源转换级在更高的开关频率和总线电压下运作。这就需要能够在紧凑的面积内提供高电压额定值、耐热性和稳定介电性能的电容器。
| 市场覆盖范围 | |
|---|---|
| 开始年份 | 2025 |
| 预测年份 | 2026-2035 |
| 起始值 | 9.3亿美元 |
| 预测金额 | 16亿美元 |
| 复合年增长率 | 6% |
预计到 2025 年,非极化电容器市占率将达到 84.7%,到 2035 年将以 5.9% 的复合年增长率成长。介电材料和多层结构的进步不断推动非极化设计的应用,尤其是在家用电子电器的电源电路中,这些电路需要高压能力、可靠性和紧凑的尺寸。
预计到2035年,薄膜电容器市场将以5.9%的复合年增长率成长。由于其使用寿命长、在高电压下效率高,因此在消费性电子应用领域的需求仍然强劲。在产品性能对耐用性、电压稳定性和耐热性要求较高的应用中,薄膜电容器越来越受到青睐。
预计到2025年,美国消费性电子产品用高压电容器市场规模将达6.5亿美元,占市场份额的75%。对更新安全标准的日益重视以及混合能源解决方案的日益普及,持续推动消费电力系统用电容器品质要求的提高。住宅环境中混合逆变器和备用电源解决方案的日益普及,也增强了先进电力电子应用中对高可靠性电容器的需求。
目录
第一章调查方法和范围
第二章执行摘要
第三章业界考察
- 生态系分析
- 监管环境
- 产业影响因素
- 司机
- 产业潜在风险与挑战
- 成长潜力分析
- 波特分析
- 供应商的议价能力
- 买方的议价能力
- 新进入者的威胁
- 替代品的威胁
- PESTEL 分析
- 新的机会与趋势
- 数位化和物联网集成
- 拓展新兴市场
第四章 竞争情势
- 介绍
- 公司市占率分析
- 策略倡议
- 竞争标竿分析
- 战略仪錶板
- 创新与科技趋势
第五章 依极化程度分類的市场规模及预测(2022-2035年)
- 偏振
- 非极化
第六章 依材料分類的市场规模及预测(2022-2035年)
- 薄膜电容器
- 陶瓷电容器
- 电解电容器
- 其他的
第七章 2022-2035年各地区市场规模及预测
- 北美洲
- 我们
- 加拿大
- 墨西哥
- 欧洲
- 英国
- 法国
- 德国
- 义大利
- 奥地利
- 亚太地区
- 中国
- 印度
- 日本
- 澳洲
- 韩国
- 中东和非洲
- 沙乌地阿拉伯
- 南非
- 阿拉伯聯合大公国
- 拉丁美洲
- 巴西
- 阿根廷
- 智利
第八章 公司简介
- ABB
- CapXon International Electronic Co., Ltd.
- Cornell Dubilier Electronics
- ELNA Co., Ltd.
- Havells India Ltd.
- JB电容器
- KEMET Corporation
- KYOCERA AVX Components Corporation
- Murata Manufacturing Co., Ltd.
- Nichicon Corporation
- Panasonic Corporation
- Rubycon Corporation
- Samsung Electro-Mechanics Co., Ltd.
- Schneider Electric
- Siemens
- Taiyo Yuden Co., Ltd.
- TDK Corporation
- Vishay Intertechnology, Inc.
- WIMA GmbH &Co. KG
- Xuansn Electronic
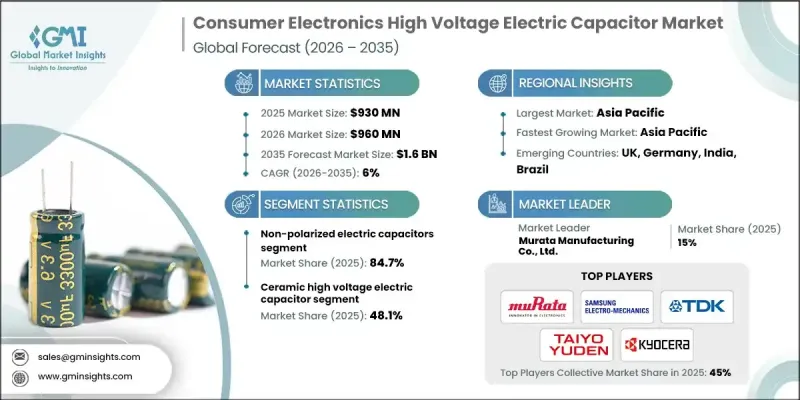
The Global Consumer Electronics High Voltage Electric Capacitor Market was valued at USD 930 million in 2025 and is estimated to grow at a CAGR of 6% to reach USD 1.6 billion by 2035.
Growth is driven by rising power requirements across modern consumer electronics and the accelerating shift toward higher-voltage power architectures. Widespread adoption of higher-wattage USB-C fast-charging standards is pushing power designs toward elevated voltage levels while maintaining compact form factors and thermal efficiency. The transition to advanced USB Power Delivery specifications introduces fixed voltage rails at 28 V, 36 V, and 48 V, along with programmable power delivery up to 240 W, which places greater performance demands on power stage components. As device manufacturers consolidate interfaces around USB-C, emphasis increases on safety compliance, global interoperability, and consistent electrical behavior. This environment favors reliable, standardized high-voltage capacitors with strong electrical stability. Miniaturization trends, coupled with increasing voltage and capacitance density, further strengthen demand. Power conversion stages operate at higher switching frequencies and bus voltages to improve efficiency and reduce component size, requiring capacitors that deliver high voltage ratings, thermal resilience, and stable dielectric performance within compact footprints.
| Market Scope | |
|---|---|
| Start Year | 2025 |
| Forecast Year | 2026-2035 |
| Start Value | $930 Million |
| Forecast Value | $1.6 Billion |
| CAGR | 6% |
The non-polarized electric capacitors segment accounted for 84.7% share in 2025 and is expected to grow at a CAGR of 5.9% through 2035. Advances in dielectric materials and multilayer construction continue to support the adoption of non-polarized designs, particularly where high voltage capability, reliability, and compact size are required in consumer electronics power circuits.
The film capacitors segment is projected to grow at a CAGR of 5.9% through 2035. Demand remains strong in consumer applications that combine long operational life with high efficiency at elevated voltages. These components are increasingly favored where durability, voltage stability, and thermal endurance are critical to product performance.
United States Consumer Electronics High Voltage Electric Capacitor Market held 75% share in 2025 and generated USD 650 million. Rising emphasis on updated safety standards and growing adoption of hybrid energy solutions continue to elevate quality requirements for capacitors used in consumer power systems. Increased deployment of hybrid inverters and backup-ready solutions in residential settings strengthens demand for robust capacitors within advanced power electronics.
Key companies active in the Consumer Electronics High Voltage Electric Capacitor Market include Murata Manufacturing Co., Ltd., TDK Corporation, Panasonic Corporation, KEMET Corporation, Vishay Intertechnology, Inc., Samsung Electro Mechanics Co., Ltd., Nichicon Corporation, Taiyo Yuden Co., Ltd., Rubycon Corporation, ABB, Schneider Electric, Siemens, Cornell Dubilier Electronics, KYOCERA AVX Components Corporation, ELNA Co., Ltd., WIMA GmbH & Co. KG, CapXon International Electronic Co., Ltd., Havells India Ltd., JB Capacitors Company, Xuansn Electronic, and Panasonic Corporation. Companies operating in the Consumer Electronics High Voltage Electric Capacitor Market strengthen their market position through continuous material innovation and capacity expansion. Investment in advanced dielectric technologies enables higher voltage tolerance and improved thermal stability in compact designs. Manufacturers focus on standardization and certification to meet evolving global safety and interoperability requirements. Strategic partnerships with device makers help align product development with next-generation power architectures.
Table of Contents
Chapter 1 Methodology & Scope
- 1.1 Research approach
- 1.2 Quality commitment
- 1.2.1 GMI AI policy & data integrity commitment
- 1.2.1.1 Source consistency protocol
- 1.2.1 GMI AI policy & data integrity commitment
- 1.3 Research Trail & Confidence Scoring
- 1.3.1 Research Trail Components
- 1.3.2 Scoring Components
- 1.4 Data Collection
- 1.4.1 Partial list of primary sources
- 1.5 Data mining sources
- 1.5.1 Paid sources
- 1.5.1.1 Sources, by region
- 1.5.1 Paid sources
- 1.6 Base estimates and calculations
- 1.6.1 Base year calculation for any one approach
- 1.7 Forecast model
- 1.8 Research transparency addendum
- 1.8.1 Source attribution framework
- 1.8.2 Quality assurance metrics
- 1.8.3 Our commitment to trust
- 1.9 Market definitions
Chapter 2 Executive Summary
- 2.1 Industry synopsis, 2022 - 2035
- 2.1.1 Business trends
- 2.1.2 Polarization trends
- 2.1.3 Material trends
- 2.1.4 Regional trends
Chapter 3 Industry Insights
- 3.1 Industry ecosystem analysis
- 3.2 Regulatory landscape
- 3.3 Industry impact forces
- 3.3.1 Growth drivers
- 3.3.2 Industry pitfalls & challenges
- 3.4 Growth potential analysis
- 3.5 Porter';s analysis
- 3.5.1 Bargaining power of suppliers
- 3.5.2 Bargaining power of buyers
- 3.5.3 Threat of new entrants
- 3.5.4 Threat of substitutes
- 3.6 PESTEL analysis
- 3.6.1 Political factors
- 3.6.2 Economic factors
- 3.6.3 Social factors
- 3.6.4 Technology factors
- 3.6.5 environmental factors
- 3.6.6 Legal factors
- 3.7 Emerging opportunities & trends
- 3.7.1 Digitalization and IoT integration
- 3.7.2 Emerging market penetration
Chapter 4 Competitive landscape, 2025
- 4.1 Introduction
- 4.2 Company market share analysis, 2024
- 4.3 Strategic initiatives
- 4.4 Competitive benchmarking
- 4.5 Strategic dashboard
- 4.6 Innovation & technology landscape
Chapter 5 Market Size and Forecast, By Polarization, 2022 - 2035 (USD Million, ‘000 Units)
- 5.1 Key trends
- 5.2 Polarized
- 5.3 Non-polarized
Chapter 6 Market Size and Forecast, By Material, 2022 - 2035 (USD Million, ‘000 Units)
- 6.1 Key trends
- 6.2 Film capacitors
- 6.3 Ceramic capacitors
- 6.4 Electrolytic capacitors
- 6.5 Others
Chapter 7 Market Size and Forecast, By Region, 2022 - 2035 (USD Million, ‘000 Units)
- 7.1 Key trends
- 7.2 North America
- 7.2.1 U.S.
- 7.2.2 Canada
- 7.2.3 Mexico
- 7.3 Europe
- 7.3.1 UK
- 7.3.2 France
- 7.3.3 Germany
- 7.3.4 Italy
- 7.3.5 Austria
- 7.4 Asia Pacific
- 7.4.1 China
- 7.4.2 India
- 7.4.3 Japan
- 7.4.4 Australia
- 7.4.5 South Korea
- 7.5 Middle East & Africa
- 7.5.1 Saudi Arabia
- 7.5.2 South Africa
- 7.5.3 UAE
- 7.6 Latin America
- 7.6.1 Brazil
- 7.6.2 Argentina
- 7.6.3 Chile
Chapter 8 Company Profiles
- 8.1 ABB
- 8.2 CapXon International Electronic Co., Ltd.
- 8.3 Cornell Dubilier Electronics
- 8.4 ELNA Co., Ltd.
- 8.5 Havells India Ltd.
- 8.6 JB Capacitors Company
- 8.7 KEMET Corporation
- 8.8 KYOCERA AVX Components Corporation
- 8.9 Murata Manufacturing Co., Ltd.
- 8.10 Nichicon Corporation
- 8.11 Panasonic Corporation
- 8.12 Rubycon Corporation
- 8.13 Samsung Electro-Mechanics Co., Ltd.
- 8.14 Schneider Electric
- 8.15 Siemens
- 8.16 Taiyo Yuden Co., Ltd.
- 8.17 TDK Corporation
- 8.18 Vishay Intertechnology, Inc.
- 8.19 WIMA GmbH & Co. KG
- 8.20 Xuansn Electronic
 高压电容器市场分析及预测(至2035年):类型、产品、应用、技术、组件、最终用户、材质类型、功能、安装类型
 2026年全球轴向引线电容器市场报告
 全球双电层电容器市场(按类型、电压范围、应用和分销管道划分)预测(2026-2032年)双电层电容器隔膜市场:2026-2032年全球预测(依产品类型、材质、厚度范围及最终用途产业划分)
 全球低压电容器市场全球高压电容器市场
 中压电力电容器市场机会、成长动力、产业趋势分析及2025-2034年预测高压电力电容器市场机会、成长动力、产业趋势分析及2025-2034年预测全球电容器市场输配电容器市场机会、成长动力、产业趋势分析及2025-2034年预测