


 |
市场调查报告书
商品编码
1936504
乘用车数位双胞胎市场机会、成长要素、产业趋势分析及2026年至2035年预测Passenger Car Digital Twin Market Opportunity, Growth Drivers, Industry Trend Analysis, and Forecast 2026 - 2035 |
||||||
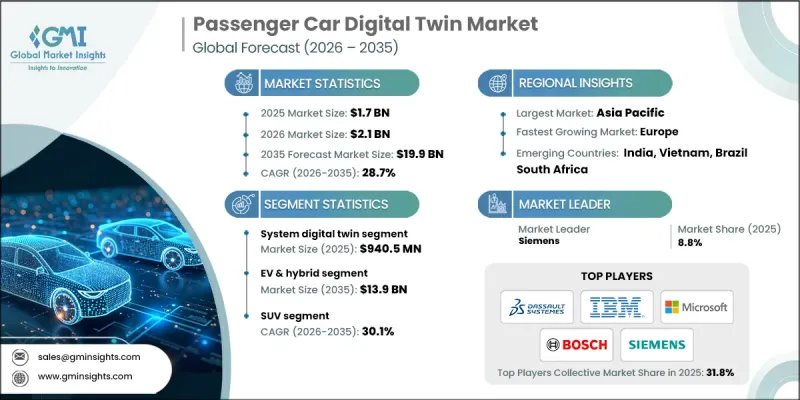
全球乘用车数位双胞胎市场预计到 2025 年价值 17 亿美元,到 2035 年达到 199 亿美元,年复合成长率为 28.7%。
汽车生产需要先进技术来缩短开发週期、减少返工、降低原型成本并防止设备和零件故障。数位双胞胎平台透过在实际生产开始前对整个车辆生命週期进行虚拟检验来满足这些需求。製造商正在利用这些系统,透过即时模拟设计、製造和营运行为,显着改善决策和成本控制。人工智慧 (AI) 和机器学习透过实现早期故障侦测、效能检验和预测性故障分析,进一步提升了数位双胞胎的价值。这些功能使製造商和供应商能够在车辆上市前识别问题。随着向数据驱动製造、互联工厂和软体定义车辆的转变,对数位双胞胎的依赖性持续增长,并成为现代汽车生产策略的核心驱动力。
| 市场覆盖范围 | |
|---|---|
| 开始年份 | 2025 |
| 预测年份 | 2026-2035 |
| 起始值 | 17亿美元 |
| 预测金额 | 199亿美元 |
| 复合年增长率 | 28.7% |
系统级数数位双胞胎市场预计将占据55.2%的市场份额,到2025年将创造约9.405亿美元的收入。此细分市场占据主导地位的原因在于市场对连网车辆系统全面模拟的需求日益增长。系统级数数位双胞胎使製造商能够分析子系统(例如动力传输、安全架构和数位介面)之间复杂的交互作用。这些模型支援即时系统监控和预测性维护,从而在生产和营运阶段提高可靠性并减少停机时间。
预计到2025年,电动和混合动力汽车市场份额将达到64.6%,到2035年市场规模将达到139亿美元。这些车辆整合了先进的电子元件和感测器,能够与数位双胞胎平台无缝协作。数位双胞胎技术使製造商能够模拟电池劣化、热性能、能源效率和软体行为——这些都是电动和混合动力平台的关键要素。这项能力使数位双胞胎成为优化下一代汽车架构的必备工具。
预计到2025年,美国乘用车数位双胞胎市场规模将达到3.482亿美元。随着製造商将数位双胞胎纳入智慧製造倡议,以优化生产线、减少营运中断并应对供应链的复杂性,其应用正在不断增长。製造环境的即时数位副本能够更快地解决问题并持续改进效能。云端平台和互联繫统进一步支援了数位双胞胎在生产和生产后分析的应用。
目录
第一章调查方法
第二章执行摘要
第三章业界考察
- 生态系分析
- 供应商情况
- 利润率
- 成本结构
- 每个阶段的附加价值
- 影响价值链的因素
- 中断
- 产业影响因素
- 司机
- 软体定义车辆(SDV)的日益普及
- 乘用车架构日益复杂化
- 对虚拟原型製作和模拟技术的需求日益增长
- 原始设备製造商 (OEM) 专注于缩短产品上市时间
- 产业潜在风险与挑战
- 较高的初始实施和整合成本
- 网路安全和资料隐私问题
- 市场机会
- 在车辆生命週期的每个阶段引入数位双胞胎技术
- 用于在运作中车辆监控的即时数位双胞胎
- 基于数位双胞胎的按使用量付费(UBI)模型
- 联合开发用于组件检验的数位双胞胎解决方案
- 司机
- 成长潜力分析
- 监管环境
- 北美洲
- 美国国家公路交通安全管理局(NHTSA)
- FMVSS(联邦机动车辆安全标准)
- 美国环保署(EPA)
- 加拿大机动车辆安全标准(运输部)
- 欧洲
- 欧盟委员会(EC)
- 联合国欧洲经济委员会(UNECE)
- 一般资料保护规则(GDPR)
- 亚太地区
- 日本汽车标准国际化中心(JASIC)
- 中国汽车工程师学会(SAE China)
- KATS(韩国汽车科技研究院)
- AIS(汽车产业标准)
- 拉丁美洲
- 全国汽车製造商协会
- 国家计量与工业研究院(INMETRO)
- 拉丁美洲的车辆安全法规
- 中东和非洲
- 海湾合作委员会标准组织(GSO)
- 南非标准局 (SABS)
- 沙乌地阿拉伯标准、计量和品质组织(SASO)
- 北美洲
- 波特五力分析
- PESTEL 分析
- 科技与创新趋势
- 当前技术趋势
- 新兴技术
- 成本細項分析
- 永续性和环境影响
- 环境影响评估
- 社会影响和社区效益
- 公司管治与企业社会责任
- 永续金融与投资趋势
- 数位双胞胎资料架构
- 即时资料流架构
- 感测器数据管理和处理
- 数据品质与管治框架
- 互通性和资料交换通讯协定
- 网路安全和隐私框架
- 数位双胞胎网路安全威胁情势
- 资料加密和存取控制机制
- 实施零信任架构
- 隐私保护技术
- 合规框架
- 案例研究
- 未来前景与机会
第四章 竞争情势
- 介绍
- 公司市占率分析
- 北美洲
- 欧洲
- 亚太地区
- 拉丁美洲
- 中东和非洲
- 主要市场公司的竞争分析
- 竞争定位矩阵
- 战略展望矩阵
- 重大进展
- 併购
- 伙伴关係与合作
- 新产品发布
- 企业扩张计画和资金筹措
第五章 按组件分類的市场估算与预测,2022-2035年
- 硬体
- 物联网感测器和设备
- 边缘运算硬体
- 数据采集系统
- 连接基础设施
- 软体
- 服务
- 专业服务
- 系统整合
- 培训和咨询
- 支援与维护
- 託管服务
- 专业服务
第六章数位双胞胎市场估算与预测,2022-2035年
- 系统数位双胞胎
- 产品数位双胞胎
- 流程数位双胞胎
第七章 依实施类型分類的市场估计与预测,2022-2035年
- 基于云端的
- 本地部署
- 杂交种
第八章 按车辆类型分類的市场估算与预测,2022-2035年
- 掀背车
- 轿车
- SUV
9. 2022-2035年按推进方式分類的市场估计与预测
- 内燃机(ICE)
- 电动车和混合动力汽车
- 电池式电动车(BEV)
- 插电式混合动力电动车(PHEV)
- 混合动力电动车(HEV)
- 燃料电池电动车(FCEV)
第十章 依应用领域分類的市场估计与预测,2022-2035年
- 产品设计与开发
- 预测性维护和效能监控
- 製造和製程优化
- 运作中营运和车队管理
第十一章 依最终用途分類的市场估计与预测,2022-2035年
- OEM
- 一级和二级供应商
- 汽车软体和技术公司
- 行动服务供应商
- 保险公司
- 售后市场及服务中心
第十二章 2022-2035年各地区市场估算与预测
- 北美洲
- 我们
- 加拿大
- 欧洲
- 德国
- 英国
- 法国
- 义大利
- 西班牙
- 俄罗斯
- 捷克共和国
- 比利时
- 荷兰
- 亚太地区
- 中国
- 印度
- 日本
- 韩国
- 澳洲
- 新加坡
- 马来西亚
- 印尼
- 越南
- 泰国
- 拉丁美洲
- 巴西
- 墨西哥
- 阿根廷
- 哥伦比亚
- 中东和非洲
- 南非
- 沙乌地阿拉伯
- 阿拉伯聯合大公国
第十三章:公司简介
- 世界公司
- ANSYS
- Autodesk
- Dassault
- GE Vernova
- Hexagon
- IBM
- Microsoft
- NVIDIA
- PTC
- Robert Bosch
- SAP
- Siemens
- 当地公司
- ABB
- AVEVA
- Emerson
- Honeywell
- Oracle
- Rockwell
- Schneider
- TCS
- 新兴企业
- Amazon Web Services
- Lauterbach
- Toobler
- Unity
- Valeo
The Global Passenger Car Digital Twin Market was valued at USD 1.7 billion in 2025 and is estimated to grow at a CAGR of 28.7% to reach USD 19.9 billion by 2035.
Automotive production demands advanced technologies that reduce development cycles, minimize rework, lower prototype costs, and prevent equipment or component failures. Digital twin platforms address these needs by enabling virtual validation across the vehicle lifecycle before physical production begins. Manufacturers rely on these systems to simulate design, manufacturing, and operational behavior in real time, significantly improving decision-making and cost control. Artificial intelligence and machine learning further enhance digital twin value by enabling early fault detection, performance validation, and predictive failure analysis. These capabilities allow manufacturers and suppliers to identify issues before vehicles reach the market. The shift toward data-driven manufacturing, connected factories, and software-defined vehicles continues to increase reliance on digital twins as a core enabler of modern automotive production strategies.
| Market Scope | |
|---|---|
| Start Year | 2025 |
| Forecast Year | 2026-2035 |
| Start Value | $1.7 Billion |
| Forecast Value | $19.9 Billion |
| CAGR | 28.7% |
The system-level digital twins segment held a 55.2% share in 2025, generating approximately USD 940.5 million. This segment dominates due to the rising demand for holistic simulation of interconnected vehicle systems. System digital twins allow manufacturers to analyze complex interactions between subsystems such as power delivery, safety architecture, and digital interfaces. These models support real-time system monitoring and predictive maintenance, improving reliability and reducing downtime across production and operational stages.
The electric and hybrid vehicles segment held 64.6% share in 2025 and is projected to reach USD 13.9 billion by 2035. These vehicles integrate advanced electronic components and sensors that connect seamlessly with digital twin platforms. Digital twins help manufacturers simulate battery aging, thermal performance, power efficiency, and software behavior, which are critical factors for electric and hybrid platforms. This capability positions digital twins as essential tools for optimizing next-generation vehicle architectures.
United States Passenger Car Digital Twin Market reached USD 348.2 million in 2025. Adoption grows as manufacturers deploy digital twins within smart manufacturing initiatives to optimize production lines, reduce operational disruptions, and address supply chain complexity. Real-time digital replicas of manufacturing environments enable faster issue resolution and continuous performance improvement. Cloud-based platforms and connected systems further support digital twin adoption across production and post-production analytics.
Key companies active in the Global Passenger Car Digital Twin Market include Siemens, NVIDIA, SAP, Dassault, PTC, Microsoft, ANSYS, IBM, GE Vernova, and Robert Bosch. Companies in the passenger car digital twin market strengthen their competitive position by investing in AI-driven simulation, cloud-native platforms, and scalable digital engineering solutions. Many focus on integrating digital twins across design, manufacturing, and after-sales operations to deliver end-to-end lifecycle value. Strategic partnerships with automakers and suppliers accelerate platform adoption and customization. Continuous innovation in predictive analytics, real-time monitoring, and system interoperability enhances differentiation. Vendors emphasize compatibility with connected factory infrastructure and vehicle software ecosystems.
Table of Contents
Chapter 1 Methodology
- 1.1 Research approach
- 1.2 Quality commitments
- 1.2.1 GMI AI policy & data integrity commitment
- 1.3 Research trail & confidence scoring
- 1.3.1 Research trail components
- 1.3.2 Scoring components
- 1.4 Data collection
- 1.4.1 Partial list of primary sources
- 1.5 Data mining sources
- 1.5.1 Paid sources
- 1.6 Base estimates and calculations
- 1.6.1 Base year calculation
- 1.7 Forecast model
- 1.8 Research transparency addendum
Chapter 2 Executive Summary
- 2.1 Industry 360° synopsis
- 2.2 Key market trends
- 2.2.1 Regional
- 2.2.2 Component
- 2.2.3 Digital Twin
- 2.2.4 Deployment Mode
- 2.2.5 Vehicle
- 2.2.6 Propulsion
- 2.2.7 Application
- 2.2.8 End-Use
- 2.3 TAM analysis, 2026-2035
- 2.4 CXO perspectives: Strategic imperatives
- 2.4.1 Executive decision points
- 2.4.2 Critical success factors
- 2.5 Future outlook and recommendations
Chapter 3 Industry Insights
- 3.1 Industry ecosystem analysis
- 3.1.1 Supplier landscape
- 3.1.2 Profit margin
- 3.1.3 Cost structure
- 3.1.4 Value addition at each stage
- 3.1.5 Factor affecting the value chain
- 3.1.6 Disruptions
- 3.2 Industry impact forces
- 3.2.1 Growth drivers
- 3.2.1.1 Rising adoption of software-defined vehicles (SDVs)
- 3.2.1.2 Increasing complexity of passenger car architectures
- 3.2.1.3 Growing demand for virtual prototyping and simulation
- 3.2.1.4 OEM focus on reducing time-to-market
- 3.2.2 Industry pitfalls and challenges
- 3.2.2.1 High initial implementation and integration costs
- 3.2.2.2 Cybersecurity and data privacy concerns
- 3.2.3 Market opportunities
- 3.2.3.1 Digital twin deployment across vehicle lifecycle phases
- 3.2.3.2 Real-time digital twins for in-use vehicle monitoring
- 3.2.3.3 Usage-based insurance (UBI) models enhanced by digital twins
- 3.2.3.4 Co-development of digital twin solutions for component validations
- 3.2.1 Growth drivers
- 3.3 Growth potential analysis
- 3.4 Regulatory landscape
- 3.4.1 North America
- 3.4.1.1 National Highway Traffic Safety Administration (NHTSA)
- 3.4.1.2 FMVSS (Federal Motor Vehicle Safety Standards)
- 3.4.1.3 EPA (Environmental Protection Agency)
- 3.4.1.4 Canadian Motor Vehicle Safety Standards (Transport Canada)
- 3.4.2 Europe
- 3.4.2.1 European Commission (EC)
- 3.4.2.2 UNECE (United Nations Economic Commission for Europe)
- 3.4.2.3 EU General Data Protection Regulation (GDPR)
- 3.4.3 Asia Pacific
- 3.4.3.1 JASIC (Japan Automobile Standards Internationalization Center)
- 3.4.3.2 SAE China (Society of Automotive Engineers of China)
- 3.4.3.3 KATS (Korea Automotive Technology Institute)
- 3.4.3.4 AIS (Automotive Industry Standard)
- 3.4.4 Latin America
- 3.4.4.1 Associacao Nacional dos Fabricantes de Veiculos Automotores
- 3.4.4.2 National Institute of Metrology, Standardization and Industrial Standards (INMETRO)
- 3.4.4.3 LATAM Vehicle Safety Regulations
- 3.4.5 Middle East & Africa
- 3.4.5.1 GCC Standardization Organization (GSO)
- 3.4.5.2 South African Bureau of Standards (SABS)
- 3.4.5.3 Saudi Standards, Metrology and Quality Organization (SASO)
- 3.4.1 North America
- 3.5 Porter's analysis
- 3.6 PESTEL analysis
- 3.7 Technology and innovation landscape
- 3.7.1 Current technological trends
- 3.7.2 Emerging technologies
- 3.8 Cost breakdown analysis
- 3.9 Sustainability and environmental impact
- 3.9.1 Environmental impact assessment
- 3.9.2 Social impact & community benefits
- 3.9.3 Governance & corporate responsibility
- 3.9.4 Sustainable finance & investment trends
- 3.10 Data architecture for digital twins
- 3.10.1 Real-time data streaming architecture
- 3.10.2 Sensor data management & processing
- 3.10.3 Data quality & governance frameworks
- 3.10.4 Interoperability & data exchange protocols
- 3.11 Cybersecurity & privacy frameworks
- 3.11.1 Cybersecurity threat landscape for digital twins
- 3.11.2 Data encryption & access control mechanisms
- 3.11.3 Zero trust architecture implementation
- 3.11.4 Privacy-preserving technologies
- 3.11.5 Compliance frameworks
- 3.12 Case studies
- 3.13 Future outlook & opportunities
Chapter 4 Competitive Landscape, 2025
- 4.1 Introduction
- 4.2 Company market share analysis
- 4.2.1 North America
- 4.2.2 Europe
- 4.2.3 Asia Pacific
- 4.2.4 LATAM
- 4.2.5 MEA
- 4.3 Competitive analysis of major market players
- 4.4 Competitive positioning matrix
- 4.5 Strategic outlook matrix
- 4.6 Key developments
- 4.6.1 Mergers & acquisitions
- 4.6.2 Partnerships & collaborations
- 4.6.3 New product launches
- 4.6.4 Expansion plans and funding
Chapter 5 Market Estimates & Forecast, By Component, 2022 - 2035 ($Bn)
- 5.1 Key trends
- 5.2 Hardware
- 5.2.1 IoT sensors & devices
- 5.2.2 Edge computing hardware
- 5.2.3 Data acquisition systems
- 5.2.4 Connectivity infrastructure
- 5.3 Software
- 5.4 Services
- 5.4.1 Professional services
- 5.4.1.1 System integration
- 5.4.1.2 Training & consulting
- 5.4.1.3 Support & maintenance
- 5.4.2 Managed services
- 5.4.1 Professional services
Chapter 6 Market Estimates & Forecast, By Digital Twin, 2022 - 2035 ($Bn)
- 6.1 Key trends
- 6.2 System digital twin
- 6.3 Product digital twin
- 6.4 Process digital twin
Chapter 7 Market Estimates & Forecast, By Deployment Mode, 2022 - 2035 ($Bn)
- 7.1 Key trends
- 7.2 Cloud-based
- 7.3 On-premises
- 7.4 Hybrid
Chapter 8 Market Estimates & Forecast, By Vehicle, 2022 - 2035 ($Bn)
- 8.1 Key trends
- 8.2 Hatchback
- 8.3 Sedan
- 8.4 SUV
Chapter 9 Market Estimates & Forecast, By Propulsion, 2022 - 2035 ($Bn)
- 9.1 Key trends
- 9.2 Internal Combustion Engine (ICE)
- 9.3 EV & Hybrid
- 9.3.1 Battery electric vehicle (BEV)
- 9.3.2 Plug-in hybrid electric vehicle (PHEV)
- 9.3.3 Hybrid electric vehicle (HEV)
- 9.3.4 Fuel cell electric vehicle (FCEV)
Chapter 10 Market Estimates & Forecast, By Application, 2022 - 2035 ($Bn)
- 10.1 Key trends
- 10.2 Product design & development
- 10.3 Predictive maintenance & performance monitoring
- 10.4 Manufacturing & process optimization
- 10.5 In-service operations & fleet management
Chapter 11 Market Estimates & Forecast, By End Use, 2022 - 2035 ($Bn)
- 11.1 Key trends
- 11.2 Original equipment manufacturers
- 11.3 Tier 1 & Tier 2 Suppliers
- 11.4 Automotive software & technology companies
- 11.5 Mobility service providers
- 11.6 Insurance companies
- 11.7 Aftermarket & service centers
Chapter 12 Market Estimates & Forecast, By Region, 2022 - 2035 ($Bn)
- 12.1 Key trends
- 12.2 North America
- 12.2.1 US
- 12.2.2 Canada
- 12.3 Europe
- 12.3.1 Germany
- 12.3.2 UK
- 12.3.3 France
- 12.3.4 Italy
- 12.3.5 Spain
- 12.3.6 Russia
- 12.3.7 Czech Republic
- 12.3.8 Belgium
- 12.3.9 Netherlands
- 12.4 Asia Pacific
- 12.4.1 China
- 12.4.2 India
- 12.4.3 Japan
- 12.4.4 South Korea
- 12.4.5 Australia
- 12.4.6 Singapore
- 12.4.7 Malaysia
- 12.4.8 Indonesia
- 12.4.9 Vietnam
- 12.4.10 Thailand
- 12.5 Latin America
- 12.5.1 Brazil
- 12.5.2 Mexico
- 12.5.3 Argentina
- 12.5.4 Colombia
- 12.6 MEA
- 12.6.1 South Africa
- 12.6.2 Saudi Arabia
- 12.6.3 UAE
Chapter 13 Company Profiles
- 13.1 Global companies
- 13.1.1 ANSYS
- 13.1.2 Autodesk
- 13.1.3 Dassault
- 13.1.4 GE Vernova
- 13.1.5 Hexagon
- 13.1.6 IBM
- 13.1.7 Microsoft
- 13.1.8 NVIDIA
- 13.1.9 PTC
- 13.1.10 Robert Bosch
- 13.1.11 SAP
- 13.1.12 Siemens
- 13.2 Regional companies
- 13.2.1 ABB
- 13.2.2 AVEVA
- 13.2.3 Emerson
- 13.2.4 Honeywell
- 13.2.5 Oracle
- 13.2.6 Rockwell
- 13.2.7 Schneider
- 13.2.8 TCS
- 13.3 Emerging companies
- 13.3.1 Amazon Web Services
- 13.3.2 Lauterbach
- 13.3.3 Toobler
- 13.3.4 Unity
- 13.3.5 Valeo
 洪水灾后重建市场:依服务类型、灾害原因、重建服务、最终用户和通路-2026-2032年全球预测电破碎平台市场:按类型、压力等级、最终用户和应用划分,全球预测,2026-2032年
 全球生态系修復服务市场规模、份额、趋势和成长分析报告(2026-2034年)
 汽车数位孪生市场-全球产业规模、份额、趋势、机会及预测(依车辆类型、零件类型、最终用户产业、地区及竞争格局划分,2021-2031年预测)
 汽车数位孪生硬体市场机会、成长驱动因素、产业趋势分析及预测(2025-2034年)
 2025年数位双胞胎血库物流全球市场报告电动车平台市场-全球产业规模、份额、趋势、机会和预测,按车辆类型、推进类型、组件、地区和竞争细分,2020-2030 年汽车市场的数位孪生机会、成长动力、产业趋势分析及 2025 - 2034 年预测
 全球物流数位双胞胎市场全球汽车数位双胞胎市场