


 |
市场调查报告书
商品编码
1936597
电子货架标籤市场机会、成长要素、产业趋势分析及2026年至2035年预测Electronic Shelf Label Market Opportunity, Growth Drivers, Industry Trend Analysis, and Forecast 2026 - 2035 |
||||||
全球电子货架标籤市场预计到 2025 年将达到 22 亿美元,到 2035 年将达到 74 亿美元,年复合成长率为 12.7%。
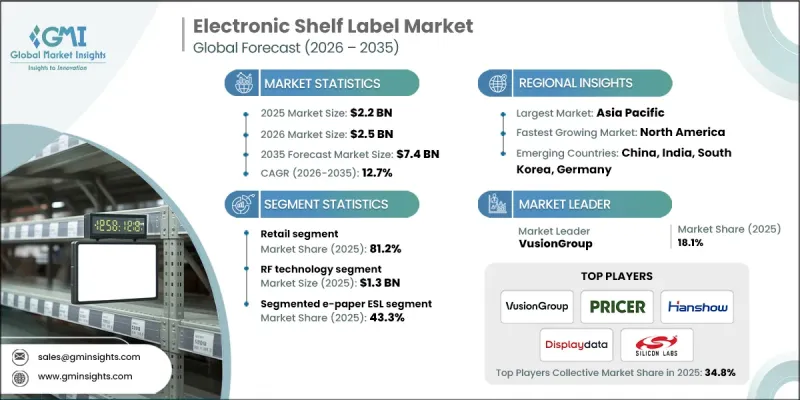
市场成长的关键驱动因素包括零售自动化需求的不断成长、受电商竞争推动的动态定价策略的日益普及,以及消费者对精准透明定价的期望不断提高。物联网赋能的电子定价系统(ESL)使零售商能够将定价与门市营运、库存管理系统和供应链无缝整合,提供即时更新、自动提醒并提升营运视觉。零售商正越来越多地将ESL与分析平台集成,以优化其定价策略。基于人工智慧的解决方案透过分析销售速度、消费行为模式和需求趋势来提高定价准确性,从而帮助零售商做出明智的决策,并在多个管道中实现盈利最大化。
| 市场覆盖范围 | |
|---|---|
| 开始年份 | 2025 |
| 预测年份 | 2026-2035 |
| 起始值 | 22亿美元 |
| 预测金额 | 74亿美元 |
| 复合年增长率 | 12.7% |
受零售商对卓越视觉化功能的需求驱动,全图形电子纸广告看板市场预计到2035年将以16.5%的复合年增长率成长。与传统广告看板不同,全图形电子纸显示器支援图像、版面、字体以及除简单价格显示之外的丰富内容。零售商可以展示产品图片、营养资讯、过敏原警告、详细资讯图片、QR码等,进而提升购物体验和客户参与。这使得全图形电子纸广告看板在超级市场、专卖店和高端零售环境中特别具有吸引力,因为在这些场所,视觉商品行销和品牌讯息至关重要。
由于其技术优势,射频技术领域预计2025年市场规模将达13亿美元。射频讯号覆盖范围广,支援集中式基地台的部署,即使在复杂的零售环境中也能确保稳定运作。射频技术因其即使在金属货架、库存或繁忙客流等干扰下也能保持可靠运行,而备受大型零售企业的青睐。其稳健性和适应性使其在电子标籤(ESL)应用市场,尤其是在高客流量零售连锁店和大卖场中,巩固了主导地位。
预计到2025年,北美电子货架标籤市占率将达到31%。该地区的成长主要得益于零售自动化、动态定价解决方案以及提升消费者互动体验的强劲需求。零售商正在超级市场、大卖场和专卖店等场所推广电子货架标籤系统,以降低人事费用、提高定价准确性并简化库存管理。政府和私人企业正在投资物联网连接、云端管理的电子货架标籤平台,这些平台能够实现即时价格更新、确保跨门市价格一致性并利用数据驱动的洞察。美国仍然是核心市场,凭藉其先进的零售技术基础设施和鼓励数位化定价系统的法规环境,保持较高的采用率。
目录
第一章调查方法和范围
第二章执行摘要
第三章业界考察
- 生态系分析
- 供应商情况
- 利润率
- 成本结构
- 每个阶段的附加价值
- 影响价值链的因素
- 中断
- 产业影响因素
- 司机
- 随着零售自动化技术的进步,即时价格更新的速度正在加快。
- 电子商务领域的竞争正在推动动态定价的普及。
- 增强 ESL 系统与物联网连接的集成
- 节能型显示器可显着降低营运成本。
- 消费者对准确定价的偏好推动了产品的采用。
- 产业潜在风险与挑战
- 高昂的初始成本限制了其广泛应用。
- 与现有商店系统整合方面存在问题
- 市场机会
- 人工智慧定价助力零售业实现智慧决策
- 新兴市场为英语作为第二语言教学法的快速普及提供了潜力。
- 司机
- 成长潜力分析
- 监管环境
- 北美洲
- 欧洲
- 亚太地区
- 拉丁美洲
- 中东和非洲
- 波特五力分析
- PESTEL 分析
- 科技与创新趋势
- 当前技术趋势
- 新兴技术
- 价格趋势
- 按地区
- 副产品
- 定价策略
- 新兴经营模式
- 合规要求
- 专利和智慧财产权分析
- 地缘政治和贸易趋势
第四章 竞争情势
- 介绍
- 公司市占率分析
- 按地区
- 北美洲
- 欧洲
- 亚太地区
- 拉丁美洲
- 中东和非洲
- 市场集中度分析
- 按地区
- 主要企业的竞争标竿分析
- 财务绩效比较
- 收入
- 利润率
- 研究与开发
- 产品系列比较
- 产品线的广度
- 科技
- 创新
- 地理分布比较
- 全球扩张分析
- 服务网路覆盖
- 按地区分類的市场渗透率
- 竞争定位矩阵
- 领导企业
- 受让人
- 追踪者
- 小众玩家
- 战略展望矩阵
- 财务绩效比较
- 重大进展
- 併购
- 伙伴关係与合作
- 技术进步
- 扩张与投资策略
- 数位转型计划
- 新兴/Start-Ups竞赛的趋势
第五章 依产品类型分類的市场估算与预测,2022-2035年
- LCD ESL
- 段式电子纸显示设备
- 全图形电子纸电子货架标籤
第六章 依显示器尺寸分類的市场估算与预测,2022-2035年
- 小号(≤2吋)
- 中等大小(2-5吋)
- 大号(超过 5 英吋)
第七章 按技术分類的市场估计与预测,2022-2035年
- 射频(RF)
- 红外线 (IR)
- 近距离场通讯(NFC)
- Bluetooth
- 其他的
第八章 按应用领域分類的市场估算与预测,2022-2035年
- 零售
- 超级市场/大卖场
- 便利商店/零售连锁店
- 电子产品量贩店
- 药局
- 其他的
- 工业的
- 工业设施
- 仓库
- 配销中心
- 其他的
- 其他的
第九章 2022-2035年各地区市场估算与预测
- 北美洲
- 我们
- 加拿大
- 欧洲
- 德国
- 英国
- 法国
- 西班牙
- 义大利
- 亚太地区
- 中国
- 印度
- 日本
- 澳洲
- 韩国
- 拉丁美洲
- 巴西
- 墨西哥
- 阿根廷
- 中东和非洲
- 南非
- 沙乌地阿拉伯
- 阿拉伯聯合大公国
第十章:公司简介
- 主要企业
- Delfi Technologies A/S
- Panasonic Connect Co., Ltd.
- Pricer
- Silicon Laboratories
- 按地区分類的主要企业
- 北美洲
- ComQi
- Infotek Software &Systems(P)Ltd.
- VusionGroup
- 亚太地区
- Hangzhou Zkong Networks Co., Ltd.
- Shanghai SUNMI Technology Co., Ltd.
- SOLUM
- Minewtag
- 欧洲
- Displaydata Ltd
- Hanshow Technology
- Teraoka(Pty)Ltd
- 北美洲
- 小众玩家/颠覆者
- M2COMM
- Opticon
- Sen Security Solutions
- Ynvisible Interactive Inc.
The Global Electronic Shelf Label Market was valued at USD 2.2 billion in 2025 and is estimated to grow at a CAGR of 12.7% to reach USD 7.4 billion by 2035.
Market expansion is driven by the growing demand for retail automation, the rising adoption of dynamic pricing strategies fueled by e-commerce competition, and consumers' increasing expectations for accurate, transparent pricing. IoT-enabled ESLs allow retailers to seamlessly integrate pricing with store operations, inventory systems, and supply chains, enabling real-time updates, automated alerts, and improved operational visibility. Retailers are increasingly combining ESLs with analytics platforms to enhance pricing strategies. AI-based solutions improve price accuracy by analyzing sales velocity, consumer behavior patterns, and demand trends, empowering retailers to make informed decisions and optimize profitability across multiple channels.
| Market Scope | |
|---|---|
| Start Year | 2025 |
| Forecast Year | 2026-2035 |
| Start Value | $2.2 Billion |
| Forecast Value | $7.4 Billion |
| CAGR | 12.7% |
The full-graphic e-paper ESL segment is forecasted to grow at a CAGR of 16.5% through 2035, driven by retailers' desire for superior visualization capabilities. Unlike conventional ESLs, full-graphic e-paper displays support images, layouts, fonts, and rich content beyond simple price tags. Retailers can now showcase product images, nutritional information, allergen warnings, promotional graphics, and QR codes for additional details, enhancing the overall shopping experience and customer engagement. This feature makes full-graphic ESLs particularly appealing for supermarkets, specialty stores, and high-end retail environments, where visual merchandising and brand messaging are critical.
The RF technology segment reached USD 1.3 billion in 2025, due to its technical advantages. RF signals provide extensive coverage and allow the deployment of centralized base stations, ensuring consistent operation even in challenging retail environments. RF technology performs reliably despite interference from metal shelving, inventory, or heavy customer traffic, making it the preferred choice for large-scale retail operations. Its robustness and adaptability have reinforced its market leadership in ESL applications, particularly in high-volume retail chains and hypermarkets.
North America Electronic Shelf Label Market held 31% share in 2025. Growth in this region is fueled by strong demand for retail automation, dynamic pricing solutions, and improved consumer engagement. Retailers are increasingly deploying ESL systems to reduce labor costs, enhance pricing accuracy, and simplify inventory management across supermarkets, hypermarkets, and specialty outlets. Governments and private enterprises are investing in IoT-connected, cloud-managed ESL platforms to enable real-time price updates, ensure consistent pricing across multiple locations, and leverage data-driven insights. The U.S. remains the core market, with high adoption rates driven by advanced retail technology infrastructure and regulatory encouragement of digital pricing systems.
Key players active in the Global Electronic Shelf Label Market include Delfi Technologies A/S, Displaydata Ltd, Hangzhou Zkong Networks Co., Ltd., Hanshow Technology, Infotek Software & Systems (P) Ltd., M2COMM, Minewtag, Opticon, Panasonic Connect Co., Ltd., Pricer, Sen Security Solutions, Shanghai SUNMI Technology Co., Ltd., Silicon Laboratories, SOLUM, Teraoka (Pty) Ltd, VusionGroup, Ynvisible Interactive Inc., and ComQi. Companies in the Electronic Shelf Label Market are implementing a combination of strategic approaches to strengthen their market presence and expand their foothold. These include investing heavily in R&D to improve display technology, battery life, and IoT connectivity, as well as developing AI-integrated software for dynamic pricing and real-time analytics. Firms are forging strategic partnerships with retail chains, distributors, and technology providers to broaden distribution and integration capabilities. Expanding into emerging markets and customizing products for local regulatory and consumer requirements allows companies to capture untapped growth opportunities.
Table of Contents
Chapter 1 Methodology and Scope
- 1.1 Market scope and definition
- 1.2 Research design
- 1.2.1 Research approach
- 1.2.2 Data collection methods
- 1.3 Data mining sources
- 1.3.1 Global
- 1.3.2 Regional/Country
- 1.4 Base estimates and calculations
- 1.4.1 Base year calculation
- 1.4.2 Key trends for market estimation
- 1.5 Primary research and validation
- 1.5.1 Primary sources
- 1.6 Forecast model
- 1.7 Research assumptions and limitations
Chapter 2 Executive Summary
- 2.1 Industry 3600 synopsis, 2022 - 2035
- 2.2 Key market trends
- 2.2.1 Product type trends
- 2.2.2 Display size trends
- 2.2.3 Technology trends
- 2.2.4 Application trends
- 2.2.5 Regional trends
- 2.3 TAM Analysis, 2026-2035
- 2.4 CXO perspectives: Strategic imperatives
- 2.4.1 Executive decision points
- 2.4.2 critical success factors
- 2.5 Future outlook and strategic recommendations
Chapter 3 Industry Insights
- 3.1 Industry ecosystem analysis
- 3.1.1 Supplier Landscape
- 3.1.2 Profit Margin
- 3.1.3 Cost structure
- 3.1.4 Value addition at each stage
- 3.1.5 Factor affecting the value chain
- 3.1.6 Disruptions
- 3.2 Industry impact forces
- 3.2.1 Growth drivers
- 3.2.1.1 Rising retail automation increases real-time pricing updates
- 3.2.1.2 E-commerce competition drives dynamic pricing adoption
- 3.2.1.3 IoT connectivity enhances ESL system integration
- 3.2.1.4 Energy-efficient displays reduce operational costs significantly
- 3.2.1.5 Consumer preference for accurate pricing encourages adoption
- 3.2.2 Industry pitfalls and challenges
- 3.2.2.1 High initial deployment costs limit adoption
- 3.2.2.2 Integration issues with legacy store systems
- 3.2.3 Market opportunities
- 3.2.3.1 AI-driven pricing enables intelligent retail decision-making
- 3.2.3.2 Emerging markets offer rapid ESL adoption potential
- 3.2.1 Growth drivers
- 3.3 Growth potential analysis
- 3.4 Regulatory landscape
- 3.4.1 North America
- 3.4.2 Europe
- 3.4.3 Asia Pacific
- 3.4.4 Latin America
- 3.4.5 Middle East & Africa
- 3.5 Porter's analysis
- 3.6 PESTEL analysis
- 3.7 Technology and Innovation landscape
- 3.7.1 Current technological trends
- 3.7.2 Emerging technologies
- 3.8 Price trends
- 3.8.1 By region
- 3.8.2 By product
- 3.9 Pricing Strategies
- 3.10 Emerging Business Models
- 3.11 Compliance Requirements
- 3.12 Patent and IP analysis
- 3.13 Geopolitical and trade dynamics
Chapter 4 Competitive Landscape, 2025
- 4.1 Introduction
- 4.2 Company market share analysis
- 4.2.1 By region
- 4.2.1.1 North America
- 4.2.1.2 Europe
- 4.2.1.3 Asia Pacific
- 4.2.1.4 Latin America
- 4.2.1.5 Middle East & Africa
- 4.2.2 Market concentration analysis
- 4.2.1 By region
- 4.3 Competitive benchmarking of key players
- 4.3.1 Financial performance comparison
- 4.3.1.1 Revenue
- 4.3.1.2 Profit margin
- 4.3.1.3 R&D
- 4.3.2 Product portfolio comparison
- 4.3.2.1 Product range breadth
- 4.3.2.2 Technology
- 4.3.2.3 Innovation
- 4.3.3 Geographic presence comparison
- 4.3.3.1 Global footprint analysis
- 4.3.3.2 Service network coverage
- 4.3.3.3 Market penetration by region
- 4.3.4 Competitive positioning matrix
- 4.3.4.1 Leaders
- 4.3.4.2 Challengers
- 4.3.4.3 Followers
- 4.3.4.4 Niche players
- 4.3.5 Strategic outlook matrix
- 4.3.1 Financial performance comparison
- 4.4 Key developments
- 4.4.1 Mergers and acquisitions
- 4.4.2 Partnerships and collaborations
- 4.4.3 Technological advancements
- 4.4.4 Expansion and investment strategies
- 4.4.5 Digital transformation initiatives
- 4.5 Emerging/ startup competitors landscape
Chapter 5 Market Estimates and Forecast, By Product Type, 2022 - 2035 (USD Million & Units)
- 5.1 Key trends
- 5.2 LCD ESL
- 5.3 Segmented E-paper ESL
- 5.4 Full-graphic E-paper ESL
Chapter 6 Market Estimates and Forecast, By Display Size, 2022 - 2035 (USD Million & Units)
- 6.1 Key trends
- 6.2 Small (≤2 inches)
- 6.3 Medium (2-5 inches)
- 6.4 Large (>5 inches)
Chapter 7 Market Estimates and Forecast, By Technology, 2022 - 2035 (USD Million & Units)
- 7.1 Key trends
- 7.2 Radio frequency (RF)
- 7.3 Infrared (IR)
- 7.4 Near field communication (NFC)
- 7.5 Bluetooth
- 7.6 Others
Chapter 8 Market Estimates and Forecast, By Application, 2022 - 2035 (USD Million & Units)
- 8.1 Key trends
- 8.2 Retail
- 8.2.1 Supermarkets / hypermarkets
- 8.2.2 Convenience stores / retail chains
- 8.2.3 Electronics & appliance stores
- 8.2.4 Pharmacies
- 8.2.5 Others
- 8.3 Industrial
- 8.3.1 Industrial facilities
- 8.3.2 Warehouses
- 8.3.3 Distribution centers
- 8.3.4 Others
- 8.4 Others
Chapter 9 Market Estimates and Forecast, By Region, 2022 - 2035 (USD Million & Units)
- 9.1 Key trends
- 9.2 North America
- 9.2.1 U.S.
- 9.2.2 Canada
- 9.3 Europe
- 9.3.1 Germany
- 9.3.2 UK
- 9.3.3 France
- 9.3.4 Spain
- 9.3.5 Italy
- 9.4 Asia Pacific
- 9.4.1 China
- 9.4.2 India
- 9.4.3 Japan
- 9.4.4 Australia
- 9.4.5 South Korea
- 9.5 Latin America
- 9.5.1 Brazil
- 9.5.2 Mexico
- 9.5.3 Argentina
- 9.6 Middle East and Africa
- 9.6.1 South Africa
- 9.6.2 Saudi Arabia
- 9.6.3 UAE
Chapter 10 Company Profiles
- 10.1 Global Key Players
- 10.1.1 Delfi Technologies A/S
- 10.1.2 Panasonic Connect Co., Ltd.
- 10.1.3 Pricer
- 10.1.4 Silicon Laboratories
- 10.2 Regional key players
- 10.2.1 North America
- 10.2.1.1 ComQi
- 10.2.1.2 Infotek Software & Systems (P) Ltd.
- 10.2.1.3 VusionGroup
- 10.2.2 Asia Pacific
- 10.2.2.1 Hangzhou Zkong Networks Co., Ltd.
- 10.2.2.2 Shanghai SUNMI Technology Co., Ltd.
- 10.2.2.3 SOLUM
- 10.2.2.4 Minewtag
- 10.2.3 Europe
- 10.2.3.1 Displaydata Ltd
- 10.2.3.2 Hanshow Technology
- 10.2.3.3 Teraoka (Pty) Ltd
- 10.2.1 North America
- 10.3 Niche Players/Disruptors
- 10.3.1 M2COMM
- 10.3.2 Opticon
- 10.3.3 Sen Security Solutions
- 10.3.4 Ynvisible Interactive Inc.
 电子货架标籤市场:2026-2032年全球市场预测(按产品类型、组件、通讯技术、显示尺寸、应用和分销管道划分)
 2026年全球电子货架标籤市场报告
 电子货架标籤市场分析及预测(至2035年):依类型、产品、服务、技术、组件、应用、形式、材料类型、部署方式及最终用户划分
 电子货架标籤市场 - 全球产业规模、份额、趋势、机会及预测(按产品类型、通讯方式、最终用户、地区和竞争格局划分,2021-2031年)
 电子货架标籤(ESL)市场规模、份额和成长分析(按组件、类型、通讯技术、尺寸、应用和地区划分)-2026-2033年产业预测
 电子货架标籤(ESL)市场规模、份额和趋势分析报告:按组件、类型、通讯技术、规模、应用、地区和细分市场预测(2026-2033 年)
 电子货架标籤市场:按技术类型、产品类型、最终用途和地区划分
 电子货架标籤市场报告(按类型(液晶显示器、全图形电子纸、分段式电子纸等)、组件、技术、应用和地区)2025 年至 2033 年
 电子棚架标籤市场,规模,占有率,趋势,产业分析报告:各产品类型,各零件,各显示器尺寸,不同通讯技术,商店类别,各地区-2025年~2034年市场预测
 全球液晶货架标籤市场