


 |
市场调查报告书
商品编码
1982365
饮料包装市场商机、成长要素、产业趋势分析及2026-2035年预测。Beverage Packaging Market Opportunity, Growth Drivers, Industry Trend Analysis, and Forecast 2026 - 2035 |
||||||
预计到 2025 年,全球饮料包装市场价值将达到 1,747 亿美元,并预计以 5.6% 的复合年增长率成长,到 2035 年达到 2,953 亿美元。
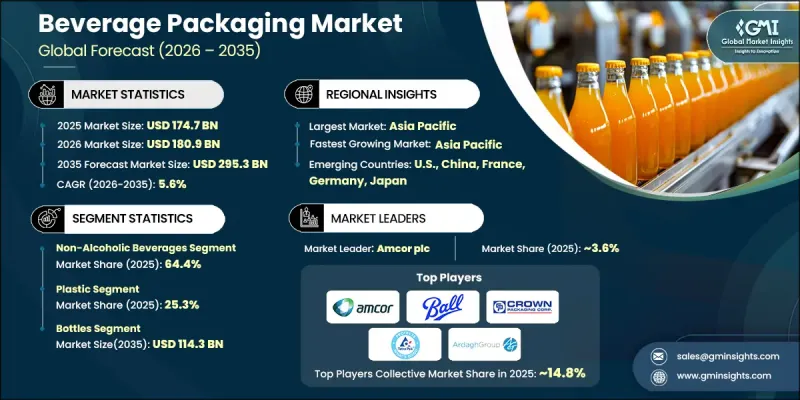
这一强劲成长主要得益于已开发市场和新兴市场包装饮料消费量的不断增长。快速的都市化、快节奏的生活方式以及消费者对便利、单份和便携饮料形式的日益偏好,正在加速对轻量瓶装、罐装、纸盒装和软包装袋的需求。瓶装水、碳酸饮料、即饮茶和咖啡以及健康饮料销售的成长,支撑着市场的持续发展势头。製造商正致力于提升产品安全性、延长保质期并增强品牌知名度的包装设计。同时,材料和製造流程的技术进步也提高了效率并优化了成本。优质化、客製化和机能饮料的兴起,持续推动包装创新。零售市场渗透率的提高和现代分销管道的拓展,进一步增强了全球需求。总体而言,在消费者偏好变化、监管趋势以及价值链上持续不断的材料创新等因素的支撑下,饮料包装行业预计将保持稳定的中等个位数成长。
| 市场范围 | |
|---|---|
| 开始年份 | 2025 |
| 预测期 | 2026-2035 |
| 上市时的市场规模 | 1747亿美元 |
| 预测金额 | 2953亿美元 |
| 复合年增长率 | 5.6% |
环境永续性在重塑饮料包装市场格局中发挥着至关重要的作用。日益严格的环境影响法规和不断增强的消费者环保意识正促使企业采用可回收、可生物降解和低排放的包装材料。安姆科公司 (Amcor plc)、波尔公司 (Ball Corporation) 和利乐国际公司 (Tetra Pak International SA) 等行业领导者正投资于循环经济项目、轻量化解决方案以及提高再生材料含量,以符合永续性目标。同时,智慧互联包装技术也日益受到关注。数位标籤、可追溯性工具和互动式包装等功能正在提高供应链透明度,并增强消费者参与度,尤其是在高端饮料领域。此外,电子商务和 D2C(直接面向消费者)分销模式的快速发展,也迫使製造商设计出在运输过程中更加耐用、结构强度更高、保质期更长的包装。
预计2026年至2035年间,酒精饮料市场将以4.7%的复合年增长率成长。消费者对高端酒精饮料和便利即饮包装的需求不断增长,推动了玻璃和可回收金属包装解决方案的创新。可支配收入的增加、消费模式的转变以及对美观包装的需求,都促进了该市场的成长。永续和轻量化的包装形式,以及线上零售通路的拓展,正在推动以消费者为导向且注重环保的包装设计进行投资。
预计到2025年,塑胶包装市占率将达到25.3%。其成长主要得益于成本效益、轻量化特性以及PET材料与高速生产线的兼容性。塑胶包装在全球仍被广泛用于瓶装水、软性饮料和机能饮料等领域。再生材料的日益普及和回收技术的进步正在提升永续性。此外,持续推进的轻量化措施正在减少原料消耗并优化运输效率。
到2025年,北美饮料包装市占率将达到21.3%。这项区域扩张的驱动力在于消费者对永续和可回收包装形式的日益偏好,以及对便捷便携式饮料解决方案的强劲需求。先进的製造能力和持续的产品优质化正在推动市场发展。对轻量宝特瓶、铝罐和智慧包装技术的投资正在提升营运效率和消费者参与。机能饮料和即饮产品的成长进一步加速了美国、加拿大和墨西哥的包装创新。
目录
第一章:调查方法和范围
第二章执行摘要
第三章业界考察
- 生态系分析
- 供应商情况
- 利润率分析
- 成本结构
- 每个阶段增加的价值
- 影响价值链的因素
- 中断
- 影响产业的因素
- 促进因素
- 对永续和环保包装的需求日益增长
- 即饮饮料消费量增加
- 消费者对高端饮品的偏好日益增长
- 注重独特的品牌形象和个性化包装
- 都市化和生活方式的改变
- 产业潜在风险与挑战
- 原料成本上涨
- 全球回收能力的不平衡
- 市场机会
- 实施循环经济和闭合迴路解决方案
- 智慧互动包装技术的集成
- 促进因素
- 监理情势
- 波特五力分析
- PESTEL 分析
- 科技与创新趋势
- 当前技术趋势
- 新兴技术
- 新兴经营模式
- 合规要求
- 专利和智慧财产权分析
- 地缘政治和贸易趋势
第四章 竞争情势
- 介绍
- 企业市占率分析
- 按地区
- 主要企业的竞争标竿分析
- 财务绩效比较
- 销售量
- 利润率
- 研究与发展(R&D)
- 产品系列比较
- 产品线
- 科技
- 创新
- 区域扩张比较
- 全球扩张分析
- 服务网路覆盖
- 按地区分類的市场渗透率
- 竞争定位矩阵
- 领导者
- 挑战者
- 追踪者
- 小众玩家
- 战略展望矩阵
- 财务绩效比较
- 2022-2025 年重大发展
- 併购
- 伙伴关係和联盟
- 技术进步
- 业务拓展与投资策略
- 数位转型计划
- 新兴/Start-Ups竞争对手的发展趋势
第五章 市场估价与预测:依包装类型划分,2022-2035年
- 硬包装
- 半刚性包装
- 软包装
第六章 市场估算与预测:依产品类型划分,2022-2035年
- 瓶子
- 能
- 纸盒
- 小袋
- 桶
- 其他的
第七章 市场估计与预测:依材料划分,2022-2035年
- 塑胶
- 玻璃
- 金属
- 纸张和纸板
- 其他的
第八章 市场估算与预测:依饮料类型划分,2022-2035年
- 不含酒精的饮料
- 酒精饮料
第九章 市场估计与预测:依最终用户产业划分,2022-2035年
- 无菌包装
- 热填充包装
- 冷灌装和常规包装
第十章 市场估价与预测:依地区划分,2022-2035年
- 北美洲
- 我们
- 加拿大
- 欧洲
- 德国
- 英国
- 法国
- 西班牙
- 义大利
- 荷兰
- 亚太地区
- 中国
- 印度
- 日本
- 澳洲
- 韩国
- 拉丁美洲
- 巴西
- 墨西哥
- 阿根廷
- 中东和非洲
- 南非
- 沙乌地阿拉伯
- 阿拉伯聯合大公国
第十一章:公司简介
- Amcor plc
- Ardagh Group SA
- Ball Corporation
- CANPACK
- CCL Container
- CPMC Holdings
- Crown
- Graham Packaging
- Graphic Packaging International, LLC
- Novelis
- Plastipak Holdings, Inc.
- SIG.
- Silgan Plastics
- Smurfit Westrock
- Stora Enso
- Tetra Pak International SA
- Visy
The Global Beverage Packaging Market was valued at USD 174.7 billion in 2025 and is estimated to grow at a CAGR of 5.6% to reach USD 295.3 billion by 2035.
Strong growth is driven by rising consumption of packaged beverages across developed and emerging economies. Rapid urban expansion, fast-paced consumer lifestyles, and increasing preference for convenient, single-serve, and portable beverage formats are accelerating demand for lightweight bottles, cans, cartons, and flexible pouches. Expanding sales of bottled water, carbonated drinks, ready-to-drink tea and coffee, and health-oriented beverages are supporting sustained market momentum. Manufacturers are focusing on packaging designs that enhance product safety, extend shelf life, and improve brand visibility. At the same time, technological advancements in materials and production processes are improving efficiency and cost optimization. The shift toward premiumization, customization, and functional beverage offerings continues to stimulate packaging innovation. Growing retail penetration and the expansion of modern trade channels are further strengthening global demand. Overall, the beverage packaging industry is positioned for steady mid-single-digit growth, supported by evolving consumer preferences, regulatory developments, and ongoing material innovation across the value chain.
| Market Scope | |
|---|---|
| Start Year | 2025 |
| Forecast Year | 2026-2035 |
| Start Value | $174.7 Billion |
| Forecast Value | $295.3 Billion |
| CAGR | 5.6% |
Environmental sustainability plays a pivotal role in reshaping the beverage packaging market landscape. Stricter regulations and heightened consumer awareness regarding environmental impact are encouraging companies to adopt recyclable, biodegradable, and low-emission packaging materials. Industry leaders such as Amcor plc, Ball Corporation, and Tetra Pak International S.A. are investing in circular economy initiatives, lightweight solutions, and higher recycled content integration to align with sustainability targets. In parallel, smart and connected packaging technologies are gaining traction. Features such as digital labeling, traceability tools, and interactive packaging formats are enhancing supply chain transparency and strengthening consumer engagement, particularly within premium beverage categories. Additionally, the rapid rise of e-commerce and direct-to-consumer distribution models is prompting manufacturers to design packaging that offers improved durability, structural integrity, and shelf-life performance during transportation.
The alcoholic beverages segment is expected to grow at a CAGR of 4.7% between 2026 and 2035. Increasing demand for premium alcoholic drinks and convenient ready-to-consume formats is driving innovation in glass and recyclable metal packaging solutions. Rising disposable income levels, evolving consumption patterns, and demand for aesthetically appealing packaging are contributing to segment growth. Sustainable and lightweight packaging formats, along with expanding online retail distribution, are encouraging investment in consumer-focused and environmentally responsible packaging designs.
The plastic segment accounted for 25.3% share in 2025. Growth is supported by the cost efficiency, lightweight characteristics, and compatibility of PET materials with high-speed production lines. Plastic packaging remains widely used across bottled water, soft drinks, and functional beverage categories worldwide. Increased utilization of post-consumer recycled materials and advancements in recycling technologies are strengthening sustainability performance. Ongoing lightweighting initiatives are also reducing raw material consumption and optimizing transportation efficiency.
North America Beverage Packaging Market held 21.3% share in 2025. Regional expansion is driven by rising preference for sustainable and recyclable packaging formats, combined with strong demand for convenient, on-the-go beverage solutions. Advanced manufacturing capabilities and continued product premiumization are reinforcing market development. Investments in lightweight PET bottles, aluminum cans, and smart packaging technologies are enhancing operational efficiency and consumer interaction. Growth in functional beverages and ready-to-drink products is further accelerating packaging innovation across the United States, Canada, and Mexico.
Prominent companies operating in the Global Beverage Packaging Market include Ardagh Group S.A., Crown, Smurfit Westrock, CANPACK, Novelis, Graham Packaging, CPMC Holdings, Plastipak Holdings, Inc., Silgan Plastics, Graphic Packaging International, LLC, SIG, Stora Enso, Visy, CCL Container, and Amcor plc. Companies in the Global Beverage Packaging Market are strengthening their competitive position through continuous investment in sustainable materials, lightweight designs, and recyclable packaging innovations. Strategic mergers, acquisitions, and partnerships are expanding production capabilities and geographic reach. Many firms are enhancing research and development efforts to introduce advanced barrier technologies and smart packaging features that improve traceability and consumer engagement. Optimization of supply chains and automation of manufacturing processes are helping reduce operational costs and improve efficiency.
Table of Contents
Chapter 1 Methodology and Scope
- 1.1 Market scope and definition
- 1.2 Research design
- 1.2.1 Research approach
- 1.2.2 Data collection methods
- 1.3 Data mining sources
- 1.3.1 Global
- 1.3.2 Regional/Country
- 1.4 Base estimates and calculations
- 1.4.1 Base year calculation
- 1.4.2 Key trends for market estimation
- 1.5 Primary research and validation
- 1.5.1 Primary sources
- 1.6 Forecast model
- 1.7 Research assumptions and limitations
Chapter 2 Executive Summary
- 2.1 Industry 360° synopsis, 2022 - 2035
- 2.2 Key market trends
- 2.2.1 System type trends
- 2.2.2 Deployment model trends
- 2.2.3 End-user industry trends
- 2.2.4 Regional trends
- 2.3 TAM analysis, 2026-2035
- 2.4 CXO perspectives: Strategic imperatives
- 2.4.1 Executive decision points
- 2.4.2 Critical success factors
- 2.5 Future outlook and strategic recommendations
Chapter 3 Industry Insights
- 3.1 Industry ecosystem analysis
- 3.1.1 Supplier landscape
- 3.1.2 Profit margin analysis
- 3.1.3 Cost structure
- 3.1.4 Value addition at each stage
- 3.1.5 Factor affecting the value chain
- 3.1.6 Disruptions
- 3.2 Industry impact forces
- 3.2.1 Growth drivers
- 3.2.1.1 Growing demand for sustainability & eco friendly packaging
- 3.2.1.2 Increased consumption in ready to drink (RTD) beverages
- 3.2.1.3 Increasing consumer preference for premium drinks
- 3.2.1.4 Focus on unique branding and personalized packaging
- 3.2.1.5 Rising urbanization & changing lifestyles
- 3.2.2 Industry pitfalls and challenges
- 3.2.2.1 Rising raw material costs
- 3.2.2.2 Inconsistent global recycling capabilities
- 3.2.3 Market opportunities
- 3.2.3.1 Adoption of circular economy & closed loop solutions
- 3.2.3.2 Integration of smart and interactive packaging technologies
- 3.2.1 Growth drivers
- 3.3 Regulatory landscape
- 3.3.1 North America
- 3.3.2 Europe
- 3.3.3 Asia Pacific
- 3.3.4 Latin America
- 3.3.5 Middle East & Africa
- 3.4 Porter's analysis
- 3.5 PESTEL analysis
- 3.6 Technology and innovation landscape
- 3.6.1 Current technological trends
- 3.6.2 Emerging technologies
- 3.7 Emerging business models
- 3.8 Compliance requirements
- 3.9 Patent and IP analysis
- 3.10 Geopolitical and trade dynamics
Chapter 4 Competitive Landscape, 2025
- 4.1 Introduction
- 4.2 Company market share analysis
- 4.2.1 By region
- 4.2.1.1 North America
- 4.2.1.2 Europe
- 4.2.1.3 Asia Pacific
- 4.2.1.4 Latin America
- 4.2.1.5 Middle East & Africa
- 4.2.1 By region
- 4.3 Competitive benchmarking of key players
- 4.3.1 Financial performance comparison
- 4.3.1.1 Revenue
- 4.3.1.2 Profit margin
- 4.3.1.3 R&D
- 4.3.2 Product portfolio comparison
- 4.3.2.1 Product range breadth
- 4.3.2.2 Technology
- 4.3.2.3 Innovation
- 4.3.3 Geographic presence comparison
- 4.3.3.1 Global footprint analysis
- 4.3.3.2 Service network coverage
- 4.3.3.3 Market penetration by region
- 4.3.4 Competitive positioning matrix
- 4.3.4.1 Leaders
- 4.3.4.2 Challengers
- 4.3.4.3 Followers
- 4.3.4.4 Niche players
- 4.3.5 Strategic outlook matrix
- 4.3.1 Financial performance comparison
- 4.4 Key developments, 2022-2025
- 4.4.1 Mergers and acquisitions
- 4.4.2 Partnerships and collaborations
- 4.4.3 Technological advancements
- 4.4.4 Expansion and investment strategies
- 4.4.5 Digital transformation initiatives
- 4.5 Emerging/ startup competitors' landscape
Chapter 5 Market Estimates and Forecast, By Packaging Type, 2022 - 2035 (USD Billion, Units)
- 5.1 Key trends
- 5.2 Rigid Packaging
- 5.3 Semi-Rigid Packaging
- 5.4 Flexible Packaging
Chapter 6 Market Estimates and Forecast, By Product Type, 2022 - 2035 (USD Billion, Units)
- 6.1 Key trends
- 6.2 Bottles
- 6.3 Cans
- 6.4 Cartons
- 6.5 Pouches & Sachets
- 6.6 Kegs & Barrels
- 6.7 Others
Chapter 7 Market Estimates and Forecast, By Material, 2022 - 2035 (USD Billion, Units)
- 7.1 Key trends
- 7.2 Plastic
- 7.3 Glass
- 7.4 Metal
- 7.5 Paper & Boards
- 7.6 Others
Chapter 8 Market Estimates and Forecast, By Beverage Type, 2022 - 2035 (USD Billion, Units)
- 8.1 Key trends
- 8.2 Non-Alcoholic Beverages
- 8.3 Alcoholic Beverages
Chapter 9 Market Estimates and Forecast, By End-User Industry, 2022 - 2035 (USD Billion, Units)
- 9.1 Key trends
- 9.2 Aseptic Packaging
- 9.3 Hot-Fill Packaging
- 9.4 Cold-Fill & Conventional Packaging
Chapter 10 Market Estimates and Forecast, By Region, 2022 - 2035 (USD Billion, Units)
- 10.1 Key trends
- 10.2 North America
- 10.2.1 U.S.
- 10.2.2 Canada
- 10.3 Europe
- 10.3.1 Germany
- 10.3.2 UK
- 10.3.3 France
- 10.3.4 Spain
- 10.3.5 Italy
- 10.3.6 Netherlands
- 10.4 Asia Pacific
- 10.4.1 China
- 10.4.2 India
- 10.4.3 Japan
- 10.4.4 Australia
- 10.4.5 South Korea
- 10.5 Latin America
- 10.5.1 Brazil
- 10.5.2 Mexico
- 10.5.3 Argentina
- 10.6 Middle East and Africa
- 10.6.1 South Africa
- 10.6.2 Saudi Arabia
- 10.6.3 UAE
Chapter 11 Company Profiles
- 11.1 Amcor plc
- 11.2 Ardagh Group S.A.
- 11.3 Ball Corporation
- 11.4 CANPACK
- 11.5 CCL Container
- 11.6 CPMC Holdings
- 11.7 Crown
- 11.8 Graham Packaging
- 11.9 Graphic Packaging International, LLC
- 11.10 Novelis
- 11.11 Plastipak Holdings, Inc.
- 11.12 SIG.
- 11.13 Silgan Plastics
- 11.14 Smurfit Westrock
- 11.15 Stora Enso
- 11.16 Tetra Pak International S.A.
- 11.17 Visy
 饮料包装市场:2026-2032年全球市场预测(依饮料类型、材料类型、包装形式、营运模式及通路划分)
 2026年全球饮料包装市场报告
 日本包装饮料市场规模、份额、趋势和预测:按类型、包装类型、通路和地区划分,2026-2034年热灌装包装全球市场报告(2026年)日本饮料包装市场报告:按材料、产品、应用和地区划分(2026-2034年)
 饮料包装创新市场预测至2032年:按材料、包装类型、创新类型、饮料类别、技术、最终用户和地区分類的全球分析
 饮料容器回收市场机会、成长驱动因素、产业趋势分析及预测(2025-2034年)2032 年塑胶中性水市场预测:按产品类型、包装类型、塑胶中性机制、价格分布范围、分销管道、最终用户和地区进行的全球分析
 饮料包装:市场份额分析、行业趋势、统计数据和成长预测(2025-2030 年)美国饮料包装:市场份额分析、行业趋势、统计数据和成长预测(2025-2030 年)