


 |
市场调查报告书
商品编码
1998853
行人侦测系统市场:商业机会、成长要素、产业趋势分析及 2026-2035 年预测。Pedestrian Detection System Market Opportunity, Growth Drivers, Industry Trend Analysis, and Forecast 2026 - 2035 |
||||||
2025 年全球行人侦测系统市场价值为 96 亿美元,预计到 2035 年将达到 427 亿美元,年复合成长率为 16.4%。
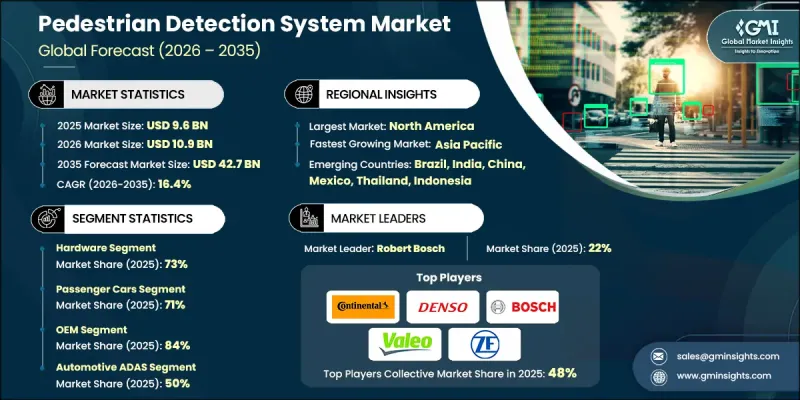
随着汽车製造商日益重视道路安全和预防事故技术,这个市场正蓬勃发展。行人侦测系统在现代车辆安全架构中扮演着至关重要的角色,能够即时识别行人和其他弱势道路使用者。这些系统依赖先进的感测技术,例如视觉摄影机、雷达、光达、红外线感测器以及人工智慧 (AI)影像处理,来侦测车辆周围的人员移动。当侦测到碰撞风险时,系统可以向驾驶发出警告,或自动煞车以减轻碰撞衝击或完全避免事故发生。人们对智慧驾驶辅助技术的日益关注正在加速其在多个车型领域的应用。此外,全球监管机构和安全机构正在收紧车辆安全标准,敦促製造商在新车中加入行人保护功能。基于人工智慧的感知软体、感测器融合和高效能运算平台的持续创新,进一步提升了系统在复杂交通环境中的准确性、可靠性和反应速度。随着都市化进程的推进和交通密度的增加,对先进行人保护解决方案的需求预计将稳定成长,从而推动行人侦测系统产业的长期扩张。
| 市场范围 | |
|---|---|
| 开始年份 | 2025 |
| 预测期 | 2026-2035 |
| 上市时的市场规模 | 96亿美元 |
| 预测金额 | 427亿美元 |
| 复合年增长率 | 16.4% |
预计到2025年,硬体部分将占据73%的市场份额,并在2026年至2035年间以16.5%的复合年增长率成长。该部分涵盖了广泛的感测技术,例如摄影机系统、雷达模组、雷射雷达感测器、红外线探测器、超音波感测器以及专用处理单元,这些技术能够实现即时感知和决策。在这些组件中,先进的处理硬体在支援用于目标识别、分类和运动预测的复杂演算法方面发挥着至关重要的作用。汽车人工智慧处理器和电控系统(ECU)约占硬体部分价值的18%,并且正在快速发展以满足深度学习模型和多感测器融合平台日益增长的运算需求。随着製造商不断提高检测精度和响应速度,整个汽车行业对先进硬体解决方案的需求仍然强劲。
预计到2025年,乘用车市占率将达到71%,并有望在2026年至2035年间以16.5%的复合年增长率成长。此细分市场的扩张主要受监管要求和消费者安全评估项目的推动,这些项目强调行人紧急煞车功能和对弱势道路使用者的保护。汽车製造商正越来越多地将行人侦测技术作为标准安全配置应用于各种乘用车。消费者对车辆安全的日益关注,以及政府更严格的指导方针,促使製造商在其车辆(从入门级到高端乘用车)中配备更先进的驾驶辅助功能。
美国行人侦测系统市场预计将在2026年至2035年间以16.3%的复合年增长率成长。健全的法规结构和积极的车辆安全标准执行力度正显着加速高级驾驶辅助系统(ADAS)的普及。国家安全计画和联邦交通倡议鼓励汽车製造商为车辆配备行人侦测系统,以适应各种交通环境。美国汽车製造商正大力投资研发、模拟测试和现场检验,以确保系统在包括人口密集都市区和高速公路网路在内的复杂交通场景中可靠运作。技术创新、强大的汽车製造基础以及消费者对先进安全功能日益增长的需求,进一步巩固了美国市场的地位。
目录
第一章:调查方法
第二章执行摘要
第三章业界考察
- 生态系分析
- 供应商情况
- 利润率分析
- 成本结构
- 每个阶段增加的价值
- 影响价值链的因素
- 中断
- 影响产业的因素
- 促进因素
- 行人死亡人数增加,引发人们对交通安全的担忧
- 严格的政府法规和强制性ADAS要求
- 消费者对车辆安全功能的意识和需求不断提高
- 人工智慧和机器学习的技术进步
- 自动驾驶和半自动驾驶车辆的广泛应用
- 配备安全功能的车辆可享保险费优惠
- 产业潜在风险与挑战
- 高昂的初始系统成本和经济实惠的实施障碍
- 在恶劣天气和低光源条件下性能受限
- 对假阳性率和系统可靠性的担忧
- 复杂的安装和整合要求
- 市场机会
- 随着汽车生产的扩张,新兴市场正在取得成长。
- 现有车队进行售后改装的潜力
- 与智慧城市基础设施和物联网生态系统的融合
- 跨产业应用(工业车辆、施工机械)
- 边缘运算与设备内人工智慧处理技术的进步
- 促进因素
- 成长潜力分析
- 监理情势
- 北美洲
- 美国联邦安全标准与ADAS实施指南
- 加拿大 - 连网和自动驾驶汽车安全框架 (CASF)
- 欧洲
- 德国 - Euro NCAP 和 IIHS 测试通讯协定
- 英国-脱欧后ADAS的柔软性
- 法国——国家ADAS测试和智慧交通系统战略
- 义大利——智慧交通系统试点计画和智慧基础设施
- 亚太地区
- 中国——工信部关于C-V2X的法规和标准
- 印度—ADAS和汽车互联的新法规
- 日本——智慧交通系统连结性与频率政策
- 澳洲—技术中立的智慧交通系统政策
- 拉丁美洲
- 墨西哥 - NOM 汽车安全标准
- 阿根廷 - 交通法第 24.449 号
- 中东和非洲
- 南非 - 道路交通法(1996 年)
- 沙乌地阿拉伯—「2030愿景」下的交通运输法律与交通运输倡议
- 北美洲
- 波特五力分析
- PESTEL 分析
- 科技与创新趋势
- 当前技术趋势
- 电脑视觉和影像处理技术的进步
- 深度学习与神经网路的融合
- 新兴技术
- 感测器融合技术的演进
- 即时处理和边缘运算
- V2X通讯的集成
- 当前技术趋势
- 3.5 专利趋势(基于初步调查)
- 主要技术专利丛集
- 领先的专利拥有者和创新领导者
- 专利申请趋势(2019-2025)
- 新兴专利领域与未开发领域的分析
- 成本細項分析
- 价格分析(基于初步调查)
- 对过去价格趋势的分析
- 按业务类型分類的定价策略(高端、超值、成本加成)
- 原厂配件和售后配件之间的价格差异
- 各地区价格波动
- 贸易数据分析(基于付费资料库)
- 进出口数量和价值的变化趋势
- 主要贸易走廊及关税的影响
- 各地区贸易流量趋势
- 人工智慧和生成式人工智慧对市场的影响
- 利用人工智慧改造现有经营模式
- GenAI 各细分市场的应用案例与实施蓝图
- 风险、局限性和监管考量
- 使用案例和成功案例
- 永续性和环境方面
- 永续倡议
- 减少废弃物策略
- 生产中的能源效率
- 环保意识的倡议
- 关于碳足迹的考量
- 基础设施和实施情况(基于初步调查)
- 按地区和购买者群体分類的采用率和渗透率
- 基础设施投资的可扩展性限制和趋势
- 预测假设和情境分析(基于初步研究)
- 基本案例-驱动复合年增长率的关键宏观经济与产业变量
- 乐观情境-宏观经济与产业的顺风
- 悲观情景-宏观经济放缓或产业逆风
第四章 竞争情势
- 介绍
- 企业市占率分析
- 北美洲
- 欧洲
- 亚太地区
- 拉丁美洲
- 中东和非洲(MEA)
- 主要市场公司的竞争分析
- 竞争定位矩阵
- 企业级分层基准测试
- 层级分类标准与选择标准
- 按收入、地区和创新能力分類的层级定位矩阵。
- 主要进展
- 併购
- 伙伴关係和联盟
- 新产品发布
- 业务拓展计划及资金筹措
第五章 市场估计与预测:依组件划分,2022-2035年
- 硬体
- 相机
- 感测器(超音波、红外线、光达、雷达)
- 控制单元
- 其他的
- 软体
- 检测演算法
- 资料处理软体
- 其他的
第六章 市场估计与预测:依技术划分,2022-2035年
- 基于视觉的系统
- 感测器融合系统
- 红外线系统
- 超音波系统
- 混合系统
第七章 市场估价与预测:依车辆类型划分,2022-2035年
- 搭乘用车
- 掀背车
- 轿车
- SUV
- 商用车辆
- 轻型商用车(LCV)
- 中型商用车(MCV)
- 重型商用车(HCV)
第八章 市场估算与预测:依通路划分,2022-2035年
- OEM
- 售后市场
第九章 市场估计与预测:依应用领域划分,2022-2035年
- 汽车高级驾驶辅助系统(ADAS)
- 交通管理
- 监测和安全监测
- 其他的
第十章 市场估价与预测:依地区划分,2022-2035年
- 北美洲
- 我们
- 加拿大
- 欧洲
- 德国
- 英国
- 法国
- 义大利
- 西班牙
- 俄罗斯
- 荷兰
- 瑞典
- 丹麦
- 波兰
- 亚太地区
- 中国
- 印度
- 日本
- 澳洲
- 韩国
- 新加坡
- 泰国
- 印尼
- 越南
- 拉丁美洲
- 巴西
- 墨西哥
- 阿根廷
- 哥伦比亚
- 中东和非洲(MEA)
- 南非
- 沙乌地阿拉伯
- 阿拉伯聯合大公国
- 以色列
第十一章:公司简介
- 世界公司
- Aptiv
- Autoliv
- Continental
- Denso
- Intel
- NVIDIA
- NXP Semiconductors
- Robert Bosch
- Valeo
- ZF Friedrichshafen
- 本地球员
- HELLA
- Hyundai Mobis
- Magna International
- Mobileye
- Veoneer
- 新兴企业和技术基础设施公司
- AEye
- Innoviz Technologies
- Luminar Technologies
- Ouster
- Perceptive Automata
The Global Pedestrian Detection System Market was valued at USD 9.6 billion in 2025 and is estimated to grow at a CAGR of 16.4% to reach USD 42.7 billion by 2035.
The market is gaining significant momentum as vehicle manufacturers increasingly prioritize road safety and accident prevention technologies. Pedestrian detection systems play a critical role in modern vehicle safety architectures by enabling real-time identification of pedestrians and other vulnerable road users. These systems rely on advanced sensing technologies such as vision cameras, radar, LiDAR, infrared sensors, and artificial intelligence-driven image processing to detect human movement near vehicles. Once a potential collision risk is identified, the system can alert drivers or automatically initiate braking to reduce impact severity or avoid accidents. The growing emphasis on intelligent driver assistance technologies is accelerating adoption across multiple vehicle segments. Additionally, regulatory authorities and safety organizations worldwide are strengthening vehicle safety standards, encouraging manufacturers to integrate pedestrian protection features into new vehicles. Continuous innovation in AI-based perception software, sensor fusion, and high-performance computing platforms is further improving system accuracy, reliability, and responsiveness in complex traffic environments. As urbanization increases and traffic density rises, the need for advanced pedestrian protection solutions is expected to grow steadily, driving long-term expansion of the pedestrian detection system industry.
| Market Scope | |
|---|---|
| Start Year | 2025 |
| Forecast Year | 2026-2035 |
| Start Value | $9.6 Billion |
| Forecast Value | $42.7 Billion |
| CAGR | 16.4% |
The hardware segment accounted for 73% share in 2025 and is anticipated to grow at a CAGR of 16.5% between 2026 and 2035. This segment includes a wide range of sensing technologies such as camera systems, radar modules, LiDAR sensors, infrared detection devices, ultrasonic sensors, and dedicated processing units that enable real-time perception and decision-making. Among these components, advanced processing hardware plays a critical role by supporting complex algorithms used for object recognition, classification, and motion prediction. Automotive-grade AI processors and electronic control units represent approximately 18% of the hardware segment value and are evolving rapidly to meet the increasing computational requirements of deep learning models and multi-sensor fusion platforms. As manufacturers continue to improve detection accuracy and response times, demand for advanced hardware solutions remains strong across the automotive industry.
The passenger cars segment held a 71% share in 2025 and is expected to grow at a CAGR of 16.5% throughout 2026-2035. The expansion of this segment is largely influenced by regulatory requirements and consumer safety evaluation programs that emphasize pedestrian automatic emergency braking performance and protection of vulnerable road users. Automakers are increasingly integrating pedestrian detection technologies as standard safety features across a wide range of passenger vehicles. Growing consumer awareness regarding vehicle safety, combined with stricter government guidelines, is encouraging manufacturers to incorporate more advanced driver assistance capabilities in both entry-level and premium passenger vehicles.
United States Pedestrian Detection System Market is projected to grow at a CAGR of 16.3% between 2026 and 2035. Strong regulatory frameworks and active enforcement of vehicle safety standards have significantly accelerated the adoption of advanced driver assistance technologies. National safety programs and federal transportation initiatives are encouraging automakers to incorporate pedestrian detection systems in vehicles operating across various traffic environments. Automotive manufacturers in the country are investing heavily in research, simulation testing, and real-world validation to ensure reliable system performance in complex traffic scenarios, including dense urban areas and high-speed road networks. The combination of technological innovation, strong automotive manufacturing presence, and increasing consumer demand for advanced safety features continues to strengthen the market position of the United States.
Key players operating in the Global Pedestrian Detection System Market include Aptiv, Autoliv, Continental, Denso, Magna, Mobileye, NVIDIA, Robert Bosch, Valeo, and ZF Friedrichshafen. Companies operating in the Pedestrian Detection System Market are adopting several strategies to strengthen their market position and expand technological capabilities. Key players are investing heavily in research and development to improve sensor accuracy, AI perception algorithms, and multi-sensor fusion technologies that enhance detection reliability in challenging environments. Strategic partnerships with automotive manufacturers allow technology providers to integrate pedestrian detection systems directly into vehicle platforms during early design stages. Companies are also focusing on expanding product portfolios with advanced processing hardware, high-resolution sensors, and scalable software architectures. Additionally, firms are increasing investments in simulation tools, testing environments, and data analytics to accelerate innovation and system validation.
Table of Contents
Chapter 1 Methodology
- 1.1 Research approach
- 1.2 Quality commitments
- 1.3 Research trail and confidence scoring
- 1.3.1 Research trail components
- 1.3.2 Scoring components
- 1.4 Data collection
- 1.4.1 Partial list of primary sources
- 1.5 Data mining sources
- 1.5.1 Paid sources
- 1.6 Best estimates and calculations
- 1.6.1 Base year calculation for any one approach
- 1.7 Forecast model
- 1.8 Research transparency addendum
Chapter 2 Executive Summary
- 2.1 Industry 360° synopsis, 2022 - 2035
- 2.2 Key market trends
- 2.2.1 Regional
- 2.2.2 Components
- 2.2.3 Technology
- 2.2.4 Vehicles
- 2.2.5 Distribution Channel
- 2.2.6 Application
- 2.3 TAM Analysis, 2026-2035
- 2.4 CXO perspectives: Strategic imperatives
Chapter 3 Industry Insights
- 3.1 Industry ecosystem analysis
- 3.1.1 Supplier landscape
- 3.1.2 Profit margin analysis
- 3.1.3 Cost structure
- 3.1.4 Value addition at each stage
- 3.1.5 Factor affecting the value chain
- 3.1.6 Disruptions
- 3.2 Industry impact forces
- 3.2.1 Growth drivers
- 3.2.1.1 Increasing pedestrian fatalities and road safety concerns
- 3.2.1.2 Stringent government regulations and mandatory ADAS requirements
- 3.2.1.3 Rising consumer awareness and demand for vehicle safety features
- 3.2.1.4 Technological advancements in AI and machine learning
- 3.2.1.5 Growing adoption of autonomous and semi-autonomous vehicles
- 3.2.1.6 Insurance premium incentives for safety-equipped vehicles
- 3.2.2 Industry pitfalls and challenges
- 3.2.2.1 High initial system costs and affordability barriers
- 3.2.2.2 Performance limitations in adverse weather and low-light conditions
- 3.2.2.3 False detection rates and system reliability concerns
- 3.2.2.4 Complex installation and integration requirements
- 3.2.3 Market opportunities
- 3.2.3.1 Expansion in emerging markets with growing vehicle production
- 3.2.3.2 Aftermarket retrofitting potential for existing vehicle fleet
- 3.2.3.3 Integration with smart city infrastructure and IoT ecosystems
- 3.2.3.4 Cross-industry applications (industrial vehicles, construction equipment)
- 3.2.3.5 Edge computing and on-device AI processing advancements
- 3.2.1 Growth drivers
- 3.3 Growth potential analysis
- 3.4 Regulatory landscape
- 3.4.1 North America
- 3.4.1.1 US- Federal safety rules & ADAS deployment guidance
- 3.4.1.2 Canada - Safety framework for connected & automated vehicles (CASF)
- 3.4.2 Europe
- 3.4.2.1 Germany- Euro NCAP and IIHS testing protocols
- 3.4.2.2 UK- Post-Brexit ADAS flexibility
- 3.4.2.3 France- National ADAS testing & ITS strategy
- 3.4.2.4 Italy- ITS pilots & smart infrastructure
- 3.4.3 Asia Pacific
- 3.4.3.1 China- MIIT C V2X mandates & standards
- 3.4.3.2 India- Emerging ADAS & automotive connectivity regulations
- 3.4.3.3 Japan- ITS connect & spectrum policy
- 3.4.3.4 Australia- Technology neutral ITS policies
- 3.4.4 LATAM
- 3.4.4.1 Mexico- NOM vehicle safety standards
- 3.4.4.2 Argentina- National traffic law 24.449
- 3.4.5 MEA
- 3.4.5.1 South Africa- National road traffic act (1996)
- 3.4.5.2 Saudi Arabia- Traffic law & vision 2030 transport initiatives
- 3.4.1 North America
- 3.5 Porter's analysis
- 3.6 PESTEL analysis
- 3.7 Technology and innovation landscape
- 3.7.1 Current technological trends
- 3.7.1.1 Computer vision and image processing advancements
- 3.7.1.2 Deep learning and neural network integration
- 3.7.2 Emerging technologies
- 3.7.2.1 Sensor fusion technology evolution
- 3.7.2.2 Real-time processing and edge computing
- 3.7.2.3 V2X communication integration
- 3.7.1 Current technological trends
- 3.8 3.5 Patent landscape (Driven by primary research)
- 3.8.1 Key technology patent clusters
- 3.8.2 Major patent holders and innovation leaders
- 3.8.3 Patent filing trends (2019-2025)
- 3.8.4 Emerging patent areas and white space analysis
- 3.9 Cost breakdown analysis
- 3.10 Pricing analysis (Driven by primary research)
- 3.10.1 Historical price trend analysis
- 3.10.2 Pricing strategy by player type (premium, value, cost-plus)
- 3.10.3 OEM versus aftermarket price differential
- 3.10.4 Regional price variations
- 3.11 Trade data analysis (Driven by paid database)
- 3.11.1 Import and export volume and value trends
- 3.11.2 Key trade corridors and tariff impact
- 3.11.3 Regional trade flow patterns
- 3.12 Impact of AI and generative AI on the market
- 3.12.1 AI-driven disruption of existing business models
- 3.12.2 GenAI use cases and adoption roadmap by segment
- 3.12.3 Risks, limitations, and regulatory considerations
- 3.13 Use cases & success stories
- 3.14 Sustainability and environmental aspects
- 3.14.1 Sustainable practices
- 3.14.2 Waste reduction strategies
- 3.14.3 Energy efficiency in production
- 3.14.4 Eco-friendly Initiatives
- 3.14.5 Carbon footprint considerations
- 3.15 Infrastructure and deployment landscape (Driven by primary research)
- 3.15.1 Deployment penetration by region and buyer segment
- 3.15.2 Scalability constraints and infrastructure investment trends
- 3.16 Forecast assumptions & scenario analysis (Driven by Primary Research)
- 3.16.1 Base Case - key macro & industry variables driving CAGR
- 3.16.2 Optimistic Scenarios - Favorable macro and industry tailwinds
- 3.16.3 Pessimistic Scenario - Macroeconomic slowdown or industry headwinds
Chapter 4 Competitive Landscape, 2025
- 4.1 Introduction
- 4.2 Company market share analysis
- 4.2.1 North America
- 4.2.2 Europe
- 4.2.3 Asia Pacific
- 4.2.4 LATAM
- 4.2.5 MEA
- 4.3 Competitive analysis of major market players
- 4.4 Competitive positioning matrix
- 4.5 Company tier benchmarking
- 4.5.1 Tier classification criteria & qualifying thresholds
- 4.5.2 Tier positioning matrix by revenue, geography & innovation
- 4.6 Key developments
- 4.6.1 Mergers & acquisitions
- 4.6.2 Partnerships & collaborations
- 4.6.3 New product launches
- 4.6.4 Expansion plans and funding
Chapter 5 Market Estimates & Forecast, By Component, 2022 - 2035 ($Bn, Units)
- 5.1 Key trends
- 5.2 Hardware
- 5.2.1 Cameras
- 5.2.2 Sensors (Ultrasonic, Infrared, Lidar, Radar)
- 5.2.3 Control units
- 5.2.4 Others
- 5.3 Software
- 5.3.1 Detection algorithms
- 5.3.2 Data processing software
- 5.3.3 Others
Chapter 6 Market Estimates & Forecast, By Technology, 2022 - 2035 ($Bn, Units)
- 6.1 Key trends
- 6.2 Vision-based systems
- 6.3 Sensor fusion systems
- 6.4 Infrared systems
- 6.5 Ultrasonic systems
- 6.6 Hybrid systems
Chapter 7 Market Estimates & Forecast, By Vehicle, 2022 - 2035 ($Bn, Units)
- 7.1 Key trends
- 7.2 Passenger cars
- 7.2.1 Hatchback
- 7.2.2 Sedan
- 7.2.3 SUV
- 7.3 Commercial vehicles
- 7.3.1 Light commercial vehicles (LCVs)
- 7.3.2 Medium commercial vehicles (MCVs)
- 7.3.3 Heavy commercial vehicles (HCVs)
Chapter 8 Market Estimates & Forecast, By Distribution Channel, 2022 - 2035 ($Bn, Units)
- 8.1 Key trends
- 8.2 OEM
- 8.3 Aftermarket
Chapter 9 Market Estimates & Forecast, By Application, 2022 - 2035 ($Bn, Units)
- 9.1 Key trends
- 9.2 Automotive ADAS
- 9.3 Traffic management
- 9.4 Surveillance & safety monitoring
- 9.5 Others
Chapter 10 Market Estimates & Forecast, By Region, 2022 - 2035 ($Bn, Units)
- 10.1 Key trends
- 10.2 North America
- 10.2.1 US
- 10.2.2 Canada
- 10.3 Europe
- 10.3.1 Germany
- 10.3.2 UK
- 10.3.3 France
- 10.3.4 Italy
- 10.3.5 Spain
- 10.3.6 Russia
- 10.3.7 Netherlands
- 10.3.8 Sweden
- 10.3.9 Denmark
- 10.3.10 Poland
- 10.4 Asia Pacific
- 10.4.1 China
- 10.4.2 India
- 10.4.3 Japan
- 10.4.4 Australia
- 10.4.5 South Korea
- 10.4.6 Singapore
- 10.4.7 Thailand
- 10.4.8 Indonesia
- 10.4.9 Vietnam
- 10.5 Latin America
- 10.5.1 Brazil
- 10.5.2 Mexico
- 10.5.3 Argentina
- 10.5.4 Colombia
- 10.6 MEA
- 10.6.1 South Africa
- 10.6.2 Saudi Arabia
- 10.6.3 UAE
- 10.6.4 Israel
Chapter 11 Company Profiles
- 11.1 Global Players
- 11.1.1 Aptiv
- 11.1.2 Autoliv
- 11.1.3 Continental
- 11.1.4 Denso
- 11.1.5 Intel
- 11.1.6 NVIDIA
- 11.1.7 NXP Semiconductors
- 11.1.8 Robert Bosch
- 11.1.9 Valeo
- 11.1.10 ZF Friedrichshafen
- 11.2 Regional Players
- 11.2.1 HELLA
- 11.2.2 Hyundai Mobis
- 11.2.3 Magna International
- 11.2.4 Mobileye
- 11.2.5 Veoneer
- 11.3 Emerging Players & Technology Enablers
- 11.3.1 AEye
- 11.3.2 Innoviz Technologies
- 11.3.3 Luminar Technologies
- 11.3.4 Ouster
- 11.3.5 Perceptive Automata
 车辆和行人通讯市场:2026年至2032年全球市场预测(按通讯技术、组件类型、部署模式、网路类型、行人用设备类型、应用和最终用户划分)
 2026年全球行人侦测系统市场报告2026年全球行人保护气囊市场报告汽车行人保护系统市场:依行人侦测技术、系统类型、ADAS等级、车辆类型和通路划分-2026-2032年全球预测
 汽车行人保护系统市场:市场机会、成长要素、产业趋势分析及2026-2035年预测
 汽车行人保护系统市场规模、份额及成长分析(依技术、组件类型、类型及地区划分)-2026-2033年产业预测
 行人侦测系统市场-全球产业规模、份额、趋势、机会和预测,按类型(视讯、红外线、混合、其他类型)、按组件(感测器、摄影机、雷达、其他)、按地区和竞争情况细分,2020 年至 2030 年
 行人侦测系统市场,按技术、按组件、按车辆类型、按系统类型、按国家和地区 - 2025 年至 2032 年全球行业分析、市场规模、市场份额和预测
 商用车行人保护系统 (PPS) 的全球市场行人保护安全气囊市场机会、成长动力、产业趋势分析与 2025 - 2034 年预测