


 |
市场调查报告书
商品编码
1473279
全球半导体製造设备:市场、市场占有率、市场预测Global Semiconductor Equipment: Markets, Market Shares and Market Forecasts |
||||||
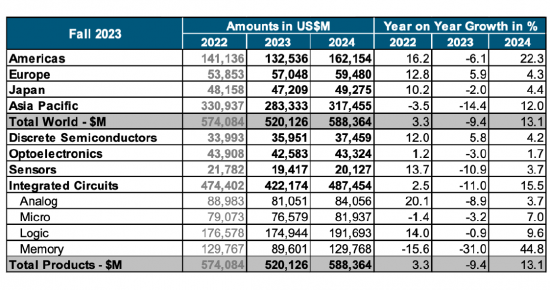
2023年全球半导体产业销售额总计5,268亿美元,较2022年产业史上最高点5,741亿美元下降8.2%。 然而,销售在 2023 年下半年有所恢復。 事实上,第四季销售额为1,460亿美元,比去年同期成长11.6%,比2023年第三季成长8.4%。 此外,2023年12月全球销售额为486亿美元,较上季成长1.5%。
依地区划分,欧洲是2023年唯一实现年度成长的地区市场,该地区销售额成长4.0%。 所有其他市场 2023 年销售额均下降:日本 (-3.1%)、美洲 (-5.2%)、亚太/其他地区 (-10.1%) 和中国 (-14.0%)。 与11 月相比,2023 年12 月的月销售额在中国(成长4.7%)、美洲(成长1.8%)和亚太/其他地区(成长0.3%)有所成长,但日本(下降2.4 %)和欧洲(下降3.9%)。
2023年,多个半导体产品领域脱颖而出。 2023年逻辑产品销售额将达到1,785亿美元,成为销售额最大的产品类别。 记忆体产品销售额排名第二,总计923亿美元。 微控制器 (MCU) 成长 11.4%,达到 279 亿美元。 此外,汽车IC销售额年增23.7%至422亿美元,创历史新高。
全球经济放缓和超支引发了 2023 年半导体供应过剩和设备崩溃。 随着现有半导体工厂的扩建和新半导体工厂的规划,产能正在大幅扩张。
拜登政府推动投资 500 亿美元建立国内製造能力,以提高美国的自给自足并减少对亚洲的依赖,此举可能会导致供应过剩和产能扩张。
本报告分析了全球半导体製造设备市场,包括市场的基本结构和驱动因素、最新情况、整体市场规模趋势和占有率结构(2012-2023年)以及依类型划分的详细趋势(24种类型)。
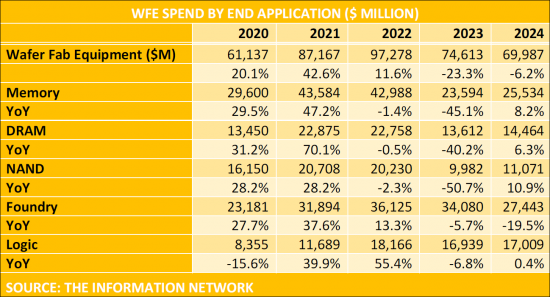
晶圆前端(WFE)设备投资额:依元件最终产品划分(2020-2024)
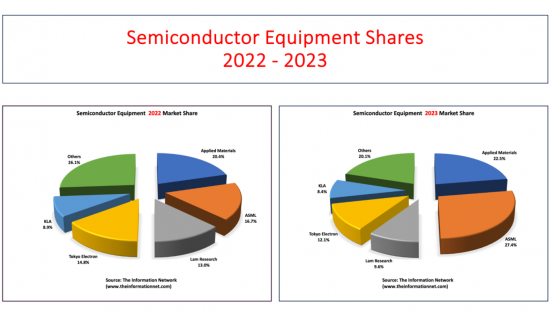
全球WFE设备市场的市占率:前5名公司及其他公司(2022/2023)
目录
第一章简介
第二章半导体产业驱动力
- 简介
- 铸造厂
- 代工资本投资趋势
- 代工所得成长率
- 代工市占率
- 收入成长率:依代工厂划分
- 全球代工/逻辑微影需求
- 全球铸造设备需求:依类型
- 台积电晶圆价格:依节点
- 铸造技术:线宽路线图
- 产能趋势:依线宽划分
- 产能比例:依地区划分
- 记忆体
- DRAM目前与未来的产能:依厂商划分
- DRAM 收入/需求预测:依应用分类
- DRAM 市占率
- DRAM资本投资
- NAND
- NAND 收入/需求预测:依应用程式分类
- NAND市占率
- 3D NAND产能
- 中国
- 中国的半导体基础设施
- 中国半导体市场
- 中国的积体电路生产
- 中国IC消费
- 中国IC产销比
- 中国积体电路进口要求
- 中国IC需求与供应
- 中国IC晶圆厂产能
- 中国IC晶圆厂产能:依地区划分
- 中国8吋和12吋晶圆厂和代工厂
- 中国IC晶圆厂产能:依晶圆尺寸划分
- 中国IC晶圆厂产能:依形状分类
- 中国积体电路产量:依类型
第三章市场/业务板块/占有率/预测
- AMHS(自动化物料搬运设备)市场占有率与预测
- CMP(化学机械平坦化)市占率及预测
- 清洁设备市场占有率及预测
- 等离子条带
- 喷雾处理器
- 湿站
- 薄膜形成设备的市占率及预测
- ALD(电子层沉积法)
- 外延
- MOCVD(有机化学气相沉积)
- LPCVD(低压CVD:非管式)
- LPCVD(低压CVD:管式)
- 等离子 CVD(化学气相沉积)
- PVD(物理气相沉积)
- 离子注入机市占率及预测
- 光刻设备市场占有率及预测
- 直写电子束光刻
- 掩模製造光刻
- 步进器
- 氧化/扩散设备市场占有率及预测
- 光阻加工(车)设备市占率及预测
- RTP(快速热处理)设备市占率及预测
- 等离子蚀刻设备市场占有率及预测
- 电介质
- 指挥
- 製程控制设备市场占有率及预测
- 光刻测量
- 薄膜测量
- 晶圆检查与缺陷审查
第 4 章美国半导体设备供应商:简介
- 应用材料
- 市场分析涵盖的业务领域
- 公司简介
- 财务指标
- Axcelis Technologies
- KLA
- Lam Research
- Mattson Technology
- Opto Innovation
- 公司简介:奈米技术
- 公司简介:Rudolph Technologies
- 维科
第五章欧洲半导体设备供应商:简介
- Aixtron
- ASM International
- ASML
- Carl Zeiss
- Camtek
- EV Group
- LPE
- Mycronic
- Nova Measuring Instruments9
- Oerlikon/Evatec
- Semilab
第六章亚洲半导体设备供应商:简介
- ACM Research
- Advantest
- AMEC
- Avaco
- Canon
- Canon Anelva
- Daifuku
- Ebara
- Eugene Technology
- Hitachi High-Technologies
- Hitachi Kokusai Electric
- Hwatsing
- JEOL
- Jusung Engineering
- KC Tech
- Lasertec
- Murata Machinery
- Murata Machinery
- Nikon
- Nippon Sanso
- Nissin Ion Equipment
- NuFlare Technology
- Piotech
- PSK
- Raintree Scientific Instruments
- Screen Semiconductor Solutions
- SEMES
- SEN
- TES
- Tokyo Electron
- Tokyo Seimitsu
- Topcon Technohouse
- Toray Engineering
- Ulvac
- Ushio
- Wonik IPS
The Semiconductor Industry Association (SIA) announced global semiconductor industry sales totaled $526.8 billion in 2023, a decrease of 8.2% compared to the 2022 total of $574.1 billion, which was the industry's highest-ever annual total. Sales picked up during the second half of 2023. In fact, fourth-quarter sales of $146.0 billion were 11.6% more than the total from the fourth quarter of 2022 and 8.4% higher than the total from third quarter of 2023. And global sales for the month of December 2023 were $48.6 billion, an increase of 1.5% compared to November 2023 total. Monthly sales are compiled by the World Semiconductor Trade Statistics (WSTS) organization and represent a three-month moving average. SIA represents 99% of the U.S. semiconductor industry by revenue and nearly two-thirds of non-U.S. chip firms.
On a regional basis, Europe was the only regional market that experienced annual growth in 2023, with sales there increasing 4.0%. Annual sales into all other regional markets decreased in 2023: Japan (-3.1%), the Americas (-5.2%), Asia- Pacific/All Other (-10.1%), and China (-14.0%). Sales for the month of December 2023 increased compared to November 2023 in China (4.7%), the Americas (1.8%), and Asia Pacific/All Other (0.3%), but decreased in Japan (-2.4%) and Europe (-3.9%).
Several semiconductor product segments stood out in 2023. Sales of logic products totaled $178.5 billion in 2023, making it the largest product category by sales. Memory products were second in terms of sales, totaling $92.3 billion. Microcontroller units (MCUs) grew by 11.4% to a total of $27.9 billion. And sales of automotive ICs grew by 23.7% year-over-year to a record total of $42.2 billion.
Global economic slowdowns and capes overspend were catalysts for producing an oversupply of semiconductors and an equipment meltdown in 2023. A significant capacity expansion is underway as current fabs expand and new fabs are planned.
A push by the Biden administration to invest $50 billion on domestic manufacturing facilities to improve US self-sufficiency and reduce reliance on Asia has initiated a course that will likely result in oversupply and capacity expansion:
Intel
- Arizona - Fab 42 expansion for 7nm capacity
- Oregon - Fab D1X $3B Mod3 expansion; tools installed Aug. '21 to Feb. '22
- New Mexico - $3.5B spend for advanced packaging
- Israel - $10B 7nm fab; 2023 production
- Ireland - spent additional $7B from 2019-2021 to expand to 7nm
- Arizona Foundry $20B for 2 fabs (~35k wspm each) starting production in 2023 and 2024
- Malaysia - $7B for advanced packaging fab expansion; 2024 production
TSMC
- Fab 18 - 3nm $20B fab expected to be completed in 2023
- Arizona Fab -$12B over time; 5nm initial phase to produce 20k wspm starting in 1Q24 with equipment installation commencing in 2H2022
- Japan 22 / 28nm fab with Sony; $7B 45k wspm targeting late 2024 production
- 7/6nm & 28nm fab in Kaohsiung, Taiwan for 2024 production for a reported $10B; phase 1 = 40k wspm for 7nm and 6nm with phase 2 for 28nm
Samsung
- Pyeongtaek line 3 (P3) equipment move-in expected to start in April 2022; rst 40-50k wspm 176L 3D NAND line, 130k-140k wspm DRAM and 10k-20k wspm 5nm foundry lines in 2H2022
- Pyeongtaek P2 S5-1; 3nm 60k wspm in 2021 & ramp to 120k wspm in 2022
- Pyeongtaek P2 S5-2; 3nm 60k wspm targeted production in 2024
- U.S. $17B 5nm Foundry fab in Texas; expected 2H2024 production (120k wspm est.)
GlobalFoundries
- $4 billion Singapore Module 7H 38k wspm starting wafer production in early-2023; full ramp end of 2023
- $1B Malta New York fab expansion of 12,500 wspm; additional fab to double capacity
- Spending $1.4B to expand capacity in U.S., Singapore, and Germany
SMIC
- 100k wspm 28nm & above fab for $8.87B in Shanghai; timing unknown
- 40k wspm 28nm & above fab in Shenzhen for $2.35B; production starting 2022
UMC
- Fab 12A Phase 6 (P6) $3.5B plan for expansion; scheduled for production in 2Q23
Kioxia / Western Digital
- Fab 7 in Mie Prefecture, Japan; expected production in late 2022 / early 2023
- Kitakami (K2) fab at $18.4B expected completion in early 2023; use of Yokkaichi equip.?
Micron
- DRAM - $7B fab in Japan expected to commence production in 2024
SK Hynix
- $106B fab complex with 800k wspm capacity and 200k EUV - rst fab completed in 2025 Nanya
- DRAM - $10.7B 10nm 110k wspm fab expected to be completed in 2023; production in 2024
Powerchip Semi (PSMC)
- $10B 12-inch fab in the Tongluo Science Park; 100k wspm of 1x to 50nm technology will be put into production in stages beginning in 2023
Texas Instruments
- RFAB2 - $850M fab coming online in 2H2022 with equipment over next few years
- LFAB (acquired from Micron) - spend $3B of capex over time with target of coming online in early-2023 - more details in February at capital management call
- North Texas Fab site (option for up to 4 fabs over time) - 1st & 2nd fab construction commencing in 2022 with First fab targeting production in 2025 (70k wspm estimated)
Wafer Front End equipment spend between 2020 and 2024 by device end product is shown below:
In Figure 1.1 below, we show market shares for the global WFE equipment market for 2022 and 2023, listing shares for the Top 5 global equipment companies and the other equipment companies in the market.
Report Coverage
This 325-page report analyzes and forecasts the semiconductor market for 24 different equipment types, including market shares for 2023 by type:
AMHS (Automated Material Handling Systems) Market
CMP (Chemical Mechanical Planarization) Market
Clean Market
- Plasma Strip
- Spray Processors
- Wet Stations
Deposition Market
- ALD
- Epitaxy
- MOCVD
- LPCVD (non-tube)
- LPCVD (tube)
- PECVD
- PVD
Ion Implantation Market
Lithography Market
- Direct-Write E-Beam Lithography
- Mask-Making Lithography
- Steppers
Oxidation/Diffusion Market
Photoresist Processing (Track) Market
RTP Market
Plasma Etch Market
- Dielectric
- Conductor
Process Control Market
- Lithography Metrology
- Thin-Film Metrology
- Wafer Inspection and Defect Review
The report in pdf format profiles 6 U.S., 11 European, and 26 Asian equipment companies.
An Excel File accompanies the report and covers Market Shares of each company by each equipment type between 2012 and 2023.
Driving forces of technology and geopolitics are analyzed and forecast by semiconductor type including China markets.
Table of Contents
Chapter 1. Introduction
Chapter 2. Semiconductor Industry Driving Forces
- 2.1. Introduction
- 2.2. Foundries
- 2.2.1. Foundry Capex Trends
- 2.2.2. Foundry Revenue Growth
- 2.2.3. Foundry Market Share
- 2.2.4. Revenue Growth by Foundry
- 2.2.5. Global Foundry / Logic Lithography Demand
- 2.2.6. Global Foundry Equipment Demand By Type
- 2.2.7. TSMC Wafer Price By Node
- 2.2.8. Foundry Technology Linewidth Roadmap
- 2.2.9. Capacity trend by linewidth
- 2.2.10. Capacity ratio by region
- 2.3. DRAM
- 2.3.1. Present and Future Capacity of DRAM by Manufacturer
- 2.3.2. DRAM Revenue Demand Forecast By Application
- 2.3.3. DRAM Market Shares
- 2.3.4. DRAM Capex
- 2.4. NAND
- 2.4.1. NAND Revenue Demand Forecast By Applications
- 2.4.2. NAND Market Shares
- 2.4.3 3D NAND Capacity
- 2.5. China
- 2.5.1. China's Semiconductor Infrastructure
- 2.5.2. China's Semiconductor Market
- 2.5.3. China's IC Production
- 2.5.4. China's IC Consumption
- 2.5.5. China's IC Production/Consumption Ratio
- 2.5.6. China's IC Import Requirements
- 2.5.7. China's IC Supply/Demand
- 2.5.8. China's IC Fab Capacity
- 2.5.9. China's IC Fab Capacity by Region
- 2.5.10. China's 8- And 12-Inch Fabs and Foundries
- 2.5.11. China's IC Fab Capacity by Wafer Size
- 2.5.12. China's IC Fab Capacity by Geometry
- 2.5.13. China's IC Production by Type
Chapter 3. Market Business Sectors Shares and Forecast
- 3.1. AMHS Market Shares and Forecast
- 3.2. CMP Market Shares and Forecast
- 3.3. Clean Market Shares and Forecast
- 3.3.1. Plasma Strip
- 3.3.2. Spray Processors
- 3.3.3. Wet Stations
- 3.4. Deposition Market Shares and Forecast
- 3.4.1. ALD
- 3.4.2. Epitaxy
- 3.4.3. MOCVD
- 3.4.4. LPCVD (non-tube)
- 3.4.5. LPCVD (tube)
- 3.4.6. PECVD
- 3.4.7. PVD
- 3.5. Ion Implantation Market Shares and Forecast
- 3.6. Lithography Market Shares and Forecast
- 3.6.1. Direct-Write E-Beam Lithography
- 3.6.2. Mask-Making Lithography
- 3.6.3. Steppers
- 3.7. Oxidation/Diffusion Market Shares and Forecast
- 3.8. Photoresist Processing (Track) Market Shares and Forecast
- 3.9. RTP Market Shares and Forecast
- 3.10. Plasma Etch Market Shares and Forecast
- 3.10.1. Dielectric
- 3.10.2. Conductor
- 3.11. Process Control Market Shares and Forecast
- 3.11.1. Lithography Metrology
- 3.11.2. Thin-Film Metrology
- 3.11.3. Wafer Inspection and Defect Review
Chapter 4. U.S. Semiconductor Equipment Suppliers - Profiles
- 4.1. Applied Materials
- 4.1.1. Business Sectors Covered In The Market Analysis Chapter
- 4.1.2. Company Profile
- 4.1.3. Company Financials
- 4.2. Axcelis Technologies
- 4.1.2. Business Sectors Covered In The Market Analysis Chapter
- 4.2.2. Company Profile
- 4.2.3. Company Financials
- 4.3. KLA
- 4.3.1. Business Sectors Covered In The Market Analysis Chapter
- 4.3.2. Company Profile
- 4.3.3. Company Financials
- 4.4. Lam Research
- 4.4.1. Business Sectors Covered In The Market Analysis Chapter
- 4.4.2. Company Profile
- 4.4.3. Company Financials
- 4.5. Mattson Technology
- 4.5.1. Business Sectors Covered In The Market Analysis Chapter
- 4.5.2. Company Profile
- 4.5.3. Company Financials
- 4.6. Opto Innovation
- 4.6.1. Business Sectors Covered In The Market Analysis Chapter
- 4.6.2. Company Profile - Nanometrics
- 4.6.3. Sectors Covered In The Market Analysis Chapter
- 4.6.4. Company Profile - Rudolph Technologies
- 4.6.5. Company Financials
- 4.7. Veeco
- 4.7.1. Business Sectors Covered In The Market Analysis Chapter
- 4.7.2. Company Profile
- 4.7.3. Company Financials
Chapter 5. European Semiconductor Equipment Suppliers - Profiles
- 5.1. Aixtron
- 5.1.1. Business Sectors Covered In The Market Analysis Chapter
- 5.1.2. Company Profile
- 5.1.3. Company Financials
- 5.2. ASM International
- 5.2.1. Business Sectors Covered In The Market Analysis Chapter
- 5.2.2. Company Profile
- 5.2.3. Company Financials
- 5.3. ASML
- 5.3.1. Business Sectors Covered In The Market Analysis Chapter
- 5.3.2. Company Profile
- 5.3.3. Company Financials
- 5.4. Carl Zeiss
- 5.4.1. Business Sectors Covered In The Market Analysis Chapter
- 5.4.2. Company Profile
- 5.4.3. Company Financials
- 5.5. Camtek
- 5.5.1. Business Sectors Covered In The Market Analysis Chapter
- 5.5.2. Company Profile
- 5.5.3. Company Financials
- 5.6. EV Group
- 5.6.1. Business Sectors Covered In The Market Analysis Chapter
- 5.6.2. Company Profile
- 5.6.3. Company Financials
- 5.7. LPE
- 5.7.1. Business Sectors Covered In The Market Analysis Chapter
- 5.7.2. Company Profile
- 5.7.3. Company Financials
- 5.8. Mycronic
- 5.8.1. Business Sectors Covered In The Market Analysis Chapter
- 5.8.2. Company Profile
- 5.8.3. Company Financials
- 5.9. Nova Measuring Instruments9
- 5.9.1. Business Sectors Covered In The Market Analysis Chapter
- 5.9.2. Company Profile
- 5.9.3. Company Financials
- 5.10. Oerlikon / Evatec
- 5.10.1. Business Sectors Covered In The Market Analysis Chapter
- 5.10.2. Company Profile
- 5.10.3. Company Financials
- 5.11. Semilab
- 5.11.1. Business Sectors Covered In The Market Analysis Chapter
- 5.11.2. Company Profile
- 5.11.3. Company Financials
Chapter 6. Asian Semiconductor Equipment Suppliers - Profiles
- 6.1. ACM Research
- 6.1.1. Business Sectors Covered In The Market Analysis Chapter
- 6.1.2. Company Profile
- 6.1.3. Company Financials
- 6.2. Advantest
- 6.2.1. Business Sectors Covered In The Market Analysis Chapter
- 6.2.2. Company Profile
- 6.2.3. Company Financials
- 6.3. AMEC
- 6.3.1. Business Sectors Covered In The Market Analysis Chapter
- 6.3.2. Company Profile
- 6.3.3. Company Financials
- 6.4. Avaco
- 6.4.1. Business Sectors Covered In The Market Analysis Chapter
- 6.4.2. Company Profile
- 6.4.3. Company Financials
- 6.5. Canon
- 6.5.1. Business Sectors Covered In The Market Analysis Chapter
- 6.5.2. Company Profile
- 6.5.3. Company Financials
- 6.5.6. Canon Anelva
- 6.6.1. Business Sectors Covered In The Market Analysis Chapter
- 6.6.2. Company Profile
- 6.6.3. Company Financials
- 6.7. Daifuku
- 6.7.1. Business Sectors Covered In The Market Analysis Chapter
- 6.7.2. Company Profile
- 6.7.3. Company Financials
- 6.8. Ebara
- 6.8.1. Business Sectors Covered In The Market Analysis Chapter
- 6.8.2. Company Profile
- 6.8.3. Company Financials
- 6.9. Eugene Technology
- 6.9.1. Business Sectors Covered In The Market Analysis Chapter
- 6.9.2. Company Profile
- 6.9.3. Company Financials
- 6.10. Hitachi High-Technologies
- 6.10.1. Business Sectors Covered In The Market Analysis Chapter
- 6.10.2. Company Profile
- 6.1.3. Company Financials
- 6.10. Hitachi Kokusai Electric
- 6.11.1. Business Sectors Covered In The Market Analysis Chapter
- 6.11.2. Company Profile
- 6.11.3. Company Financials
- 6.12. Hwatsing
- 6.12.1. Business Sectors Covered In The Market Analysis Chapter
- 6.12.2. Company Profile
- 6.12.3. Company Financials
- 6.13. JEOL
- 6.13.1. Business Sectors Covered In The Market Analysis Chapter
- 6.13.2. Company Profile
- 6.13.3. Company Financials
- 6.14. Jusung Engineering
- 6.14.1. Business Sectors Covered In The Market Analysis Chapter
- 6.14.2. Company Profile
- 6.14.3. Company Financials
- 6.15. KC Tech
- 6.15.1. Business Sectors Covered In The Market Analysis Chapter
- 6.15.2. Company Profile
- 6.15.3. Company Financials
- 6.16. Lasertec
- 6.16.1. Business Sectors Covered In The Market Analysis Chapter
- 6.16.2. Company Profile
- 6.16.3. Company Financials
- 6.17. Murata Machinery
- 6.17.1. Business Sectors Covered In The Market Analysis Chapter
- 6.17.2. Company Profile
- 6.17.3. Company Financials
- 6.18. Murata Machinery
- 6.18.1. Business Sectors Covered In The Market Analysis Chapter
- 6.18.2. Company Profile
- 6.18.3. Company Financials
- 6.19. Nikon
- 6.19.1. Business Sectors Covered In The Market Analysis Chapter
- 6.19.2. Company Profile
- 6.19.3. Company Financials
- 6.20. Nippon Sanso
- 6.20.1. Business Sectors Covered In The Market Analysis Chapter
- 6.20.2. Company Profile
- 6.20.3. Company Financials
- 6.21. Nissin Ion Equipment
- 6.21.1. Business Sectors Covered In The Market Analysis Chapter
- 6.21.2. Company Profile
- 6.21.3. Company Financials
- 6.22. NuFlare Technology
- 6.22.1. Business Sectors Covered In The Market Analysis Chapter
- 6.22.2. Company Profile
- 6.22.3. Company Financials
- 6.23. Piotech
- 6.23.1. Business Sectors Covered In The Market Analysis Chapter
- 6.23.2. Company Profile
- 6.23.3. Company Financials
- 6.24. PSK
- 6.24.1. Business Sectors Covered In The Market Analysis Chapter
- 6.24.2. Company Profile
- 6.24.3. Company Financials
- 6.25. Raintree Scientific Instruments
- 6.25.1. Business Sectors Covered In The Market Analysis Chapter
- 6.25.2. Company Profile
- 6.25.3. Company Financials
- 6.26. Screen Semiconductor Solutions
- 6.26.1. Business Sectors Covered In The Market Analysis Chapter
- 6.26.2. Company Profile
- 6.26.3. Company Financials
- 6.27. SEMES
- 6.27.1. Business Sectors Covered In The Market Analysis Chapter
- 6.27.2. Company Profile
- 6.27.3. Company Financials
- 6.28. SEN
- 6.28.1. Business Sectors Covered In The Market Analysis Chapter
- 6.28.2. Company Profile
- 6.28.3. Company Financials
- 6.29. TES
- 6.29.1. Business Sectors Covered In The Market Analysis Chapter
- 6.29.2. Company Profile
- 6.29.3. Company Financials
- 6.30. Tokyo Electron
- 6.30.1. Business Sectors Covered In The Market Analysis Chapter
- 6.30.2. Company Profile
- 6.30.3. Company Financials
- 6.31. Tokyo Seimitsu
- 6.31.1. Business Sectors Covered In The Market Analysis Chapter
- 6.31.2. Company Profile
- 6.31.3. Company Financials
- 6.32. Topcon Technohouse
- 6.32.1. Business Sectors Covered In The Market Analysis Chapter
- 6.32.2. Company Profile
- 6.32.3. Company Financials
- 6.33. Toray Engineering
- 6.33.1. Business Sectors Covered In The Market Analysis Chapter
- 6.33.2. Company Profile
- 6.33.3. Company Financials
- 6.34. Ulvac
- 6.34.1. Business Sectors Covered In The Market Analysis Chapter
- 6.34.2. Company Profile
- 6.34.3. Company Financials
- 6.35. Ushio
- 6.35.1. Business Sectors Covered In The Market Analysis Chapter
- 6.35.2. Company Profile
- 6.35.3. Company Financials
- 6.36. Wonik IPS
- 6.36.1. Business Sectors Covered In The Market Analysis Chapter
- 6.36.2. Company Profile
- 6.36.3. Company Financials
LIST OF TABLES
- 1.1. Global Wafer Front End Equipment Companies
- 1.2. Capex By Company
- 2.1. Foundry Capex ($ Millions)
- 2.2. Pure Play Foundry Forecast
- 2.3. Pure Play Foundry Revenue Shares
- 2.4. Foundry / Logic Lithography Demand
- 2.5. New Capacity Equipment Demand By Type
- 2.6. TSMC Wafer Price By Node - 2020-2025
- 2.7. TSMC Wafer Price By Node - 2025
- 2.8. TSMC Chip Features By Node
- 2.9. TSMC Top Customers By Revenue
- 2.10. Technology Roadmaps For China Foundries
- 2.11. Global Foundry Market By Linewidth
- 2.12. Foundry Capacity By Region
- 2.13. DRAM Wafer Capacity Forecast by Fab - Wafers
- 2.14. DRAM Earnings Comparisons by Company
- 2.15. DRAM Revenue Demand Forecast by Application
- 2.16. DRAM Market Shares
- 2.17. DRAM Capex Forecast by Company
- 2.18. NAND Wafer Capacity by Fab
- 2.19. NAND Earnings Comparison by Company
- 2.20. NAND Bit Growth Demand Forecast by Application
- 2.21. NAND Market Shares
- 2.22. Average Selling Prices (ASPs) Forecast
- 2.23. NAND Capex Forecast By Company
- 2.24. China Manufacturing Capacity
- 2.25. Chinese Equipment Suppliers And Top Foreign Supplier
- 2-26. China's 8- And 12-Inch Fabs and Foundries
- 3.1. AMHS Market Forecast
- 3.2. CMP Market Forecast
- 3.3. Plasma Strip Market Forecast
- 3.4. Spray Processors Market Forecast
- 3.5. Wet Stations Market Forecast
- 3.6. ALD Market Forecast
- 3.7. Epitaxy Market Forecast
- 3.8. MOCVD Market Forecast
- 3.9. LPCVD (non-tube) Market Forecast
- 3.10. LPCVD (tube) Market Forecast
- 3.11. PECVD Market Forecast
- 3.12. PVD Market Forecast
- 3.13. Ion Implantation Market Forecast
- 3.14. Direct-Write E-Beam Lithography Market Forecast
- 3.15. Mask-Making Lithography Market Forecast
- 3.16. Steppers Market Forecast
- 3.17. Oxidation Market Forecast
- 3.18. Photoresist Processing (Track) Market Forecast
- 3.19. RTP Market Forecast
- 3.20. Dielectric Etch Market Forecast
- 3.21. Conductive Etch Market Forecast
- 3.22. Lithography Metrology Market Forecast
- 3.23. Thin-Film Metrology Market Forecast
- 3.24. Wafer Inspection and Defect Review Market Forecast
LIST OF FIGURES
- 1.1. Semiconductor Equipment Billings
- 2.1. China's IC Production Forecast
- 2.2. China's IC Consumption
- 2.3. China's IC Production/Consumption Ratio
- 2.4. IC Import to China
- 2.5. China's IC Supply/Demand
- 2.6. China's IC Fab Capacity
- 2.7. China's IC Fab Capacity by Region
- 2.8. China's IC Fab Capacity by Wafer Size
- 2.9. China's IC Fab Capacity by Geometry
- 2.10. China's IC Production by Application
- 3.1. AMHS Market Shares
- 3.2. CMP Market Shares
- 3.3. Plasma Strip Market Shares
- 3.4. Spray Processors Market Shares
- 3.5. Wet Stations Market Shares
- 3.6. ALD Market Shares
- 3.7. Epitaxy Market Shares
- 3.8. MOCVD Market Shares
- 3.9. LPCVD (non-tube) Market Shares
- 3.10. LPCVD (tube) Market Shares
- 3.11. PECVD Market Shares
- 3.12. PVD Market Shares
- 3.13. Ion Implantation Market Shares
- 3.14. Direct-Write E-Beam Lithography Market Shares
- 3.15. Mask-Making Lithography Market Shares
- 3.16. Steppers Market Shares
- 3.17. Oxidation Market Shares
- 3.18. Photoresist Processing (Track) Market Shares
- 3.19. RTP Market Shares
- 3.20. Dielectric Etch Market Shares
- 3.21. Conductive Etch Market Shares
- 3.22. Lithography Metrology Market Shares
- 3.23. Thin-Film Metrology Market Shares
- 3.24. Wafer Inspection and Defect Review Market Shares
 中国大陆半导体及设备市场:分析及製造趋势
 应用材料公司:目标市场竞争分析
 2026-2032年半导体密封用O型圈全球市场报告:竞争分析及区域机会
 半导体製造设备市场:2026-2032年全球预测(按设备类型、封装尺寸、应用产业、最终用户、分销和应用划分)
 半导体製造设备市场分析及预测(至2035年):依类型、产品、技术、组件、应用、材料类型、装置、製程、最终用户及製造阶段划分扫描电子显微镜维修服务市场:按服务类型、应用和最终用户划分,全球预测(2026-2032年)显微镜目镜筒市场:按类型、材料、分销管道、应用和最终用户划分,全球预测,2026-2032年等离子切割系统市场:按设备类型、晶圆尺寸、晶圆厚度、最终用户和应用划分,全球预测,2026-2032年生物洁净作业台市场按产品类型、应用和最终用户划分,全球预测(2026-2032年)冷冻肉切丁机市场按机器类型、自动化程度、产能、终端用户产业、应用和销售管道划分,全球预测(2026-2032年)