


 |
市场调查报告书
商品编码
1415333
旋装碳市场:材料类型、应用和最终用户划分 - 2024-2030 年全球预测Spin on Carbon Market by Material Type (Hot-temperature spin on carbon, Normal-temperature spin on carbon), Application (Logic Devices, Memory Devices, Photonics), End User - Global Forecast 2024-2030 |
||||||
※ 本网页内容可能与最新版本有所差异。详细情况请与我们联繫。
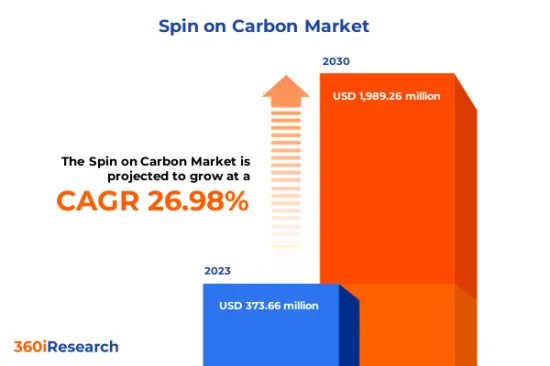
预计2023年旋装碳市场规模为3.7366亿美元,预计2024年将达4.7029亿美元,2030年将达19.8926亿美元,复合年增长率为26.98%。
全球旋涂碳市场
| 主要市场统计 | |
|---|---|
| 基准年[2023] | 37366万美元 |
| 预测年份 [2024] | 47029万美元 |
| 预测年份 [2030] | 1,989.26 百万美元 |
| 复合年增长率(%) | 26.98% |
旋涂碳是一种主要用于半导体产业的特殊材料。旋涂碳材料是使用旋涂技术涂布半导体晶圆的碳基涂层。该工艺包括将少量旋涂碳材料沉积到晶圆上,并以高速旋转晶圆形成薄而均匀的涂层。半导体製造中对更复杂晶片的需求不断增长,以及记忆体製造中极紫外光刻 (EUV) 的发展,正在推动旋涂碳材料的广泛采用。然而,由于先进的製造要求,开发和製造旋涂碳涂层的高成本可能会阻碍市场成长。也就是说,为满足不断变化的行业需求,旋涂碳材料配方的进步预计将为旋涂碳市场创造潜在机会。
区域洞察
由于反映材料科学和製造技术前沿研究的众多专利创新,旋涂碳市场正在美洲地区不断发展。此外,参与先进材料研究以及学术界和工业界之间的联合倡议正在带来碳基涂料的新应用和增强的性能,表明该地区旋涂碳市场的稳定增长。我是。欧洲、中东和非洲地区,包括欧盟国家以及中东和非洲,代表了一个充满活力和多样化的旋涂碳市场。在该地区严格的环境法规和对高品质製造标准的承诺的推动下,该地区不断上升的行动电话普及将带动未来消费电子製造业的区域发展,这可能会导致对半导体材料和相关半导体的需求增加材料。同时,对中东国家教育机构和高科技园区的投资正在为该地区的研发开闢新的途径。亚太地区的旋涂碳市场正在成长,其特点是对需要高等级半导体的家用电子电器的需求不断增加。这种成长激发了人们对旋涂碳等先进材料的兴趣,政府和私人实体正在投资半导体製造能力。
FPNV定位矩阵
FPNV定位矩阵对于评估旋装碳市场至关重要。我们检视与业务策略和产品满意度相关的关键指标,以对供应商进行全面评估。这种深入的分析使用户能够根据自己的要求做出明智的决策。根据评估,供应商被分为四个成功程度不同的像限。最前线 (F)、探路者 (P)、利基 (N) 和重要 (V)。
市场占有率分析
市场占有率分析是一种综合工具,可以对旋装碳市场供应商的现状进行深入而详细的研究。全面比较和分析供应商在整体收益、基本客群和其他关键指标方面的贡献,以便更好地了解公司的绩效及其在争夺市场占有率时面临的挑战。此外,该分析还提供了对该行业竞争特征的宝贵考察,包括在研究基准年观察到的累积、分散主导地位和合併特征等因素。这种详细程度的提高使供应商能够做出更明智的决策并制定有效的策略,从而在市场上获得竞争优势。
本报告在以下方面提供了宝贵的见解:
1-市场渗透率:提供有关主要企业所服务的市场的全面资讯。
2-市场开拓:我们深入研究利润丰厚的新兴市场,并分析它们在成熟细分市场中的渗透率。
3- 市场多元化:提供有关新产品发布、开拓地区、最新发展和投资的详细资讯。
4-竞争力评估与资讯:对主要企业的市场占有率、策略、产品、认证、监管状况、专利状况、製造能力等进行全面评估。
5- 产品开发与创新:提供对未来技术、研发活动和突破性产品开发的见解。
本报告解决了以下关键问题:
1-旋装碳市场的市场规模与预测是多少?
2-旋装碳市场预测期间需要考虑投资的产品、细分市场、应用和领域有哪些?
3-旋装碳市场的技术趋势和法律规范是什么?
4-旋装碳市场主要供应商的市场占有率是多少?
5-进入旋装碳市场合适的型态和策略手段是什么?
目录
第一章 前言
第二章调查方法
第三章执行摘要
第四章市场概况
第五章市场洞察
- 市场动态
- 促进因素
- 记忆体製造中极紫外光微影(EUV)的发展
- 半导体製造对更先进晶片的需求不断增加
- 抑制因素
- 开发和製造旋涂碳涂层以及采购替代材料的成本高昂
- 机会
- 电子产品日益小型化以及对 MEMS 涂层性能的要求越来越高
- 物联网的扩展以及对先进穿戴式装置和智慧型装置的需求
- 任务
- 将旋涂碳层与现有製造流程整合相关的技术挑战
- 促进因素
- 市场区隔分析
- 材料类型:高温旋涂碳 (HTC) 在高温製程的重要用途
- 应用:由于旋涂碳能够承受高能量等电浆蚀刻,因此其在电动设备中的使用正在迅速增加。
- 最终用户:整合设备製造商不断发展旋涂碳材料的使用
- 市场趋势分析
- 高通膨的累积效应
- 波特五力分析
- 价值炼和关键路径分析
- 法律规范
第六章旋装碳市场:依材料类型
- 介绍
- 高温旋涂碳
- 常温旋涂碳
第七章 旋装碳市场:依应用分类
- 介绍
- 逻辑装置
- 记忆设备
- 光电
- 电动设备
第 8 章 旋装碳市场:依最终用户分类
- 介绍
- 铸造厂
- 综合设备製造商
- 半导体组装和测试委託
第 9 章 美洲旋装碳市场
- 介绍
- 阿根廷
- 巴西
- 加拿大
- 墨西哥
- 美国
第10章亚太旋装碳市场
- 介绍
- 澳洲
- 中国
- 印度
- 印尼
- 日本
- 马来西亚
- 菲律宾
- 新加坡
- 韩国
- 台湾
- 泰国
- 越南
第十一章 欧洲、中东和非洲的旋转碳市场
- 介绍
- 丹麦
- 埃及
- 芬兰
- 法国
- 德国
- 以色列
- 义大利
- 荷兰
- 奈及利亚
- 挪威
- 波兰
- 卡达
- 俄罗斯
- 沙乌地阿拉伯
- 南非
- 西班牙
- 瑞典
- 瑞士
- 土耳其
- 阿拉伯聯合大公国
- 英国
第十二章竞争形势
- FPNV定位矩阵
- 市场占有率分析:主要企业
- 主要企业竞争情境分析
- 合约、合作和伙伴关係
- 新产品发布和功能增强
第13章竞争产品组合
- 主要公司简介
- Applied Materials, Inc.
- Brewer Science, Inc.
- Dongjin Semichem Co., Ltd.
- DuPont de Nemours, Inc.
- HDC YoungChang
- Hydraquip
- INBRAIN Neuroelectronics SL
- Irresistible Materials Ltd.
- JSR Micro Inc
- Kayaku Advanced Materials, Inc.
- KOYJ CO.,LTD
- Merck KGaA
- Nano-C Inc.
- Pibond Oy
- Samsung SDI Co., Ltd.
- Shin-Etsu Chemical Co., Ltd.
- YCCHEM CO.,Ltd.
- 主要产品系列
第十四章附录
- 讨论指南
- 关于许可证和定价
[184 Pages Report] The Spin on Carbon Market size was estimated at USD 373.66 million in 2023 and expected to reach USD 470.29 million in 2024, at a CAGR 26.98% to reach USD 1,989.26 million by 2030.
Global Spin on Carbon Market
| KEY MARKET STATISTICS | |
|---|---|
| Base Year [2023] | USD 373.66 million |
| Estimated Year [2024] | USD 470.29 million |
| Forecast Year [2030] | USD 1,989.26 million |
| CAGR (%) | 26.98% |
Spin on Carbon is a specialized class of materials used predominantly in the semiconductor industry. SoC materials are carbon-based coatings that are applied to semiconductor wafers using a spin-coating technique. This process involves depositing a small amount of SOC material onto the wafer and then spinning the wafer at high speed to achieve a thin, uniform coating. The growing demand for more sophisticated chips for semiconductor production and the development of extreme ultraviolet lithography (EUV) in memory manufacturing increases the adoption of the spin-on carbon material. However, the high costs involved in developing and manufacturing SoC coatings due to sophisticated production requirements may hinder market growth. Nevertheless, advancement in SoC material formulations to cater to evolving industry needs is expected to create potential opportunities for the SoC market.
Regional Insights
The Spin on Carbon (SoC) market is evolving in Americas region owing to the innovation with numerous patents reflecting pioneering work in material science and fabrication techniques. In addition, involvement in the research of advanced materials and collaborative initiatives between academia and industry are resulting in new applications and enhanced properties of carbon-based coatings, presenting a steady growth in the spin-on carbon market in this region. The EMEA region, including the European Union countries, the Middle East, and Africa, shows a dynamic and diverse market for spin-on carbon, driven by the region's stringent environmental regulations and commitment to high-quality manufacturing standards and the region has seen increased mobile penetration rates which may in the future translate to local developments in the consumer electronics manufacturing sector and subsequent demand for semiconductor materials. On the other hand, in Middle Eastern countries, investments in educational institutes and high-tech parks are opening up new avenues for research and development in the region. The Asia-Pacific region is witnessing growth in the Spin on Carbon market, characterized by a growing demand for consumer electronics that require high-grade semiconductors. This upsurge stimulates interest in advanced materials, such as spin on carbon, with government and private entities investing in semiconductor manufacturing capabilities.
FPNV Positioning Matrix
The FPNV Positioning Matrix is pivotal in evaluating the Spin on Carbon Market. It offers a comprehensive assessment of vendors, examining key metrics related to Business Strategy and Product Satisfaction. This in-depth analysis empowers users to make well-informed decisions aligned with their requirements. Based on the evaluation, the vendors are then categorized into four distinct quadrants representing varying levels of success: Forefront (F), Pathfinder (P), Niche (N), or Vital (V).
Market Share Analysis
The Market Share Analysis is a comprehensive tool that provides an insightful and in-depth examination of the current state of vendors in the Spin on Carbon Market. By meticulously comparing and analyzing vendor contributions in terms of overall revenue, customer base, and other key metrics, we can offer companies a greater understanding of their performance and the challenges they face when competing for market share. Additionally, this analysis provides valuable insights into the competitive nature of the sector, including factors such as accumulation, fragmentation dominance, and amalgamation traits observed over the base year period studied. With this expanded level of detail, vendors can make more informed decisions and devise effective strategies to gain a competitive edge in the market.
Key Company Profiles
The report delves into recent significant developments in the Spin on Carbon Market, highlighting leading vendors and their innovative profiles. These include Applied Materials, Inc., Brewer Science, Inc., Dongjin Semichem Co., Ltd., DuPont de Nemours, Inc., HDC YoungChang, Hydraquip, INBRAIN Neuroelectronics SL, Irresistible Materials Ltd., JSR Micro Inc, Kayaku Advanced Materials, Inc., KOYJ CO.,LTD, Merck KGaA, Nano-C Inc., Pibond Oy, Samsung SDI Co., Ltd., Shin-Etsu Chemical Co., Ltd., and YCCHEM CO.,Ltd..
Market Segmentation & Coverage
This research report categorizes the Spin on Carbon Market to forecast the revenues and analyze trends in each of the following sub-markets:
- Material Type
- Hot-temperature spin on carbon
- Normal-temperature spin on carbon
- Application
- Logic Devices
- Memory Devices
- Photonics
- Power Devices
- End User
- Foundries
- Integrated Device Manufacturers
- Outsourced Semiconductor Assembly & Test
- Region
- Americas
- Argentina
- Brazil
- Canada
- Mexico
- United States
- California
- Florida
- Illinois
- New York
- Ohio
- Pennsylvania
- Texas
- Asia-Pacific
- Australia
- China
- India
- Indonesia
- Japan
- Malaysia
- Philippines
- Singapore
- South Korea
- Taiwan
- Thailand
- Vietnam
- Europe, Middle East & Africa
- Denmark
- Egypt
- Finland
- France
- Germany
- Israel
- Italy
- Netherlands
- Nigeria
- Norway
- Poland
- Qatar
- Russia
- Saudi Arabia
- South Africa
- Spain
- Sweden
- Switzerland
- Turkey
- United Arab Emirates
- United Kingdom
- Americas
The report offers valuable insights on the following aspects:
1. Market Penetration: It presents comprehensive information on the market provided by key players.
2. Market Development: It delves deep into lucrative emerging markets and analyzes the penetration across mature market segments.
3. Market Diversification: It provides detailed information on new product launches, untapped geographic regions, recent developments, and investments.
4. Competitive Assessment & Intelligence: It conducts an exhaustive assessment of market shares, strategies, products, certifications, regulatory approvals, patent landscape, and manufacturing capabilities of the leading players.
5. Product Development & Innovation: It offers intelligent insights on future technologies, R&D activities, and breakthrough product developments.
The report addresses key questions such as:
1. What is the market size and forecast of the Spin on Carbon Market?
2. Which products, segments, applications, and areas should one consider investing in over the forecast period in the Spin on Carbon Market?
3. What are the technology trends and regulatory frameworks in the Spin on Carbon Market?
4. What is the market share of the leading vendors in the Spin on Carbon Market?
5. Which modes and strategic moves are suitable for entering the Spin on Carbon Market?
Table of Contents
1. Preface
- 1.1. Objectives of the Study
- 1.2. Market Segmentation & Coverage
- 1.3. Years Considered for the Study
- 1.4. Currency & Pricing
- 1.5. Language
- 1.6. Limitations
- 1.7. Assumptions
- 1.8. Stakeholders
2. Research Methodology
- 2.1. Define: Research Objective
- 2.2. Determine: Research Design
- 2.3. Prepare: Research Instrument
- 2.4. Collect: Data Source
- 2.5. Analyze: Data Interpretation
- 2.6. Formulate: Data Verification
- 2.7. Publish: Research Report
- 2.8. Repeat: Report Update
3. Executive Summary
4. Market Overview
- 4.1. Introduction
- 4.2. Spin on Carbon Market, by Region
5. Market Insights
- 5.1. Market Dynamics
- 5.1.1. Drivers
- 5.1.1.1. Development of extreme ultraviolet lithography (EUV) in memory manufacturing
- 5.1.1.2. Growing demand for more sophisticated chips for semiconductor production
- 5.1.2. Restraints
- 5.1.2.1. High costs involved in the development and manufacturing of SoC coatings and availability of substitute materials
- 5.1.3. Opportunities
- 5.1.3.1. Increrasing miniaturization of electronic devices and the requirement for better performance coatings in MEMS
- 5.1.3.2. Expansion of the IoT and the need for sophisticated wearables and smart devices
- 5.1.4. Challenges
- 5.1.4.1. Technical challenges associated with the integration of SOC layers with existing manufacturing processes
- 5.1.1. Drivers
- 5.2. Market Segmentation Analysis
- 5.2.1. Material Type: Significant usage of hot-temperature spin on carbon (HTC) in high-temperature processes
- 5.2.2. Application: Burgeoning utilization of SoC in power devices owing to its capability to endure high-energy plasma etches
- 5.2.3. End User: Evolving utilization of spin on carbon material by integrated device manufacturers
- 5.3. Market Trend Analysis
- 5.4. Cumulative Impact of High Inflation
- 5.5. Porter's Five Forces Analysis
- 5.5.1. Threat of New Entrants
- 5.5.2. Threat of Substitutes
- 5.5.3. Bargaining Power of Customers
- 5.5.4. Bargaining Power of Suppliers
- 5.5.5. Industry Rivalry
- 5.6. Value Chain & Critical Path Analysis
- 5.7. Regulatory Framework
6. Spin on Carbon Market, by Material Type
- 6.1. Introduction
- 6.2. Hot-temperature spin on carbon
- 6.3. Normal-temperature spin on carbon
7. Spin on Carbon Market, by Application
- 7.1. Introduction
- 7.2. Logic Devices
- 7.3. Memory Devices
- 7.4. Photonics
- 7.5. Power Devices
8. Spin on Carbon Market, by End User
- 8.1. Introduction
- 8.2. Foundries
- 8.3. Integrated Device Manufacturers
- 8.4. Outsourced Semiconductor Assembly & Test
9. Americas Spin on Carbon Market
- 9.1. Introduction
- 9.2. Argentina
- 9.3. Brazil
- 9.4. Canada
- 9.5. Mexico
- 9.6. United States
10. Asia-Pacific Spin on Carbon Market
- 10.1. Introduction
- 10.2. Australia
- 10.3. China
- 10.4. India
- 10.5. Indonesia
- 10.6. Japan
- 10.7. Malaysia
- 10.8. Philippines
- 10.9. Singapore
- 10.10. South Korea
- 10.11. Taiwan
- 10.12. Thailand
- 10.13. Vietnam
11. Europe, Middle East & Africa Spin on Carbon Market
- 11.1. Introduction
- 11.2. Denmark
- 11.3. Egypt
- 11.4. Finland
- 11.5. France
- 11.6. Germany
- 11.7. Israel
- 11.8. Italy
- 11.9. Netherlands
- 11.10. Nigeria
- 11.11. Norway
- 11.12. Poland
- 11.13. Qatar
- 11.14. Russia
- 11.15. Saudi Arabia
- 11.16. South Africa
- 11.17. Spain
- 11.18. Sweden
- 11.19. Switzerland
- 11.20. Turkey
- 11.21. United Arab Emirates
- 11.22. United Kingdom
12. Competitive Landscape
- 12.1. FPNV Positioning Matrix
- 12.2. Market Share Analysis, By Key Player
- 12.3. Competitive Scenario Analysis, By Key Player
- 12.3.1. Agreement, Collaboration, & Partnership
- 12.3.1.1. Coburn Technologies and SDC Technologies Announce the Launch of a Breakthrough Photochromic System for Optical Labs
- 12.3.2. New Product Launch & Enhancement
- 12.3.2.1. Lam Research launches Coronus DX to facilitate advanced wafer semiconductor manufacturing
- 12.3.1. Agreement, Collaboration, & Partnership
13. Competitive Portfolio
- 13.1. Key Company Profiles
- 13.1.1. Applied Materials, Inc.
- 13.1.2. Brewer Science, Inc.
- 13.1.3. Dongjin Semichem Co., Ltd.
- 13.1.4. DuPont de Nemours, Inc.
- 13.1.5. HDC YoungChang
- 13.1.6. Hydraquip
- 13.1.7. INBRAIN Neuroelectronics SL
- 13.1.8. Irresistible Materials Ltd.
- 13.1.9. JSR Micro Inc
- 13.1.10. Kayaku Advanced Materials, Inc.
- 13.1.11. KOYJ CO.,LTD
- 13.1.12. Merck KGaA
- 13.1.13. Nano-C Inc.
- 13.1.14. Pibond Oy
- 13.1.15. Samsung SDI Co., Ltd.
- 13.1.16. Shin-Etsu Chemical Co., Ltd.
- 13.1.17. YCCHEM CO.,Ltd.
- 13.2. Key Product Portfolio
14. Appendix
- 14.1. Discussion Guide
- 14.2. License & Pricing
LIST OF FIGURES
- FIGURE 1. SPIN ON CARBON MARKET RESEARCH PROCESS
- FIGURE 2. SPIN ON CARBON MARKET SIZE, 2023 VS 2030
- FIGURE 3. SPIN ON CARBON MARKET SIZE, 2018-2030 (USD MILLION)
- FIGURE 4. SPIN ON CARBON MARKET SIZE, BY REGION, 2023 VS 2030 (%)
- FIGURE 5. SPIN ON CARBON MARKET SIZE, BY REGION, 2023 VS 2024 VS 2030 (USD MILLION)
- FIGURE 6. SPIN ON CARBON MARKET DYNAMICS
- FIGURE 7. SPIN ON CARBON MARKET SIZE, BY MATERIAL TYPE, 2023 VS 2030 (%)
- FIGURE 8. SPIN ON CARBON MARKET SIZE, BY MATERIAL TYPE, 2023 VS 2024 VS 2030 (USD MILLION)
- FIGURE 9. SPIN ON CARBON MARKET SIZE, BY APPLICATION, 2023 VS 2030 (%)
- FIGURE 10. SPIN ON CARBON MARKET SIZE, BY APPLICATION, 2023 VS 2024 VS 2030 (USD MILLION)
- FIGURE 11. SPIN ON CARBON MARKET SIZE, BY END USER, 2023 VS 2030 (%)
- FIGURE 12. SPIN ON CARBON MARKET SIZE, BY END USER, 2023 VS 2024 VS 2030 (USD MILLION)
- FIGURE 13. AMERICAS SPIN ON CARBON MARKET SIZE, BY COUNTRY, 2023 VS 2030 (%)
- FIGURE 14. AMERICAS SPIN ON CARBON MARKET SIZE, BY COUNTRY, 2023 VS 2024 VS 2030 (USD MILLION)
- FIGURE 15. UNITED STATES SPIN ON CARBON MARKET SIZE, BY STATE, 2023 VS 2030 (%)
- FIGURE 16. UNITED STATES SPIN ON CARBON MARKET SIZE, BY STATE, 2023 VS 2024 VS 2030 (USD MILLION)
- FIGURE 17. ASIA-PACIFIC SPIN ON CARBON MARKET SIZE, BY COUNTRY, 2023 VS 2030 (%)
- FIGURE 18. ASIA-PACIFIC SPIN ON CARBON MARKET SIZE, BY COUNTRY, 2023 VS 2024 VS 2030 (USD MILLION)
- FIGURE 19. EUROPE, MIDDLE EAST & AFRICA SPIN ON CARBON MARKET SIZE, BY COUNTRY, 2023 VS 2030 (%)
- FIGURE 20. EUROPE, MIDDLE EAST & AFRICA SPIN ON CARBON MARKET SIZE, BY COUNTRY, 2023 VS 2024 VS 2030 (USD MILLION)
- FIGURE 21. SPIN ON CARBON MARKET, FPNV POSITIONING MATRIX, 2023
- FIGURE 22. SPIN ON CARBON MARKET SHARE, BY KEY PLAYER, 2023
LIST OF TABLES
- TABLE 1. SPIN ON CARBON MARKET SEGMENTATION & COVERAGE
- TABLE 2. UNITED STATES DOLLAR EXCHANGE RATE, 2018-2023
- TABLE 3. SPIN ON CARBON MARKET SIZE, 2018-2030 (USD MILLION)
- TABLE 4. GLOBAL SPIN ON CARBON MARKET SIZE, BY REGION, 2018-2030 (USD MILLION)
- TABLE 5. SPIN ON CARBON MARKET SIZE, BY MATERIAL TYPE, 2018-2030 (USD MILLION)
- TABLE 6. SPIN ON CARBON MARKET SIZE, BY HOT-TEMPERATURE SPIN ON CARBON, BY REGION, 2018-2030 (USD MILLION)
- TABLE 7. SPIN ON CARBON MARKET SIZE, BY NORMAL-TEMPERATURE SPIN ON CARBON, BY REGION, 2018-2030 (USD MILLION)
- TABLE 8. SPIN ON CARBON MARKET SIZE, BY APPLICATION, 2018-2030 (USD MILLION)
- TABLE 9. SPIN ON CARBON MARKET SIZE, BY LOGIC DEVICES, BY REGION, 2018-2030 (USD MILLION)
- TABLE 10. SPIN ON CARBON MARKET SIZE, BY MEMORY DEVICES, BY REGION, 2018-2030 (USD MILLION)
- TABLE 11. SPIN ON CARBON MARKET SIZE, BY PHOTONICS, BY REGION, 2018-2030 (USD MILLION)
- TABLE 12. SPIN ON CARBON MARKET SIZE, BY POWER DEVICES, BY REGION, 2018-2030 (USD MILLION)
- TABLE 13. SPIN ON CARBON MARKET SIZE, BY END USER, 2018-2030 (USD MILLION)
- TABLE 14. SPIN ON CARBON MARKET SIZE, BY FOUNDRIES, BY REGION, 2018-2030 (USD MILLION)
- TABLE 15. SPIN ON CARBON MARKET SIZE, BY INTEGRATED DEVICE MANUFACTURERS, BY REGION, 2018-2030 (USD MILLION)
- TABLE 16. SPIN ON CARBON MARKET SIZE, BY OUTSOURCED SEMICONDUCTOR ASSEMBLY & TEST, BY REGION, 2018-2030 (USD MILLION)
- TABLE 17. AMERICAS SPIN ON CARBON MARKET SIZE, BY MATERIAL TYPE, 2018-2030 (USD MILLION)
- TABLE 18. AMERICAS SPIN ON CARBON MARKET SIZE, BY APPLICATION, 2018-2030 (USD MILLION)
- TABLE 19. AMERICAS SPIN ON CARBON MARKET SIZE, BY END USER, 2018-2030 (USD MILLION)
- TABLE 20. AMERICAS SPIN ON CARBON MARKET SIZE, BY COUNTRY, 2018-2030 (USD MILLION)
- TABLE 21. ARGENTINA SPIN ON CARBON MARKET SIZE, BY MATERIAL TYPE, 2018-2030 (USD MILLION)
- TABLE 22. ARGENTINA SPIN ON CARBON MARKET SIZE, BY APPLICATION, 2018-2030 (USD MILLION)
- TABLE 23. ARGENTINA SPIN ON CARBON MARKET SIZE, BY END USER, 2018-2030 (USD MILLION)
- TABLE 24. BRAZIL SPIN ON CARBON MARKET SIZE, BY MATERIAL TYPE, 2018-2030 (USD MILLION)
- TABLE 25. BRAZIL SPIN ON CARBON MARKET SIZE, BY APPLICATION, 2018-2030 (USD MILLION)
- TABLE 26. BRAZIL SPIN ON CARBON MARKET SIZE, BY END USER, 2018-2030 (USD MILLION)
- TABLE 27. CANADA SPIN ON CARBON MARKET SIZE, BY MATERIAL TYPE, 2018-2030 (USD MILLION)
- TABLE 28. CANADA SPIN ON CARBON MARKET SIZE, BY APPLICATION, 2018-2030 (USD MILLION)
- TABLE 29. CANADA SPIN ON CARBON MARKET SIZE, BY END USER, 2018-2030 (USD MILLION)
- TABLE 30. MEXICO SPIN ON CARBON MARKET SIZE, BY MATERIAL TYPE, 2018-2030 (USD MILLION)
- TABLE 31. MEXICO SPIN ON CARBON MARKET SIZE, BY APPLICATION, 2018-2030 (USD MILLION)
- TABLE 32. MEXICO SPIN ON CARBON MARKET SIZE, BY END USER, 2018-2030 (USD MILLION)
- TABLE 33. UNITED STATES SPIN ON CARBON MARKET SIZE, BY MATERIAL TYPE, 2018-2030 (USD MILLION)
- TABLE 34. UNITED STATES SPIN ON CARBON MARKET SIZE, BY APPLICATION, 2018-2030 (USD MILLION)
- TABLE 35. UNITED STATES SPIN ON CARBON MARKET SIZE, BY END USER, 2018-2030 (USD MILLION)
- TABLE 36. UNITED STATES SPIN ON CARBON MARKET SIZE, BY STATE, 2018-2030 (USD MILLION)
- TABLE 37. ASIA-PACIFIC SPIN ON CARBON MARKET SIZE, BY MATERIAL TYPE, 2018-2030 (USD MILLION)
- TABLE 38. ASIA-PACIFIC SPIN ON CARBON MARKET SIZE, BY APPLICATION, 2018-2030 (USD MILLION)
- TABLE 39. ASIA-PACIFIC SPIN ON CARBON MARKET SIZE, BY END USER, 2018-2030 (USD MILLION)
- TABLE 40. ASIA-PACIFIC SPIN ON CARBON MARKET SIZE, BY COUNTRY, 2018-2030 (USD MILLION)
- TABLE 41. AUSTRALIA SPIN ON CARBON MARKET SIZE, BY MATERIAL TYPE, 2018-2030 (USD MILLION)
- TABLE 42. AUSTRALIA SPIN ON CARBON MARKET SIZE, BY APPLICATION, 2018-2030 (USD MILLION)
- TABLE 43. AUSTRALIA SPIN ON CARBON MARKET SIZE, BY END USER, 2018-2030 (USD MILLION)
- TABLE 44. CHINA SPIN ON CARBON MARKET SIZE, BY MATERIAL TYPE, 2018-2030 (USD MILLION)
- TABLE 45. CHINA SPIN ON CARBON MARKET SIZE, BY APPLICATION, 2018-2030 (USD MILLION)
- TABLE 46. CHINA SPIN ON CARBON MARKET SIZE, BY END USER, 2018-2030 (USD MILLION)
- TABLE 47. INDIA SPIN ON CARBON MARKET SIZE, BY MATERIAL TYPE, 2018-2030 (USD MILLION)
- TABLE 48. INDIA SPIN ON CARBON MARKET SIZE, BY APPLICATION, 2018-2030 (USD MILLION)
- TABLE 49. INDIA SPIN ON CARBON MARKET SIZE, BY END USER, 2018-2030 (USD MILLION)
- TABLE 50. INDONESIA SPIN ON CARBON MARKET SIZE, BY MATERIAL TYPE, 2018-2030 (USD MILLION)
- TABLE 51. INDONESIA SPIN ON CARBON MARKET SIZE, BY APPLICATION, 2018-2030 (USD MILLION)
- TABLE 52. INDONESIA SPIN ON CARBON MARKET SIZE, BY END USER, 2018-2030 (USD MILLION)
- TABLE 53. JAPAN SPIN ON CARBON MARKET SIZE, BY MATERIAL TYPE, 2018-2030 (USD MILLION)
- TABLE 54. JAPAN SPIN ON CARBON MARKET SIZE, BY APPLICATION, 2018-2030 (USD MILLION)
- TABLE 55. JAPAN SPIN ON CARBON MARKET SIZE, BY END USER, 2018-2030 (USD MILLION)
- TABLE 56. MALAYSIA SPIN ON CARBON MARKET SIZE, BY MATERIAL TYPE, 2018-2030 (USD MILLION)
- TABLE 57. MALAYSIA SPIN ON CARBON MARKET SIZE, BY APPLICATION, 2018-2030 (USD MILLION)
- TABLE 58. MALAYSIA SPIN ON CARBON MARKET SIZE, BY END USER, 2018-2030 (USD MILLION)
- TABLE 59. PHILIPPINES SPIN ON CARBON MARKET SIZE, BY MATERIAL TYPE, 2018-2030 (USD MILLION)
- TABLE 60. PHILIPPINES SPIN ON CARBON MARKET SIZE, BY APPLICATION, 2018-2030 (USD MILLION)
- TABLE 61. PHILIPPINES SPIN ON CARBON MARKET SIZE, BY END USER, 2018-2030 (USD MILLION)
- TABLE 62. SINGAPORE SPIN ON CARBON MARKET SIZE, BY MATERIAL TYPE, 2018-2030 (USD MILLION)
- TABLE 63. SINGAPORE SPIN ON CARBON MARKET SIZE, BY APPLICATION, 2018-2030 (USD MILLION)
- TABLE 64. SINGAPORE SPIN ON CARBON MARKET SIZE, BY END USER, 2018-2030 (USD MILLION)
- TABLE 65. SOUTH KOREA SPIN ON CARBON MARKET SIZE, BY MATERIAL TYPE, 2018-2030 (USD MILLION)
- TABLE 66. SOUTH KOREA SPIN ON CARBON MARKET SIZE, BY APPLICATION, 2018-2030 (USD MILLION)
- TABLE 67. SOUTH KOREA SPIN ON CARBON MARKET SIZE, BY END USER, 2018-2030 (USD MILLION)
- TABLE 68. TAIWAN SPIN ON CARBON MARKET SIZE, BY MATERIAL TYPE, 2018-2030 (USD MILLION)
- TABLE 69. TAIWAN SPIN ON CARBON MARKET SIZE, BY APPLICATION, 2018-2030 (USD MILLION)
- TABLE 70. TAIWAN SPIN ON CARBON MARKET SIZE, BY END USER, 2018-2030 (USD MILLION)
- TABLE 71. THAILAND SPIN ON CARBON MARKET SIZE, BY MATERIAL TYPE, 2018-2030 (USD MILLION)
- TABLE 72. THAILAND SPIN ON CARBON MARKET SIZE, BY APPLICATION, 2018-2030 (USD MILLION)
- TABLE 73. THAILAND SPIN ON CARBON MARKET SIZE, BY END USER, 2018-2030 (USD MILLION)
- TABLE 74. VIETNAM SPIN ON CARBON MARKET SIZE, BY MATERIAL TYPE, 2018-2030 (USD MILLION)
- TABLE 75. VIETNAM SPIN ON CARBON MARKET SIZE, BY APPLICATION, 2018-2030 (USD MILLION)
- TABLE 76. VIETNAM SPIN ON CARBON MARKET SIZE, BY END USER, 2018-2030 (USD MILLION)
- TABLE 77. EUROPE, MIDDLE EAST & AFRICA SPIN ON CARBON MARKET SIZE, BY MATERIAL TYPE, 2018-2030 (USD MILLION)
- TABLE 78. EUROPE, MIDDLE EAST & AFRICA SPIN ON CARBON MARKET SIZE, BY APPLICATION, 2018-2030 (USD MILLION)
- TABLE 79. EUROPE, MIDDLE EAST & AFRICA SPIN ON CARBON MARKET SIZE, BY END USER, 2018-2030 (USD MILLION)
- TABLE 80. EUROPE, MIDDLE EAST & AFRICA SPIN ON CARBON MARKET SIZE, BY COUNTRY, 2018-2030 (USD MILLION)
- TABLE 81. DENMARK SPIN ON CARBON MARKET SIZE, BY MATERIAL TYPE, 2018-2030 (USD MILLION)
- TABLE 82. DENMARK SPIN ON CARBON MARKET SIZE, BY APPLICATION, 2018-2030 (USD MILLION)
- TABLE 83. DENMARK SPIN ON CARBON MARKET SIZE, BY END USER, 2018-2030 (USD MILLION)
- TABLE 84. EGYPT SPIN ON CARBON MARKET SIZE, BY MATERIAL TYPE, 2018-2030 (USD MILLION)
- TABLE 85. EGYPT SPIN ON CARBON MARKET SIZE, BY APPLICATION, 2018-2030 (USD MILLION)
- TABLE 86. EGYPT SPIN ON CARBON MARKET SIZE, BY END USER, 2018-2030 (USD MILLION)
- TABLE 87. FINLAND SPIN ON CARBON MARKET SIZE, BY MATERIAL TYPE, 2018-2030 (USD MILLION)
- TABLE 88. FINLAND SPIN ON CARBON MARKET SIZE, BY APPLICATION, 2018-2030 (USD MILLION)
- TABLE 89. FINLAND SPIN ON CARBON MARKET SIZE, BY END USER, 2018-2030 (USD MILLION)
- TABLE 90. FRANCE SPIN ON CARBON MARKET SIZE, BY MATERIAL TYPE, 2018-2030 (USD MILLION)
- TABLE 91. FRANCE SPIN ON CARBON MARKET SIZE, BY APPLICATION, 2018-2030 (USD MILLION)
- TABLE 92. FRANCE SPIN ON CARBON MARKET SIZE, BY END USER, 2018-2030 (USD MILLION)
- TABLE 93. GERMANY SPIN ON CARBON MARKET SIZE, BY MATERIAL TYPE, 2018-2030 (USD MILLION)
- TABLE 94. GERMANY SPIN ON CARBON MARKET SIZE, BY APPLICATION, 2018-2030 (USD MILLION)
- TABLE 95. GERMANY SPIN ON CARBON MARKET SIZE, BY END USER, 2018-2030 (USD MILLION)
- TABLE 96. ISRAEL SPIN ON CARBON MARKET SIZE, BY MATERIAL TYPE, 2018-2030 (USD MILLION)
- TABLE 97. ISRAEL SPIN ON CARBON MARKET SIZE, BY APPLICATION, 2018-2030 (USD MILLION)
- TABLE 98. ISRAEL SPIN ON CARBON MARKET SIZE, BY END USER, 2018-2030 (USD MILLION)
- TABLE 99. ITALY SPIN ON CARBON MARKET SIZE, BY MATERIAL TYPE, 2018-2030 (USD MILLION)
- TABLE 100. ITALY SPIN ON CARBON MARKET SIZE, BY APPLICATION, 2018-2030 (USD MILLION)
- TABLE 101. ITALY SPIN ON CARBON MARKET SIZE, BY END USER, 2018-2030 (USD MILLION)
- TABLE 102. NETHERLANDS SPIN ON CARBON MARKET SIZE, BY MATERIAL TYPE, 2018-2030 (USD MILLION)
- TABLE 103. NETHERLANDS SPIN ON CARBON MARKET SIZE, BY APPLICATION, 2018-2030 (USD MILLION)
- TABLE 104. NETHERLANDS SPIN ON CARBON MARKET SIZE, BY END USER, 2018-2030 (USD MILLION)
- TABLE 105. NIGERIA SPIN ON CARBON MARKET SIZE, BY MATERIAL TYPE, 2018-2030 (USD MILLION)
- TABLE 106. NIGERIA SPIN ON CARBON MARKET SIZE, BY APPLICATION, 2018-2030 (USD MILLION)
- TABLE 107. NIGERIA SPIN ON CARBON MARKET SIZE, BY END USER, 2018-2030 (USD MILLION)
- TABLE 108. NORWAY SPIN ON CARBON MARKET SIZE, BY MATERIAL TYPE, 2018-2030 (USD MILLION)
- TABLE 109. NORWAY SPIN ON CARBON MARKET SIZE, BY APPLICATION, 2018-2030 (USD MILLION)
- TABLE 110. NORWAY SPIN ON CARBON MARKET SIZE, BY END USER, 2018-2030 (USD MILLION)
- TABLE 111. POLAND SPIN ON CARBON MARKET SIZE, BY MATERIAL TYPE, 2018-2030 (USD MILLION)
- TABLE 112. POLAND SPIN ON CARBON MARKET SIZE, BY APPLICATION, 2018-2030 (USD MILLION)
- TABLE 113. POLAND SPIN ON CARBON MARKET SIZE, BY END USER, 2018-2030 (USD MILLION)
- TABLE 114. QATAR SPIN ON CARBON MARKET SIZE, BY MATERIAL TYPE, 2018-2030 (USD MILLION)
- TABLE 115. QATAR SPIN ON CARBON MARKET SIZE, BY APPLICATION, 2018-2030 (USD MILLION)
- TABLE 116. QATAR SPIN ON CARBON MARKET SIZE, BY END USER, 2018-2030 (USD MILLION)
- TABLE 117. RUSSIA SPIN ON CARBON MARKET SIZE, BY MATERIAL TYPE, 2018-2030 (USD MILLION)
- TABLE 118. RUSSIA SPIN ON CARBON MARKET SIZE, BY APPLICATION, 2018-2030 (USD MILLION)
- TABLE 119. RUSSIA SPIN ON CARBON MARKET SIZE, BY END USER, 2018-2030 (USD MILLION)
- TABLE 120. SAUDI ARABIA SPIN ON CARBON MARKET SIZE, BY MATERIAL TYPE, 2018-2030 (USD MILLION)
- TABLE 121. SAUDI ARABIA SPIN ON CARBON MARKET SIZE, BY APPLICATION, 2018-2030 (USD MILLION)
- TABLE 122. SAUDI ARABIA SPIN ON CARBON MARKET SIZE, BY END USER, 2018-2030 (USD MILLION)
- TABLE 123. SOUTH AFRICA SPIN ON CARBON MARKET SIZE, BY MATERIAL TYPE, 2018-2030 (USD MILLION)
- TABLE 124. SOUTH AFRICA SPIN ON CARBON MARKET SIZE, BY APPLICATION, 2018-2030 (USD MILLION)
- TABLE 125. SOUTH AFRICA SPIN ON CARBON MARKET SIZE, BY END USER, 2018-2030 (USD MILLION)
- TABLE 126. SPAIN SPIN ON CARBON MARKET SIZE, BY MATERIAL TYPE, 2018-2030 (USD MILLION)
- TABLE 127. SPAIN SPIN ON CARBON MARKET SIZE, BY APPLICATION, 2018-2030 (USD MILLION)
- TABLE 128. SPAIN SPIN ON CARBON MARKET SIZE, BY END USER, 2018-2030 (USD MILLION)
- TABLE 129. SWEDEN SPIN ON CARBON MARKET SIZE, BY MATERIAL TYPE, 2018-2030 (USD MILLION)
- TABLE 130. SWEDEN SPIN ON CARBON MARKET SIZE, BY APPLICATION, 2018-2030 (USD MILLION)
- TABLE 131. SWEDEN SPIN ON CARBON MARKET SIZE, BY END USER, 2018-2030 (USD MILLION)
- TABLE 132. SWITZERLAND SPIN ON CARBON MARKET SIZE, BY MATERIAL TYPE, 2018-2030 (USD MILLION)
- TABLE 133. SWITZERLAND SPIN ON CARBON MARKET SIZE, BY APPLICATION, 2018-2030 (USD MILLION)
- TABLE 134. SWITZERLAND SPIN ON CARBON MARKET SIZE, BY END USER, 2018-2030 (USD MILLION)
- TABLE 135. TURKEY SPIN ON CARBON MARKET SIZE, BY MATERIAL TYPE, 2018-2030 (USD MILLION)
- TABLE 136. TURKEY SPIN ON CARBON MARKET SIZE, BY APPLICATION, 2018-2030 (USD MILLION)
- TABLE 137. TURKEY SPIN ON CARBON MARKET SIZE, BY END USER, 2018-2030 (USD MILLION)
- TABLE 138. UNITED ARAB EMIRATES SPIN ON CARBON MARKET SIZE, BY MATERIAL TYPE, 2018-2030 (USD MILLION)
- TABLE 139. UNITED ARAB EMIRATES SPIN ON CARBON MARKET SIZE, BY APPLICATION, 2018-2030 (USD MILLION)
- TABLE 140. UNITED ARAB EMIRATES SPIN ON CARBON MARKET SIZE, BY END USER, 2018-2030 (USD MILLION)
- TABLE 141. UNITED KINGDOM SPIN ON CARBON MARKET SIZE, BY MATERIAL TYPE, 2018-2030 (USD MILLION)
- TABLE 142. UNITED KINGDOM SPIN ON CARBON MARKET SIZE, BY APPLICATION, 2018-2030 (USD MILLION)
- TABLE 143. UNITED KINGDOM SPIN ON CARBON MARKET SIZE, BY END USER, 2018-2030 (USD MILLION)
- TABLE 144. SPIN ON CARBON MARKET, FPNV POSITIONING MATRIX, 2023
- TABLE 145. SPIN ON CARBON MARKET SHARE, BY KEY PLAYER, 2023
- TABLE 146. SPIN ON CARBON MARKET LICENSE & PRICING
 全球多模式晶片组市场研究报告 - 2024 年至 2032 年产业分析、规模、份额、成长、趋势与预测
 多模晶片组市场(应用:智慧型手机、平板电脑、穿戴式装置等)- 2023-2031 年全球产业分析、规模、份额、成长、趋势与预测
 宽频通讯晶片组市场报告:2030 年趋势、预测与竞争分析
 投影机光处理晶片市场报告:2030 年趋势、预测与竞争分析
 窄频 PLC 晶片市场报告:2030 年趋势、预测与竞争分析
 全球旋装碳市场:按材料类型、按应用、按最终用户、按地区 - 预测至 2028 年
 Wi-Fi 晶片组市场 - 全球产业规模、份额、趋势、机会和预测,按类型、製造技术、晶片尺寸、按应用、地区、竞争细分,2018-2028 年
 多媒体晶片组市场 - 全球产业规模、份额、趋势、机会和预测,按类型、按应用、最终用户、地区、竞争细分,2018-2028 年
 数位光处理技术市场报告:2030 年趋势、预测与竞争分析
 物联网芯片组和物联网模块的趋势:2023 年