


 |
市场调查报告书
商品编码
1500643
通讯API的全球市场:2024-2029年Global Telecommunications API Market: 2024-2029 |
||||||
| 主要统计 | |
|---|---|
| 2024年的经营者总收益: | 509亿美元 |
| 2029年的经营者总收益: | 1,595亿美元 |
| 2024~2029年的市场成长率: | 213% |
| 预测期间: | 2024-2029年 |
本调查套件调查了全球电信API 市场,包括主要市场驱动因素和挑战,API 呼叫量和运营商收入的趋势和预测,按类别和地区/主要国家/地区进行的详细分析,整理各大厂商的竞争排行榜等
主要的特征
- 市场动态:评估了未来市场成长的关键驱动因素,包括 GSMA 开放网关和 CAMARA 专案等全球计画在为应用程式开发人员提供网路功能存取方面的作用。还涵盖了市场动态,例如市场显着成长必须克服的关键挑战,例如可扩展性和确保服务品质。也调查了 CAMARA 专案提供的各种 API,研究了用于将这些服务收益化的好处、需求和商业模式。
- 要点/策略建议:深入分析了通讯 API 市场的主要发展机会、行业趋势和见解,并为利害关係人提供了关键策略建议。
- 基准产业预测:通讯API的市场规模和预测包括对通讯API的API呼叫总数和运营商总收入的五年预测。此预测按 API 类别进行分类。
- Juniper Research的竞争排行榜:透过 Juniper Research 竞争排行榜(分为通讯 API 供应商和网路管理 API 供应商)评估领先 API 供应商的实力和能力。
样本视图
市场资料&预测报告
Juniper Research,分类通讯API和网路管理API的供应商,报告主要的通讯API供应商趋势。
市场趋势、策略报告
目前的市场情势综合分析,进行策略性的建议。
市场资料&预测报告
本调查套件中,包括对一整套市场预测资料的存取,其中包含 30 个表格和 13,500 多个资料点。该调查套件包括以下指标:
- 通讯 API 呼叫总数
- 营运商透过通讯 API 呼叫获得的总收入
API类别:
- 装置身分和状态
- 行动诈欺预防
- 行动支付 API
- 网路连接
- 通讯
Juniper Research互动式预测(Excel)具有以下功能:
- 统计分析:可以搜寻资料期间所有地区和国家的特定指标。可以轻鬆修改图表并将其汇出到剪贴簿。
- 国家/地区资料工具:此工具可查看预测期间内的所有区域和国家指标。可以缩小搜寻列中显示的指标范围。
- 国家比较工具:可选择特定国家进行比较。该工具包括汇出图表的功能。
- 假设分析:透过五个互动式情境将预测指标与自己的假设进行比较。
目录
市场趋势/策略
第1章 要点/策略建议
- 要点
- 策略建议
第2章 未来市场展望
- 简介
- 未来市场展望
- API 服务收益化
- 未来市场发展面临的挑战
第3章 GSMA 开放式闸道与 CAMARA
- GSMA 开放网关
- CAMARA API:简介
- CAMARA 专案的范围
- CAMARA API 类型
- 通讯 API
- 连接 API
- 装置身分和状态
- 行动诈欺预防
- 行动支付
- 其他 API
- 人口密度资料
- 边缘云端
- 区域使用者数量
- 在各地区发布 Open Gateway API
第4章 国家准备指数
- 通讯 API 国家/地区准备指数
- 优先市场
- 不断成长的市场
- 市场饱和
- 新兴市场
竞争排行榜
第1章 Juniper Research竞争排行榜:通讯 API 供应商
第2章 供应商简介:通讯 API 供应商
- 通讯 API(通讯)供应商简介
- BICS
- CM.com
- Comviva
- Genesys
- Infobip
- Microsoft
- Mitto
- Orange
- Route Mobile
- Sinch
- Soprano Design
- Syniverse
- Telesign
- Twilio
- Vodafone Business
- Vonage
- Juniper Research排行榜评估方法
第3章 Juniper Research竞争排行榜:网路管理 API 供应商
第4章 供应商简介:网路管理 API 供应商
- 通讯 API(网路管理)供应商简介
- Amazon Web Services
- BICS
- Cisco
- Comviva
- Deutsche Telekom Global Carrier
- Ericsson
- Fujitsu
- Comviva
- Deutsche Telekom Global Carrier
- Ericsson
- Fujitsu
- Google Cloud
- Huawei
- Mavenir
- Nokia
- Orange
- Syniverse
- Verizon
- Vodafone Business
- Juniper Research排行榜评估方法
- 限制和解释
资料/预测
第1章 市场概况及未来展望
- 通讯 API 市场概况与未来展望
- 通讯 API 概述:预测
- 通讯 API 呼叫总数
- 营运商透过通讯 API 呼叫获得的总收入
第2章 设备身分与状态 API
- 装置身分与状态:简介
- 装置身分与状态预测方法
- 装置身分和状态 API 呼叫总数
- 营运商透过设备身分和状态 API 呼叫获得的收入
第3章 行动诈欺防制 API
- 行动诈欺防制简介
- 预防行动诈欺的预测方法
- 行动诈欺防制 API 呼叫总数
- 营运商透过行动防诈骗 API 呼叫获得的收入
第4章 行动支付API
- 行动支付简介
- 行动支付预测方法
- 行动支付 API 呼叫总数
- 营运商透过行动支付 API 呼叫获得的收入
第5章 网路连线API
- 网路连线简介
- 网路连线 API 呼叫总数
- 网路连线API呼叫预测方法
- 营运商透过网路连接 API 呼叫获得的收入
第6章 通讯API
- 通讯 API:简介
- 通讯API预测方法
- 通讯 API 呼叫总数
- 营运商透过通讯 API 呼叫获得的收入
第7章 其他通讯API
- 其他通讯 API:简介
- 其他通讯 API 的预测方法
- 其他通讯 API 呼叫总数
- 营运商从其他通讯 API 呼叫中获得的收入
| KEY STATISTICS | |
|---|---|
| Total operator revenue in 2024: | $50.9bn |
| Total operator revenue in 2029: | $159.5bn |
| 2024-2029 market growth: | 213% |
| Forecast period: | 2024-2029 |
Overview
Our "Telecommunications API" (Application Programming Interfaces) research suite is comprised of comprehensive and insightful impact analysis of key factors of this evolving market; enabling stakeholders from network operators, messaging service providers, enterprise developers and hyperscalers to understand major factors that include future growth, key trends and investment opportunities in the demand for telecom APIs.
The current telecom API market report includes several different options that can be purchased separately, including access to a market forecast of the adoption and future growth of the telco API market; a detailed study highlighting the latest trends and opportunities direct impact within the market, and two leaderboard documents containing an analysis of the major players in communications API provision and leading network management API vendors in the space. The coverage can also be purchased as a full research suite, containing all of these elements, and including a substantial discount.
The custom report in the telecom sector provides a critical tool for stakeholders in the telecoms industry for navigating this rapidly developing market and dynamic landscape; allowing vendors to shape their future strategy with telco API monetisation and capitalise on emerging opportunities as programmable networks become a reality. Its extensive coverage makes this telecom API market analysis research suite an incredibly valuable resource for examining the future of this changing market.
Key Features
- Market Dynamics: Provides detailed insight into the outlook of the telco API market; assessing the key drivers to future market growth, including the role of global initiatives such as the GSMA Open Gateway and CAMARA Project in providing access to network capabilities to app developers. It addresses market dynamics such as the key challenges that must be overcome for this market to experience significant growth, including scalability and ensuring quality of service is met. The research also explores the different APIs under the CAMARA Project; examining the benefits and market demand for these services, and the commercial models which will be used for monetisation.
- Key Takeaways & Strategic Recommendations: In-depth analysis of key development opportunities, industry trends and findings within the telco API market; accompanied by key strategic recommendations for stakeholders.
- Benchmark Industry Forecasts: The market size and forecasts for telco APIs include 5-year forecasts for total number of API calls, and total operator revenue for telecommunications APIs. The forecast breaks this down into different API categories: Device Identity & Status, Mobile Fraud Prevention, Mobile Payments, Network Connectivity and Communications.
- Juniper Research Competitor Leaderboard: Key industry player capability and capacity assessments for leading telecommunications API vendors, via the Juniper Research Competitor Leaderboard; which separates communications API and network management API vendors.
Market Data & Forecasting Report
The market-leading research suite for the "Telecommunications API" market includes access to the full set of market forecast data of 30 tables and over 13,500 datapoints. Metrics in the research suite include:
- Total Number of Telecommunications API Calls
- Total Operator Revenue from Telecommunications API Calls
These metrics are provided for the following API categories:
- Device Identity & Status
- Mobile Fraud Prevention
- Mobile Payments APIs
- Network Connectivity
- Communications
Juniper Research Interactive Forecast Excel contains the following functionality:
- Statistics Analysis: Users benefit from the ability to search for specific metrics, displayed for all regions and countries across the data period. Graphs are easily modified and can be exported to the clipboard.
- Country Data Tool: This tool lets users look at metrics for all key regions and countries in the forecast period. Users can refine the metrics displayed via a search bar.
- Country Comparison Tool: Users can select countries and compare each of them for specific countries. The ability to export graphs is included in this tool.
- What-if Analysis: Here, users can compare forecast metrics against their own assumptions, via 5 interactive scenarios.
Market Trends & Strategies Report
This market study examines the "Telecommunications API" landscape in detail; assessing the trends and factors shaping the evolution of this growing market. The report delivers an in-depth analysis of the strategic opportunities for vendors; addressing key concerns, and the crucial role of how stakeholders should overcome these to capitalise and gain competitive edge on the emerging telco API opportunity. It also evaluates key country-level opportunities for telco API growth.
Competitor Leaderboard Report
This telecom industry market players report includes two Competitor Leaderboard reports, which provide a wide range and detailed evaluation and market positioning of 16 leading Communications API and 15 Network Management API vendors. The vendors are positioned as established leaders, leading challengers or disruptors and challengers based on largest market share capacity and capability assessments.
Juniper Research Competitor Leaderboard for Communications APIs, including key players:
|
|
Juniper Research Competitor Leaderboard for Network Management APIs, including key players:
|
|
These documents are centred around the Juniper Research Competitor Leaderboard; a vendor positioning tool that provides an at-a-glance view of the competitive landscape in a market, backed by a robust methodology.
Table of Contents
Market Trends & Strategies
1. Key Takeaways & Strategic Recommendations
- 1.1. Key Takeaways
- 1.2. Strategic Recommendations
2. Future Market Outlook
- 2.1. Introduction
- Figure 2.1: Enterprise Adoption of APIs without Standardised APIs
- Figure 2.2: Revenue Flow Without Telco APIs vs With
- 2.1.1. Future Market Outlook
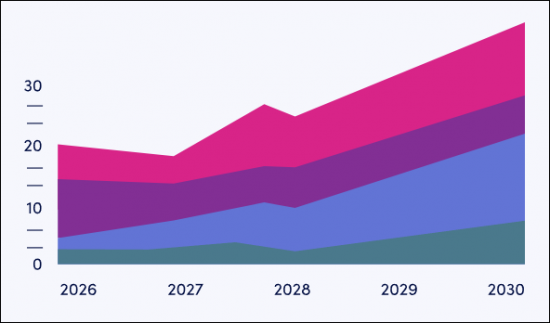
- Figure 2.3: Total Operator Revenue from Telecommunications API Calls ($m), Split by 8 Key Regions, 2024-2029
- Figure 2.4: Total Number of Telecommunications API Calls in 2024 (m), Split by Category
- 2.1.2. Monetisation of API Services
- Figure 2.5: Business Models for API Access
- 2.1.3. Challenges for Future Market Development
3. GSMA Open Gateway and CAMARA
- 3.1. GSMA Open Gateway
- Figure 3.1: Global Coverage of Operator Groups Supporting Open Gateway
- Figure 3.2: Mobile Operators Signed Up to Open Gateway
- 3.2. Introduction to CAMARA APIs
- 3.2.1. Scope of the CAMARA Project
- 3.3. CAMARA API Types
- 3.3.1. Communications APIs
- i. Click to Dial
- Figure 3.3: Click to Dial API
- ii. Short Message Service
- iii. WebRTC
- i. Click to Dial
- 3.3.2. Connectivity APIs
- i. Connectivity Insights
- Figure 3.4: Connectivity Insights API Flow
- ii. Home Devices QoD
- iii. Network Slice Booking (Slice on Demand)
- iv. Quality on Demand
- Figure 3.5: Overview of QoD API
- v. Site to Cloud VPN
- Figure 3.6: Site to Cloud VPN API Flow
- i. Connectivity Insights
- 3.3.3. Device Identify & Status
- i. Device Identifier
- Figure 3.7: Device Identifier API
- ii. Device Location
- iii. Device Status
- iv. Device Swap
- i. Device Identifier
- 3.3.4. Mobile Fraud Prevention
- i. Call Forwarding Signal
- ii. KYC (Know Your Customer)
- Figure 3.8: KYC Match API Work Flow
- iii. Number Verification
- Figure 3.9: Without Number Verification API
- Figure 3.10: With Number Verification API
- iv. SIM Swap
- v. OTP Validation API
- 3.3.5. Mobile Payments
- i. Carrier Billing Check Out
- ii. Blockchain Public Address
- 3.3.6. Other APIs
- i. Population Density Data
- ii. Edge Cloud
- iii. Region User Count
- 3.3.1. Communications APIs
- 3.4. Open Gateway APIs Launched in Different Regions
- Table 3.11: Operators in North America That Have Commercially Launched GSMA Open Gateway APIs as of May 2024
- Table 3.12: Operators in Latin America That Have Commercially Launched GSMA Open Gateway APIs as of May 2024
- Table 3.13: Operators in West Europe That Have Commercially Launched GSMA Open Gateway APIs as of May 2024
- Table 3.14: Operators in Far East & China That Have Commercially Launched GSMA Open Gateway APIs as of May 2024
- Table 3.15: Operators in Rest of Asia Pacific That Have Commercially Launched GSMA Open Gateway APIs as of May 2024
- Table 3.16: Operators in Africa & Middle East That Have Commercially Launched GSMA Open Gateway APIs as of May 2024
4. Country Readiness Index
- 4.1. Telco API Country Readiness Index
- Figure 4.1: Countries in Each Region
- Table 4.2: Juniper Research Telco API Country Readiness Index: Scoring Criteria
- Table 4.4: Telco APIs Country Readiness Index: Market Segments
- 4.1.1. Focus Markets
- i. Support for GSMA Open Gateway
- Figure 4.5: Total Number of Telecommunications API Calls ($m), Split by Brazil, Germany, Indonesia, and Spain, 2024-2025
- ii. Demand for Fraud Prevention Services
- Figure 4.6: Total Operator Revenue from Mobile Fraud Prevention API Calls in Select Countries in Far East & China ($m), 2024-2029
- i. Support for GSMA Open Gateway
- 4.1.2. Growth Markets
- i. Operators to Prioritise Investment into 5G Infrastructure
- Figure 4.7: Total Number of 5G Connections (m) vs Operator Revenue from Network Connectivity APIs in West Europe ($m), 2026
- ii. Lower Support for the GSMA Open Gateway
- iii. Cellular IoT Connections Will Create Demand for Connectivity APIs
- Figure 4.8: Total Number of Cellular IoT Connections in Select Countries in West Europe (m), 2024-2026
- iv. High Operator ARPU Will Encourage Investment into Telecommunications APIs
- i. Operators to Prioritise Investment into 5G Infrastructure
- 4.1.3. Saturated Markets
- i. Low Demand for Telecommunications APIs
- Figure 4.9: Proportion of the Population That Are Banked (%), Average for Focus Markets vs Average for Saturated Markets, 2024
- ii. Low Operator ARPU for Future Investment into Telecommunications APIs
- i. Low Demand for Telecommunications APIs
- 4.1.4. Developing Markets
- i. Limited 5G Infrastructure
- ii. Low Demand for the Fraud Prevention Use Case
- Table 4.10: Juniper Research Country Readiness Index Heatmap: North America
- Table 4.11: Juniper Research Country Readiness Index Heatmap: Latin America
- Table 4.12: Juniper Research Country Readiness Index Heatmap: West Europe
- Table 4.13: Juniper Research Country Readiness Index Heatmap: Central & East Europe
- Table 4.14: Juniper Research Country Readiness Index Heatmap: Far East & China
- Table 4.15: Juniper Research Country Readiness Index Heatmap: Indian Subcontinent
- Table 4.16: Juniper Research Country Readiness Index Heatmap: Rest of Asia Pacific
- Table 4.17: Juniper Research Country Readiness Index Heatmap: Africa & Middle East
Competitor Leaderboard
1. Juniper Research Competitor Leaderboard: Communications API Vendors
- Table 1.1: Juniper Research Competitor Leaderboard: Vendors & Product Portfolio
- Figure 1.2: Juniper Research Competitor Leaderboard: Telecommunications API Vendors (Communications)
- Source: Juniper ResearchTable 1.3: Juniper Research Competitor Leaderboard: Vendors & Positioning
- Table 1.4: Juniper Research Competitor Leaderboard Heatmap: Telecommunications API Vendors
2. Vendor Profiles: Communications API Vendors
- 2.1. Telecommunications APIs (Communications) Vendor Profiles
- 2.1.1. BICS
- i. Corporate Information
- Table 2.1: BICS' Select Financial Information (Eurom), 2022 & 2023
- ii. Geographical Spread
- iii. Key Clients & Strategic Partnerships
- iv. High-level View of Offerings
- v. Juniper Research's View: Key Strengths & Strategic Development Opportunities
- i. Corporate Information
- 2.1.2. CM.com
- i. Corporate Information
- Table 2.2: Acquisitions Made by CM.com, 2021-Present
- Table 2.3: CM.com's Select Financial Information (Eurom), 2022-2023
- ii. Geographical Spread
- iii. Key Clients & Strategic Partnerships
- iv. High-level View of Offerings
- v. Juniper Research's View: Key Strengths & Strategic Development Opportunities
- i. Corporate Information
- 2.1.3. Comviva
- i. Corporate Information
- ii. Geographical Spread
- iii. Key Clients & Strategic Partnerships
- iv. High-level View of Offerings
- v. Juniper Research's View: Key Strengths & Strategic Development Opportunities
- 2.1.4. Genesys
- i. Corporate Information
- ii. Geographical Spread
- iii. Key Clients & Strategic Partnerships
- iv. High-level View of Offerings
- v. Juniper Research's View: Key Strengths & Strategic Development Opportunities
- 2.1.5. Infobip
- i. Corporate Information
- Table 2.4: Infobip's Acquisitions - April 2021 to Present
- ii. Geographical Spread
- iii. Key Clients & Strategic Partnerships
- iv. High-level View of Offerings
- v. Juniper Research's View: Key Strengths & Strategic Development Opportunities
- 2.1.6. Microsoft
- i. Corporate Information
- ii. Geographical Spread
- iii. Key Clients & Strategic Partnerships
- iv. High-level View of Offerings
- v. Juniper Research's View: Key Strengths & Strategic Development Opportunities
- 2.1.7. Mitto
- i. Corporate Information
- ii. Geographical Spread
- iii. Key Clients & Strategic Partnerships
- iv. High-level View of Offerings
- v. Juniper Research's View: Key Strengths & Strategic Development Opportunities
- 2.1.8. Orange
- i. Corporate Information
- ii. Geographical Spread
- Figure 2.5: Orange Operations Map
- iii. Key Clients & Strategic Partnerships
- iv. High-level View of Offerings
- Figure 2.6: Orange Business Talk API - Overview
- Figure 2.7: Orange SMS API - Overview
- v. Juniper Research's View: Key Strengths & Strategic Development Opportunities
- 2.1.9. Route Mobile
- i. Corporate Information
- Table 2.8: Route Mobile's Annual Financial Information (Indian Rupee Cr), 2021-2023
- ii. Geographical Spread
- iii. Key Clients & Strategic Partnerships
- iv. High-level View of Offerings
- Figure 2.9: How Route Mobile's OTP Service Works
- v. Juniper Research's View: Key Strengths & Strategic Development Opportunities
- i. Corporate Information
- 2.1.10. Sinch
- i. Corporate Information
- Table 2.10: Sinch's Most Recent Acquisitions, 2020-2021
- Table 2.11: Sinch's Select Financial Information ($m), 2021-2023
- ii. Geographical Spread
- iii. Key Clients & Strategic Partnerships
- iv. High-level View of Offerings
- Figure 2.12: Sinch Conversation API - Overview
- Figure 2.13: Sinch Verification API - Overview
- v. Juniper Research's View: Key Strengths & Strategic Development Opportunities
- i. Corporate Information
- 2.1.11. Soprano Design
- i. Corporate Information
- ii. Geographical Spread
- iii. Key Clients & Strategic Partnerships
- iv. High-evel View of Offerings
- v. Juniper Research's View: Key Strengths & Strategic Development Opportunities
- 2.1.12. Syniverse
- i. Corporate Information
- ii. Geographical Spread
- iii. Key Clients & Strategic Partnerships
- iv. High-level View of Offerings
- v. Juniper Research's View: Key Strengths & Strategic Development Opportunities
- 2.1.13. Telesign
- i. Corporate Information
- ii. Geographical Spread
- iii. Key Clients & Strategic Partnerships
- iv. High-level View of Offerings
- Figure 2.15: Telesign Verify API - Overview
- v. Juniper Research's View: Key Strengths & Strategic Development Opportunities
- 2.1.14. Twilio
- i. Corporate Information
- Table 2.16: Twilio's Acquisitions, Nov 2019-Present
- Table 2.17: Twilio's Revenue Information ($m), 2021-2023
- ii. Geographical Spread
- iii. Key Clients & Strategic Partnerships
- iv. High-level View of Offerings
- v. Juniper Research's View: Key Strengths & Strategic Development Opportunities
- i. Corporate Information
- 2.1.15. Vodafone Business
- i. Corporate Information
- Table 2.18: Vodafone Business' Select Financial Information (Eurom), FY 2022-2023
- ii. Geographical Spread
- iii. Key Clients & Strategic Partnerships
- iv. High-level View of Offerings
- v. Juniper Research's View: Key Strengths & Strategic Development Opportunities
- i. Corporate Information
- 2.1.16. Vonage
- i. Corporate Information
- ii. Geographical Spread
- iii. Key Clients & Strategic Partnerships
- iv. High-level View of Offerings
- v. Juniper Research's View: Key Strengths & Strategic Development Opportunities
- 2.1.1. BICS
- 2.2. Juniper Research Leaderboard Assessment Methodology
3. Juniper Research Competitor Leaderboard: Network Management API Vendors
- Table 3.1: Juniper Research Competitor Leaderboard: Vendors & Product Portfolio
- Figure 3.2: Juniper Research Competitor Leaderboard: Telecommunications API Vendors (Network Management)
- Source: Juniper ResearchTable 3.3: Juniper Research Competitor Leaderboard: Vendors & Positioning
- Table 3.4: Juniper Research Competitor Leaderboard Heatmap: Telco API Vendors (Network Management)
4. Vendor Profiles: Network Management API Vendors
- 4.1. Telecommunications APIs (Network Management) Vendor Profiles
- 4.1.1. Amazon Web Services
- i. Corporate Information
- Table 4.1: AWS' Revenue in 2021 and 2022 ($bn), 2021-2022
- ii. Geographical Spread
- Figure 4.2: Amazon Web Service Infrastructure Deployments Map, 2023
- iii. Key Clients & Strategic Partnerships
- iv. High-level View of Offerings
- v. Juniper Research's View: Key Strengths & Strategic Development Opportunities
- i. Corporate Information
- 4.1.2. BICS
- i. Corporate Information
- Table 4.3: BICS' Select Financial Information (Eurom), 2022-2023
- ii. Geographical Spread
- iii. Key Clients & Strategic Partnerships
- iv. High-level View of Offerings
- v. Juniper Research's View: Key Strengths & Strategic Opportunities
- i. Corporate Information
- 4.1.3. Cisco
- i. Corporate Information
- ii. Geographical Spread
- iii. Key Clients & Strategic Partnerships
- iv. High-level View of Offerings
- v. Juniper Research's View: Key Strengths & Strategic Development Opportunities
- 4.1.4. Comviva
- i. Corporate Information
- ii. Geographical Spread
- iii. Key Clients & Strategic Partnerships
- iv. High-level View of Offerings
- v. Juniper Research's View: Key Strengths & Strategic Development Opportunities
- 4.1.5. Deutsche Telekom Global Carrier
- i. Corporate Information
- Table 4.5: Deutsche Telekom's Select Financial Information (Eurobn), 2021-2023
- ii. Geographical Spread
- iii. Key Clients & Strategic Partnerships
- iv. High-level View of Offerings
- Figure 4.6: Deutsche Telekom Cloud of Things Features and Services
- v. Juniper Research's View: Key Strengths & Strategic Development Opportunities
- i. Corporate Information
- 4.1.6. Ericsson
- i. Corporate Information
- Table 4.7: Ericsson窶- Financial Information ($m), 2019-2023
- ii. Geographical Spread
- iii. Key Clients & Strategic Partnerships
- iv. High-level View of Offerings
- Figure 4.8: Ericsson Cloud Core Exposure Server Including Edge Exposure Server
- v. Juniper Research's View: Key Strengths & Strategic Development Opportunities
- i. Corporate Information
- 4.1.7. Fujitsu
- i. Corporate Information
- ii. Geographical Spread
- v. Juniper Research's View: Key Strengths & Strategic Development Opportunities
- 4.1.4. Comviva
- i. Corporate Information
- ii. Geographical Spread
- iii. Key Clients & Strategic Partnerships
- iv. High-level View of Offerings
- v. Juniper Research's View: Key Strengths & Strategic Development Opportunities
- 4.1.5. Deutsche Telekom Global Carrier
- i. Corporate Information
- Table 4.5: Deutsche Telekom's Select Financial Information (Eurobn), 2021-2023
- ii. Geographical Spread
- iii. Key Clients & Strategic Partnerships
- iv. High-level View of Offerings
- Figure 4.6: Deutsche Telekom Cloud of Things Features and Services
- v. Juniper Research's View: Key Strengths & Strategic Development Opportunities
- i. Corporate Information
- 4.1.6. Ericsson
- i. Corporate Information
- Table 4.7: Ericsson窶- Financial Information ($m), 2019-2023
- ii. Geographical Spread
- iii. Key Clients & Strategic Partnerships
- iv. High-level View of Offerings
- Figure 4.8: Ericsson Cloud Core Exposure Server Including Edge Exposure Server
- v. Juniper Research's View: Key Strengths & Strategic Development Opportunities
- i. Corporate Information
- 4.1.7. Fujitsu
- i. Corporate Information
- ii. Geographical Spread
- iii. Key Clients & Strategic Partnerships
- iv. High Level View of Offerings
- v. Juniper Research's View: Key Strengths & Strategic Development Opportunities
- 4.1.8. Google Cloud
- i. Corporate Information
- ii. Geographical Spread
- Figure 4.9: Google Cloud Platform Regions
- iii. Key Clients & Strategic Partnerships
- iv. High-level View of Offerings
- Figure 4.10: Overview of Google Cloud API Management
- Figure 4.11: Preview Version of Google Cloud's SIM Swap Solution
- v. Juniper Research's View: Key Strengths & Strategic Development Opportunities
- 4.1.9. Huawei
- i. Corporate Information
- Table 4.12: Huawei's Select Financial Information ($m), 2020-2023
- ii. Geographical Spread
- iii. Key Clients & Strategic Partnerships
- iv. High-level View of Offerings
- v. Juniper Research's View: Key Strengths & Strategic Development Opportunities
- i. Corporate Information
- 4.1.10. Mavenir
- i. Corporate Information
- ii. Geographical Spread
- iii. Key Clients & Strategic Partnerships
- iv. High-level View of Offerings
- Figure 4.13: MDE Digital Marketplace Approach and Key Highlights
- v. Juniper Research's View: Key Strengths & Strategic Development Opportunities
- 4.1.11. Nokia
- i. Corporate Information
- Table 4.14: Nokia's Select Financial Information (Eurom), 2021-2023
- ii. Geographical Spread
- iii. Key Clients & Strategic Partnerships
- iv. High-level View of Offerings
- v. Juniper Research's View: Key Strengths & Strategic Development Opportunities
- i. Corporate Information
- 4.1.12. Orange
- i. Corporate Information
- ii. Geographical Spread
- Figure 4.15: Orange Operations Map
- iii. Key Clients & Strategic Partnerships
- iv. High-level View of Offerings
- Figure 4.16: High-level View of Orange's Location Verification API Architecture
- Figure 4.17: High-level View of Orange's Location Retrieval API Architecture
- Figure 4.18: High-level View of Orange's Device Status API Architecture
- v. Juniper Research's View: Key Strengths & Strategic Development Opportunities
- 4.1.13. Syniverse
- i. Corporate Information
- ii. Geographical Spread
- iii. Key Clients & Strategic Partnerships
- iv. High-level View of Offerings
- v. Juniper Research's View: Key Strengths & Strategic Development Opportunities
- 4.1.14. Verizon
- i. Corporate Information
- ii. Geographical Spread
- iii. Key Clients & Strategic Partnerships
- iv. High-level View of Offerings
- v. Juniper Research's View: Key Strengths & Strategic Development Opportunities
- 4.1.15. Vodafone Business
- i. Corporate Information
- Table 4.19: Vodafone Business' Select Financial Information (Eurom), FY 2022-2023
- ii. Geographical Spread
- iii. Key Clients & Strategic Partnerships
- iv. High-level View of Offerings
- v. Juniper Research's View: Key Strengths & Strategic Development Opportunities
- i. Corporate Information
- 4.1.1. Amazon Web Services
- 4.2. Juniper Research Leaderboard Assessment Methodology
- 4.3. Limitations & Interpretations
- Table 4.20: Juniper Research Competitor Leaderboard Scoring Criteria
Data & Forecasting
1. Market Summary & Future Outlook
- 1.1. Telecommunications API Market Summary & Future Outlook
- 1.1.1. Telecommunications APIs Market Summary Forecast Methodology
- Figure 1.1: Telecommunications APIs Market Summary Forecast Methodology
- 1.1.1. Telecommunications APIs Market Summary Forecast Methodology
- 1.2. Telecommunications APIs Summary Forecasts
- 1.2.1. Total Number of Telecommunications API Calls
- Figure & Table 1.2: Total Number of Telecommunications API Calls (m), Split by Key Regions, 2024-2029
- 1.2.2. Total Operator Revenue from Telecommunications API Calls
- Figure & Table 1.3: Total Operator Revenue from Telecommunications API Calls ($m), Split by 8 Key Regions, 2024-2029
- 1.2.1. Total Number of Telecommunications API Calls
2. Device Identity & Status APIs
- 2.1. Device Identity & Status Introduction
- 2.1.1. Device Identity & Status Forecast Methodology
- Figure 2.1: Device Identity & Status APIs Forecast Methodology
- 2.1.2. Total Number of Device Identity & Status API Calls
- Figure & Table 2.2: Total Number of Device Identity & Status API Calls (m), Split by 8 Key Regions, 2024-2029
- 2.1.3. Operator Revenue from Device Identity & Status API Calls
- Figure & Table 2.3: Total Operator Revenue from Device Identity & Status API Calls ($m), Split by 8 Key Regions, 2024-2029
- 2.1.1. Device Identity & Status Forecast Methodology
3. Mobile Fraud Prevention APIs
- 3.1. Mobile Fraud Prevention Introduction
- 3.1.1. Mobile Fraud Prevention Forecast Methodology
- Figure 3.1: Mobile Fraud Prevention APIs Forecast Methodology
- 3.1.2. Total Number of Mobile Fraud Prevention API Calls
- Figure & Table 3.2: Total Number of Mobile Fraud Prevention API Calls (m), Split by 8 Key Regions, 2024-2029
- 3.1.3. Operator Revenue from Mobile Fraud Prevention API Calls
- Figure & Table 3.3: Total Operator Revenue from Mobile Fraud Prevention API Calls ($m), Split by 8 Key Regions, 2024-2029
- 3.1.1. Mobile Fraud Prevention Forecast Methodology
4. Mobile Payments APIs
- 4.1. Mobile Payments Introduction
- 4.1.1. Mobile Payments Forecast Methodology
- Figure 4.1: Mobile Payments APIs Forecast Methodology
- 4.1.2. Total Number of Mobile Payments API Calls
- Figure & Table 4.2: Total Number of Mobile Payments API Calls (m), Split by 8 Key Regions, 2024-2029
- 4.1.3. Operator Revenue from Mobile Payments API Calls
- Figure & Table 4.3: Total Operator Revenue from Mobile Payments API Calls ($m), Split by 8 Key Regions, 2024-2029
- 4.1.1. Mobile Payments Forecast Methodology
5. Network Connectivity APIs
- 5.1. Network Connectivity Introduction
- 5.1.1. Network Connectivity Forecast Methodology
- Figure 5.1: Network Connectivity APIs Forecast Methodology
- Total Number of Network Connectivity API Calls
- Figure & Table 5.2: Total Number of Connectivity API Calls (m), Split by 8 Key Regions, 2024-2029
- Figure 5.1: Network Connectivity APIs Forecast Methodology
- 5.1.2. Operator Revenue from Network Connectivity API Calls
- Figure & Table 5.3: Total Operator Revenue from Connectivity API Calls ($m), Split by 8 Key Regions, 2024-2029
- 5.1.1. Network Connectivity Forecast Methodology
6. Communications APIs
- 6.1. Communications APIs Introduction
- 6.1.1. Communications APIs Forecast Methodology
- Figure 6.1: Communications APIs Forecast Methodology
- 6.1.2. Total Number of Communications API Calls
- Figure & Table 6.2: Total Number of Communications API Calls (m), Split by Key Regions, 2024-2029
- 6.1.3. Operator Revenue from Communications API Calls
- Figure & Table 6.3: Total Operator Revenue from Communications API Calls ($m), Split by 8 Key Regions, 2024-2029
- 6.1.1. Communications APIs Forecast Methodology
7. Other Telecommunications APIs
- 7.1. Other Telecommunications APIs Introduction
- 7.1.1. Other Telecommunications APIs Forecast Methodology
- Figure 7.1: Other API Calls Forecast Methodology
- 7.1.2. Total Number of Other API Calls
- Figure & Table 7.2: Total Number of Other API Calls (m), Split by 8 Key Regions, 2024-2029
- 7.1.3. Operator Revenue from Other API Calls
- Figure & Table 7.3: Total Operator Revenue from Mobile Fraud Prevention API Calls ($m), Split by 8 Key Regions, 2024-2029
- 7.1.1. Other Telecommunications APIs Forecast Methodology
 全球通讯API市场规模、份额、趋势和成长分析报告(2026-2034年)
 电信API市场规模、份额和成长分析(按API类型、部署模式、最终用户、功能和地区划分)-2026-2033年产业预测
 电信API安全市场预测至2032年:按组件、API领域、安全功能、组织规模、网路类型、最终用户和地区分類的全球分析
 电信API市场机会、成长驱动因素、产业趋势分析及预测(2025-2034年)
 电信API - 全球市场份额和排名、总收入和需求预测(2025-2031年)
 2025 年至 2033 年电信 API 市场规模、份额、趋势和预测(按类型、用户类型、部署、行业垂直和地区)全球通讯API整合市场:预测至2032年-按API类型、部署模式、经营模式、最终用户和地区分類的分析
 电信 API 市场 - 全球产业规模、份额、趋势、机会和预测,按 API 类型、部署模式、最终用户、地区和竞争细分,2020-2030 年预测
 电讯领域API:市场占有率分析、产业趋势、统计数据和成长预测(2025-2030)电信 API 市场:预测(2025-2030 年)