


 |
市场调查报告书
商品编码
1686672
交易监测系统的全球市场:2025-2029年Global Trade Surveillance Systems Market: 2025-2029 |
||||||
"法规强化中,交易监测系统的支出额2029年预计达到49亿美元"
| 主要统计 | |
|---|---|
| 2025年的总支出额 | 27亿美元 |
| 2029年的总支出额 | 49亿美元 |
| 2025~2029年的市场成长率 | 85% |
| 预测期间 | 2025-2029年 |
本研究报告对当前不断变化的市场格局进行了深入分析。该研究评估了金融市场和合规领域的主要趋势,并总结了影响合规团队的主要推动因素和课题,包括合规成本上升、市场波动性和复杂性加剧,以及供应商对人工智慧和其他下一代技术的采用。该报告还将 16 家供应商列入 Juniper Research 交易监控系统竞争排行榜,评估他们的产品并根据能力进行定位。本报告将成为了解贸易监控市场的重要工具,并将有助于贸易监控领域的供应商制定未来策略。
研究也为以下细分市场、八个主要地区和 61 个国家的市场提供了行业基准预测:
- 大金融机关 (世界规模的银行及大证券会社)
- 中坚金融机关 (地区规模的银行及资产运用公司)
- 小规模金融机关 (螺钉猪肉交易公司及个人仲介)
- 其他 (交易所,法规机关)
主要的特征
- 市场动态:深入了解贸易监控系统市场的主要趋势和市场课题,包括应对新法规带来的课题、增加跨市场和跨平台监控的需求,以及减轻合规团队的负担。它还评估了当前的金融犯罪形势,强调了贸易监控系统应重点检测的市场滥用的关键领域。此外,该报告还包括细分分析,将市场分为大型、中型和小型金融机构,以及使用交易监控系统的其他企业,如交易所和监管机构。
- 关键要点和策略建议:深入分析交易监控系统市场中的关键发展机会和见解,并向包括交易监控技术领导者在内的利害关係人提供策略建议。
- 基准产业预测:按产业垂直和业务规模划分的使用第三方交易监控系统的公司总数以及第三方交易监控系统总支出的综合数据和预测。
- Juniper Research 竞争排行榜:评估 16 家贸易监控供应商的能力,并为贸易监控领域的主要参与者提供市场规模资讯。
市场资料·预测
研究套件包括一整套预测数据,其中包含 37 个表格和超过 13,500 个数据点。该调查套件包括以下指标:
- 使用第三方交易监控系统的公司总数
- 第三方交易监控系统的总支出
为以下公司提供指标:
- 大型金融机构(全球银行及大型证券公司)
- 中型金融机构(区域银行与资产管理公司)
- 小型金融机构(客製化交易公司和私人经纪商)
- 其他(交易所、交易所、监管机构)
Juniper Research Interactive Forecast (Excel) 包含以下功能:
- 统计分析:显示资料期间内所有地区和国家的数据,并允许您搜寻特定指标。可以轻鬆修改图表并将其汇出到剪贴簿。
- 国家资料工具:您可以查看预测期间内所有地区和国家的指标。您可以使用搜寻栏缩小显示的指标范围。
- 国家比较工具:您可以选择国家进行比较。该工具包括图形导出功能。
样品view
市场趋势PDF报告
全面分析当前市场格局,并提供详细的策略建议和预测
目录
第1章 重要点和策略性推荐事项
- 重要点
- 策略性推荐事项
第2章 交易监测系统市场:摘要
- 简介
- 交易监测系统的过程
- 目前形势
- 法规情形
- The Markets in Financial Instruments Directive II (MiFID II)
- The European Union Market Abuse Regulation (EU MAR)
- The UK Market Abuse Regulation (UK MAR)
- Dodd-Frank Wall Street Reform and Consumer Protection Act (Dodd-Frank Act)
- Rule 15c3-5
- New Algorithm Trading Rules
- The Financial Instruments and Exchange Act (FIEA)
- The Monetary Authority of Singapore (MAS)
- 金融犯罪的potoreito
- 市场滥用的类型
- 价格操作
- 循环交易
- 内部资讯的滥用
- 交易为基础的洗钱 (TBML)
- 价格的影响
- 不合适的定购处理
- 导致误解的行为
- 市场滥用的类型
- 促进因素
- 法规压力
- 技术创新
- 市场复杂
- 资料管治
- 课题
- 误侦测
- 对遵守队的压力
- 十字产品监视
第3章 市场区隔分析
- 市场区隔分析
- 大金融机关
- 中规模金融机关
- 中小规模金融机关
- 其他的事业
第4章 竞争排行榜
- 读该报告的理由
- 业者简介
- ACA Group
- Aquis Exchange
- b-next
- eflow Global
- Eventus Systems
- FIS
- Nasdaq
- Nexi Group
- NICE Actimize
- Scila
- Software AG
- SteelEye
- SymphonyAI Sensa
- Trading Technologies
- TradingHub
- Trapets
第5章 资料&预测
- 调查手法与前提
- 交易监测系统市场
- 交易监控系统总支出
- 大型金融机构在第三方交易监控系统上的总支出
- 中型金融机构第三方监控总支出
- 中小型金融机构在第三方交易监控系统上的总支出
- 其他公司在第三方交易监控系统上的总支出
'Trade Surveillance Systems Spend to Reach $4.9 Billion by 2029, Amid Escalating Regulatory Scrutiny'
| KEY STATISTICS | |
|---|---|
| Total spend in 2025: | $2.7bn |
| Total spend in 2029: | $4.9bn |
| Market growth 2025-2029: | 85% |
| Forecast period: | 2025-2029 |
Overview
Our "Trade Surveillance Systems" research report provides in-depth analysis of the state of this evolving market. The research evaluates key trends in the financial markets and compliance sectors, alongside the main drivers and challenges affecting compliance teams; such as the rising cost of compliance, increasing market volatility and complexity, and how vendors are adopting AI and other next-generation technologies. The report also positions 16 vendors across the Juniper Research Competitor Leaderboard for trade surveillance systems; assessed on their products and positioning against their capability and capacity. Collectively, the report provides a critical tool for understanding the trade surveillance systems market; enabling vendors in the trade surveillance systems space to shape their future strategy.
The research also provides industry benchmark forecasts for the market, split by the following segments, as well as by our 8 key regions and 61 countries:
- Large Financial Institutions (Global Banks and Major Brokerages)
- Medium Financial Institutions (Regional Banks and Asset Management Firms)
- Small Financial Institutions (Bespoke Trading Firms and Individual Brokers)
- Other Businesses (Trading & Exchange Venues and Regulatory Bodies)
Key Features
- Market Dynamics: Insights into key trends and market challenges within the trade surveillance systems market; addressing challenges posed by emerging regulations, increased demand for cross-market and cross-platform monitoring, and the reduction of workload on compliance teams. It also evaluates the state of the financial crime landscape; highlighting key areas of market abuse that trade surveillance systems should focus on detecting. The report includes a segment analysis, which has market splits for large, medium, and small financial institutions, and other businesses that use trade surveillance systems; such as trading and exchange venues, and regulatory bodies.
- Key Takeaways & Strategic Recommendations: In-depth analysis of key development opportunities and findings within the trade surveillance systems market, accompanied by strategic recommendations for stakeholders, such as leaders in trade surveillance technology.
- Benchmark Industry Forecasts: A suite of comprehensive data and forecasts highlighting the total number of businesses using third-party trade surveillance systems, and total spend on third-party trade surveillance systems, split by business sector and business size; covering large, medium, and small financial institutions, and other businesses, such as trading venues and regulators.
- Juniper Research Competitor Leaderboard: Key player capability and capacity assessment for 16 trade surveillance systems vendors, via the Juniper Research Competitor Leaderboard, featuring market size for major players in the trade surveillance systems sector.
- ACA Group
- Aquis
- b-next
- eflow
- Eventus Systems
- FIS
- Nasdaq
- Nexi Group
- NICE Actimize
- Scila
- Software AG
- SteelEye
- SymphonyAI
- Trading Technologies
- TradingHub
- Trapets
Market Data & Forecasts
The market-leading research suite for the "Trade Surveillance Systems" market includes access to the full set of forecast data, with 37 tables and over 13,500 datapoints. Metrics in the research suite include:
- Total Number of Businesses Using Third-party Trade Surveillance Systems
- Total Spend on Third-party Trade Surveillance Systems
Metrics are provided for the following businesses:
- Large Financial Institutions (Global Banks and Major Brokerages)
- Medium Financial Institutions (Regional Banks and Asset Management Firms)
- Small Financial Institutions (Bespoke Trading Firms and Individual Brokers)
- Other Businesses (Trading and Exchange Venues, and Regulatory Bodies)
Juniper Research Interactive Forecast Excel contains the following functionality:
- Statistics Analysis: Users benefit from the ability to search for specific metrics; displayed for all regions and countries across the data period. Graphs are easily modified and can be exported to the clipboard.
- Country Data Tool: This tool lets users look at metrics for all regions and countries in the forecast period. Users can refine the metrics displayed via a search bar.
- Country Comparison Tool: Users can select and compare countries. The ability to export graphs is included in this tool.
SAMPLE VIEW
Market Trends & Forecasts PDF Report
A comprehensive analysis of the current market landscape, alongside strategic recommendations and a walk-through of the forecasts.
Table of Contents
1. Key Takeaways & Strategic Recommendations
- 1.1. Key Takeaways
- 1.2. Strategic Recommendations
2. Trade Surveillance Systems Market Summary
- 2.1. Introduction
- 2.1.1. The History of Trade Surveillance Systems
- 2.1.2. The Current Landscape
- Figure 2.1: Global Spend on Third-party Trade Surveillance Systems ($m), 2024-2029, Split by 8 Key Regions: ($4.9 billion by 2029)
- Figure 2.2: How Do Trade Surveillance Systems Work?
- Figure 2.3: Trade Surveillance Systems - Solution Categories
- 2.1.3. Regulatory Landscape
- Figure 2.4: Key Global Market Abuse Regulations/Regulatory Bodies
- i. The Markets in Financial Instruments Directive II (MiFID II)
- ii. The European Union Market Abuse Regulation (EU MAR)
- iii. The UK Market Abuse Regulation (UK MAR)
- iv. Dodd-Frank Wall Street Reform and Consumer Protection Act (Dodd-Frank Act)
- v. Rule 15c3-5
- vi. New Algorithm Trading Rules
- vii. The Financial Instruments and Exchange Act (FIEA)
- viii. The Monetary Authority of Singapore (MAS)
- 2.2. Portrait of Financial Crime
- 2.2.1. Types of Market Abuse
- Figure 2.5: Types of Market Abuse
- i. Price Manipulation
- ii. Circular Trading
- iii. Misuse of Insider Knowledge
- iv. Trade-based Money Laundering (TBML)
- v. Price Influencing
- vi. Improper Order Handling
- vii. Misleading Conduct
- 2.2.1. Types of Market Abuse
- 2.3. Drivers
- 2.3.1. Regulatory Pressure
- 2.3.2. Technological Innovation
- 2.3.3. Market Complexity
- 2.3.4. Data Governance
- 2.4. Challenges
- 2.4.1. False Positives
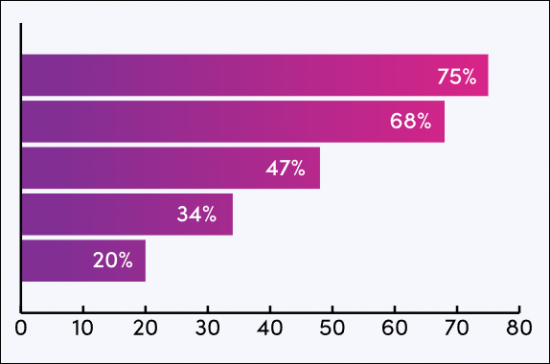
- Figure 2.6: Acuiti Trade Surveillance Market Review Survey
- 2.4.2. Pressure On Compliance Teams
- 2.4.3. Cross-product Surveillance
- 2.4.1. False Positives
3. Segment Analysis
- 3.1. Segment Analysis
- Figure 3.1: Total Spend on Third-party Trade Surveillance Systems ($m), 2029, Split by Segment - $4.9 Billion
- 3.1.1. Large Financial Institutions
- Figure 3.2: Global Spend on Third-party Trade Surveillance Systems by Large ($m), 2024-2029
- 3.1.2. Medium-sized Financial Institutions
- Figure 3.3: Global Spend on Third-party Trade Surveillance Systems by Mediumsized FIs ($m), 2024-2029
- 3.1.3. Small-sized Financial Institutions
- Figure 3.4: Global Spend on Third-party Trade Surveillance Systems by Small FIs ($m), 2024-2029
- 3.1.4. Other Businesses
- Figure 3.5: Global Spend on Third-party Trade Surveillance Systems by Other Businesses ($m), 2024-2029
4. Competitor Leaderboard
- 4.1. Why Read This Report
- Figure 4.1: Juniper Research Competitor Leaderboard Vendors: Trade Surveillance Systems
- Figure 4.2: Juniper Research Competitor Leaderboard: Trade Surveillance Systems Vendors
- Figure 4.3: Juniper Research Competitor Leaderboard: Trade Surveillance Systems Vendors Ranking
- Table 4.4: Juniper Research Trade Surveillance Systems Market: Heatmap Results (Part 1 of 2)
- Table 4.5: Juniper Research Trade Surveillance Systems Market: Heatmap Results (Part 2 of 2)
- 4.2. Vendor Profiles
- 4.2.1. ACA Group
- i. Corporate
- ii. Geographical Spread
- iii. Key Clients & Strategic Partnerships
- iv. High-level View of Offerings
- v. Juniper Research's View: Key Strengths & Strategic Development Opportunities
- 4.2.2. Aquis Exchange
- i. Corporate
- Figure 4.6: Aquis' Financial Snapshot ($m), (Converted from GBP at 1.24)
- ii. Geographical Spread
- iii. Key Clients & Strategic Partnerships
- iv. High-level View of Offerings
- v. Juniper Research's View: Key Strengths & Strategic Development Opportunities
- i. Corporate
- 4.2.3. b-next
- i. Corporate
- ii. Geographical Spread
- iii. Key Clients & Strategic Partnerships
- iv. High-level View of Offerings
- v. Juniper Research's View: Key Strengths & Strategic Development Opportunities
- 4.2.4. eflow Global
- i. Corporate
- ii. Geographical Spread
- iii. Key Clients & Strategic Partnerships
- iv. High-level View of Offerings
- v. Juniper Research's View: Key Strengths & Strategic Development Opportunities
- 4.2.5. Eventus Systems
- i. Corporate
- ii. Geographical Spread
- iii. Key Clients & Strategic Partnerships
- iv. High-level View of Offerings
- v. Juniper Research's View: Key Strengths & Strategic Development Opportunities
- 4.2.6. FIS
- i. Corporate
- Figure 4.7: FIS Financial Snapshot ($m), 2021-2024
- ii. Geographical Spread
- iii. Key Clients & Strategic Partnerships
- iv. High-level View of Offerings
- v. Juniper Research's View: Key Strengths & Strategic Development Opportunities
- i. Corporate
- 4.2.7. Nasdaq
- i. Corporate
- ii. Geographical Spread
- iii. Key Clients & Strategic Partnerships
- iv. High-level View of Offerings
- v. Juniper Research's View: Key Strengths & Strategic Development Opportunities
- 4.2.8. Nexi Group
- i. Corporate
- Figure 4.8: Nexi Group's Financial Snapshot ($m) Converted from Euro at 1.05
- ii. Geographical Spread
- iii. Key Clients & Strategic Partnerships
- iv. High-level View of Offerings
- v. Juniper Research's View: Key Strengths & Strategic Development Opportunities
- i. Corporate
- 4.2.9. NICE Actimize
- i. Corporate
- Table 4.9: NICE Actimize's Financial Performance ($m), 2020-2023
- ii. Geographical Spread
- iii. Key Clients & Strategic Partnerships
- iv. High-level View of Offerings
- v. Juniper Research's View: Key Strengths & Strategic Development Opportunities
- i. Corporate
- 4.2.10. Scila
- i. Corporate
- ii. Geographical Spread
- iii. Key Clients & Strategic Partnerships
- iv. High-level View of Offerings
- v. Juniper Research's View: Key Strengths & Strategic Development Opportunities
- 4.2.11. Software AG
- i. Corporate
- Figure 4.10: Software AG's Financial Snapshot ($m), converted from Euro at 1.05
- ii. Geographical Spread
- iii. Key Clients & Strategic Partnerships
- iv. High-level View of Offerings
- Figure 4.11: Software AG's Market Surveillance
- v. Juniper Research's View: Key Strengths & Strategic Development Opportunities
- i. Corporate
- 4.2.12. SteelEye
- i. Corporate
- ii. Geographical Spread
- iii. Key Clients & Strategic Partnerships
- iv. High-level View of Offerings
- Figure 4.12: SteelEye's Scope of Data Sources for Archiving and Monitoring
- v. Juniper Research's View: Key Strengths & Strategic Development Opportunities
- 4.2.13. SymphonyAI Sensa
- i. Corporate
- Table 4.13: SymphonyAI Sensa's Investment Rounds, 2012-2015
- ii. Geographical Spread
- iii. Key Clients & Strategic Partnerships
- iv. High-level View of Offerings
- v. Juniper Research's View: Key Strengths & Strategic Development Opportunities
- i. Corporate
- 4.2.14. Trading Technologies
- i. Corporate
- ii. Geographical Spread
- iii. Key Clients & Strategic Partnerships
- iv. High-level View of Offerings
- Figure 4.14: Trading Technologies-R Trade Surveillance
- v. Juniper Research's View: Key Strengths & Strategic Development Opportunities
- 4.2.15. TradingHub
- i. Corporate
- ii. Geographical Spread
- iii. Key Clients & Strategic Partnerships
- iv. High-level View of Offerings
- v. Juniper Research's View: Key Strengths & Strategic Development Opportunities
- 4.2.16. Trapets
- i. Corporate
- ii. Geographical Spread
- iii. Key Clients & Strategic Partnerships
- iv. High-level View of Offerings
- v. Juniper Research's View: Key Strengths & Strategic Development Opportunities
- 4.2.1. ACA Group
5. Data & Forecast
- 5.1. Introduction
- 5.2. Methodology & Assumptions
- Figure 5.1: Trade Surveillance Systems Forecast Methodology - Financial Services (Large, Medium, and Small Financial Institutions)
- Figure 5.2: Trade Surveillance Systems Forecast Methodology - Other Businesses
- 5.3. Trade Surveillance Systems Market
- 5.3.1. Total Spend on Trade Surveillance Systems
- Figure & Table 5.3: Total Spend on Third-party Trade Surveillance Systems ($m), Split by 8 Key Regions, 2024-2029
- Table 5.4: Total Spend on Third-party Trade Surveillance Systems ($m), Split by Segment, 2024-2029
- 5.3.2. Total Spend on Third-party Trade Surveillance Systems by Large Financial Institutions
- Figure & Table 5.5: Total Spend on Third-party Trade Surveillance Systems by Large Financial Institutions ($m), 2024-2029
- 5.3.3. Total Spend on Third-party Surveillance Systems by Medium-sized Financial Institutions
- Figure & Table 5.6: Total Spend on Third-party Trade Surveillance Systems by Medium-sized Financial Institutions ($m), 2024-2029
- 5.3.4. Total Spend on Third-party Trade Surveillance Systems by Small-sized Financial Institutions
- Figure & Table 5.7: Total Spend on Third-party Trade Surveillance Systems by Small-sized Businesses ($m), Split by 8 Key Regions, 2024-2029
- 5.3.5. Total Spend on Third-party Trade Surveillance Systems by Other Businesses
- Figure & Table 5.8: Total Spend on Third-party Trade Surveillance Systems by Other Businesses ($m), Split by 8 Key Regions, 2024-2029
- 5.3.1. Total Spend on Trade Surveillance Systems


