


 |
市场调查报告书
商品编码
1703509
CPaaS - 全球市场 2025-2029Global CPaaS Market: 2025-2029 |
||||||
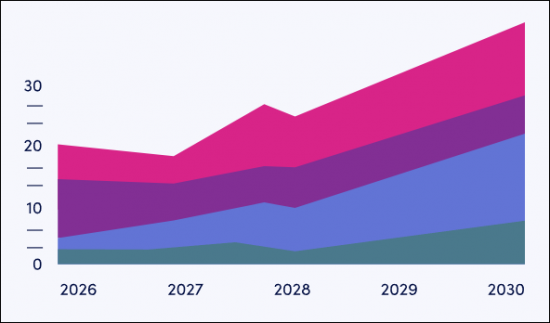
广告科技合作推动成长,CPaaS 营收预计明年将超过 340 亿美元
| 关键统计数据 | |
|---|---|
| 2025 年市值: | 302亿美元 |
| 2029 年市值: | 481亿美元 |
| 2025年至2029年的市场成长率 | 60% |
| 预测期: | 2025-2029 |
该研究包对未来 12 个月推动通讯平台即服务 (CPaaS) 市场发展的关键因素进行了全面的分析。特别是,它关注 CPaaS 平台如何转变其服务以满足对富媒体管道和对话讯息日益增长的需求。随着讯息传递市场动盪,包括价格上涨和围绕简讯的诈欺行为,本报告成为利益相关者瞭解未来一年 CPaaS 关键投资机会的重要工具。
本报告提供了 11 个管道和 6 个垂直领域的 CPaaS 流量和收入预测,并针对最新的市场趋势和机会进行了深入研究。它还包括一个具有广泛分析的竞争排行榜,并以对 CPaaS 领域 15 位关键参与者的访谈为后盾。
主要特点
- 市场动态:提供 CPaaS 市场格局的详细见解,并评估未来市场成长的关键推动因素,包括富媒体和对话式讯息服务对市场带来的颠覆。它强调了 CPaaS 公司应关注的关键增值服务和合作伙伴关係,以便在未来的市场上取得成功,以及 CPaaS 支援服务的机会。该报告还研究了银行、政府和公共服务、医疗保健、旅游、零售和电子商务以及票务等主要行业的企业采用 CPaaS 的趋势。此外,该报告还提供了国家准备指数,评估了 61 个国家的市场机会,确定了 CPaaS 供应商今年应该关注哪些国家。
- 关键要点和策略建议:深入分析 CPaaS 市场的关键发展机会、产业趋势和见解,以及为利害关係人提供关键策略建议。
- 基准产业预测:提供 CPaaS 市场规模和预测,包括 CPaaS 总流量的五年预测,以及按通路和产业划分的收入预测,包括银行、政府和公共服务、医疗保健、旅游和旅游业、零售和电子商务、票务等。它还预测了使用 CPaaS 平台的公司总数和 CPaaS 订阅总收入。
- Juniper Research 竞争排行榜:评估 18 家 CPaaS 供应商的能力。
样本视图
市场数据和预测报告
样本
市场趋势/策略报告

市场数据及预测报告
我们的研究套件包括一整套市场预测数据,其中包含 380 个表格和超过 263,000 个数据点。该调查套件包括以下指标:
- CPaaS 流量和收入(按管道)
- 电子邮件
- MMS
- 行动身份API
- 推播通知
- 线上和行动聊天机器人
- OTT 商业讯息传递
- RCS 商业讯息传递
- 简讯
- 社交媒体
- 影片
- 声音的
- CPaaS 流量和收入(按行业划分)
- 银行
- 政府和公共服务
- 卫生保健
- 零售/电子商务
- 门票销售
- 旅游/观光
- 使用 CPaaS 平台的公司总数
- CPaaS 订阅总收入
Juniper Research 互动式预测 (Excel) 具有以下功能:
- 统计分析:显示数据期间内所有地区和国家的数据,并允许您搜寻特定指标。可以轻鬆修改图表并将其汇出到剪贴簿。
- 国家资料工具:此工具可让您查看预测期间内所有主要地区和国家的指标。您可以使用搜寻栏缩小想要查看的指标范围。
- 国家比较工具:您可以选择不同的国家进行比较。该工具包括汇出图表的功能。
- 假设分析:透过五个互动式场景将预测指标与您自己的假设进行比较。
竞技排行榜报告
竞争排行榜报告对 CPaaS 领域的 18 家主要供应商进行了详细的评估和市场定位。
|
|
目录
市场趋势/策略
第1章 重点与策略建议
- 关键要点和策略建议
- 很重要的一点
- 战略建议
第2章 未来市场展望
- CPaaS 市场:简介
- CPaaS 市场的未来前景
- CPaaS 商业模式
- 增值服务
- CPaaS 合作伙伴关係
- 启用 CPaaS
第3章:产业趋势与未来成长
- 行业概况
- 银行业务
- 卫生保健
- 零售/电子商务
- 旅行和旅游
第4章 国家储备指数
- 国家储备指数:简介
- 受瞩目的市场
- 不断成长的市场
- 饱和的市场
- 新兴市场
竞争排行榜
第1章 竞争排行榜
第2章 公司简介
- Bandwidth
- CEQUENS
- Cisco Webex
- CM.com
- Comviva
- GMS (Global Message Services)
- Infobip
- LINK Mobility
- Monty Mobile
- Route Mobile (Proximus Group)
- Sinch
- Soprano Design
- Syniverse
- Tanla Platforms
- Tata Communications
- Twilio
- Vonage
- 相关研究
数据/预测
第1章 市场预测及重点
- CPaaS 预测:简介
- CPaaS 市场总价值
- CPaaS 流量收入(按通路)
- CPaaS 流量收入(按行业)
第2章 CPaaS 移动讯息传递预测
- CPaaS SMS 与 MMS 预测:简介
- CPaaS SMS 和 MMS:预测方法
- CPaaS SMS 市场整体状况
- CPaaS MMS 市场整体状况
- CPaaS RCS 讯息市场
- 预测方法
- 总收入
- CPaaS OTT 讯息市场
- 预测方法
- 总收入
- CPaaS 身份 API 市场
- 预测方法
- 总收入
第3章 语音与视讯市场预测
- CPaaS 音讯视讯:简介
- 预测方法
- CPaaS语音总收入
- CPaaS 影片总收入
'CPaaS Revenue to Exceed $34bn Next Year, as AdTech Partnerships Drive Growth'
| KEY STATISTICS | |
|---|---|
| Total market value in 2025: | $30.2bn |
| Total market value in 2029: | $48.1bn |
| Market growth 2025-2029: | 60% |
| Forecast period: | 2025-2029 |
Overview
Our latest "Communications Platform-as-a-Service (CPaaS)" research suite comprises a comprehensive analysis of the key factors driving this evolving market over the next 12 months; emphasising how CPaaS platforms must pivot their services as demand for rich media channels and conversational messaging grows. With the recent disruption within the messaging market, including the high price and fraud surrounding SMS, the report is an essential tool for stakeholders to understand where the key investment opportunities are for CPaaS over the next year.
The CPaaS market report includes several different options that can be purchased separately. This includes access to a market forecast of CPaaS traffic and revenue, split by 11 channels and six industries, and a detailed study highlighting the latest market trends and opportunities. It also includes a Competitor Leaderboard document containing an extensive analysis of the major players in the CPaaS space, backed by 15 interviews with leading market players. The coverage can also be purchased as a full research suite, containing all these elements and including a substantial discount.
The study will provide stakeholders with key information on how to succeed in the CPaaS market; including how growth in rich media and conversational messaging must impact CPaaS players' future strategies. It assesses the key value-added services that CPaaS players must offer, including rich media tools, chatbots, and network application programming interfaces (APIs). Its extensive coverage makes the CPaaS research suite an incredibly valuable resource for examining the future of this market.
All report content is delivered in the English language.
Key Features
- Market Dynamics: Provides detailed insight into the outlook of the CPaaS market; assessing key drivers to future market growth, including the disruption that rich media and conversational messaging services will have on the market. It addresses the key value-added services and partnerships that CPaaS players must focus on for future success in the market, as well as the opportunity for CPaaS enablement services. The research also explores enterprise adoption of CPaaS across key industries, including banking, government & public services, healthcare, travel & tourism, retail & eCommerce, and ticketing. Moreover, it includes a Country Readiness Index which assesses the market opportunities across 61 countries; identifying countries which must be of focus for CPaaS vendors this year.
- Key Takeaways & Strategic Recommendations: In-depth analysis of key development opportunities, industry trends, and findings within the CPaaS market; accompanied by key strategic recommendations for stakeholders.
- Benchmark Industry Forecasts: This provides market sizing and forecasts for CPaaS, including five-year forecasts for total CPaaS traffic, and revenue split by channel and sector, including banking, government & public services, healthcare, travel & tourism, retail & eCommerce, and ticketing. It also forecasts the total number of businesses using CPaaS platforms and the total CPaaS subscription revenue.
- Juniper Research Competitor Leaderboard: Key industry player capability and capacity assessment for 18 CPaaS vendors, via the Juniper Research Competitor Leaderboard.
SAMPLE VIEW
Market Data & Forecasting Report
The numbers tell you what's happening, but our written report details why, alongside the methodologies.
SAMPLE VIEW
Market Trends & Strategies Report
A comprehensive analysis of the current market landscape, alongside strategic recommendations.
Market Data & Forecasting Report
The market-leading research suite for the "CPaaS" market includes access to the full set of market forecast data of 380 tables and over 263,000 datapoints. Metrics in the research suite include:
- Total CPaaS traffic and revenue, split by channel:
- MMS
- Mobile Identity APIs
- Push Notifications
- Online & Mobile Chatbots
- OTT Business Messaging
- RCS Business Messaging
- SMS
- Social Media
- Video
- Voice
- Total CPaaS traffic and revenue is then further split by sector:
- Banking
- Government & Public Services
- Healthcare
- Retail & eCommerce
- Ticketing
- Travel & Tourism
- Total Number of Businesses Using CPaaS Platforms
- Total CPaaS Subscription Revenue
Juniper Research Interactive Forecast Excel contains the following functionality:
- Statistics Analysis: Users benefit from the ability to search for specific metrics, displayed for all regions and countries across the data period. Graphs are easily modified and can be exported to the clipboard.
- Country Data Tool: This tool lets users look at metrics for all key regions and countries in the forecast period. Users can refine the metrics displayed via a search bar.
- Country Comparison Tool: Users can select and compare different countries. The ability to export graphs is included in this tool.
- What-if Analysis: Here, users can compare forecast metrics against their own assumptions, via five interactive scenarios.
Market Trends & Strategies Report
This market study examines the "CPaaS" landscape in detail; assessing how disruption within the messaging market will impact the future growth of the CPaaS market, as well as which channels will be key to this growth. The report delivers an in-depth analysis of the strategic opportunities for vendors, addressing key partnership opportunities, industry demand, and the potential of CPaaS enablement services.
It also evaluates country level opportunities for CPaaS growth, via Juniper Research's Country Readiness Index; identifying the key markets where enterprises are expected to adopt the advanced capabilities of CPaaS which will lead to higher profit margins for CPaaS vendors, and therefore the markets that vendors should focus on next year.
Competitor Leaderboard Report
The Competitor Leaderboard report provides a detailed evaluation and market positioning for 18 leading vendors in the "CPaaS" space. The vendors are positioned as either established leaders, leading challengers or disruptors and challengers based on capacity and capability assessments:
|
|
This document is centred around the Juniper Research Competitor Leaderboard; a vendor positioning tool that provides an at-a-glance view of the competitive landscape in a market, backed by a robust methodology.
Table of Contents
Market Trends & Strategies
1. Key Takeaways & Strategic Recommendations
- 1.1. Key Takeaways & Strategic Recommendations
- 1.2. Key Takeaways
- 1.3. Strategic Recommendations
2. Future Market Outlook
- 2.1. CPaaS Market Introduction
- 2.2. Future Outlook For the CPaaS Market
- Figure 2.1: Global CPaaS Market Value in 2025, Split by 8 Key Regions: $30.1 billion
- Figure 2.2: CPaaS Revenue by Channel ($m), 2025-2029
- 2.3. CPaaS Business Model
- 2.3.1. Value-added Services
- i. Rich Messaging Channel Tools
- Figure 2.3: Marketing Message in Rich Media and SMS Format
- ii. Network APIs
- iii. Chatbots
- i. Rich Messaging Channel Tools
- 2.3.2. CPaaS Partnerships
- 2.3.3. CPaaS Enablement
- 2.3.1. Value-added Services
3. Industry Trends & Future Growth
- 3.1. Industry Overview
- Figure 3.1: CPaaS Market Share by Industry, 2025
- 3.1.1. Banking
- Figure 3.2: CPaaS Revenue in the Banking Industry ($m), Split by Channel, 2025-2029
- 3.1.2. Healthcare
- Figure 3.3: CPaaS Revenue in the Healthcare Industry ($m), Split by Channel, 2025-2029
- 3.1.3. Retail & eCommerce
- Figure 3.4: CPaaS Revenue in the Retail & eCommerce Industry ($m), Split by Channel, 2025-2029
- 3.1.4. Travel & Tourism
- Figure 3.5: CPaaS Revenue in the Travel & Tourism Industry ($m), Split by Channel, 2025-2029
- Figure 3.6: Example WhatsApp Message For Travel & Tourism
4. Country Readiness Index
- 4.1. Introduction to the Country Readiness Index
- Figure 4.1: Country Readiness Index Regional Definitions
- Table 4.2: Juniper Research Country Readiness Index Scoring Criteria: CPaaS Disruption
- Figure 4.3: Juniper Research Country Readiness Index: CPaaS
- Table 4.4: Juniper Research CPaaS Country Readiness Index: List of Country Categorisation
- 4.2. Focus Markets
- 4.2.1. Investment in 5G and Cloud Services Provides Basis for CPaaS Adoption in Focus Markets
- Figure 4.5: Proportion of SIMs that are 5G in Key Focus Markets in 2025 (%)
- 4.2.2. Clarity of Regulations Simplifies Compliance, Encouraging Enterprise Adoption
- 4.2.3. High Number of Rich Media Messaging Users in Focus Markets to Boost Adoption for Marketing Use Cases
- Figure 4.6: Proportion of Mobile Subscribers that Subscribe to OTT Messaging Applications in Key Focus Markets in 2025 (%)
- 4.2.1. Investment in 5G and Cloud Services Provides Basis for CPaaS Adoption in Focus Markets
- 4.3. Growth Markets
- 4.3.1. High Advertising Spend and Penetration of Rich Messaging Channels Indicates Future Demand for Marketing Use Cases
- Table 4.7: Average Spend per Business on Digital Advertising in Israel and Malaysia ($)
- 4.3.1. High Advertising Spend and Penetration of Rich Messaging Channels Indicates Future Demand for Marketing Use Cases
- 4.4. Saturated Markets
- 4.4.1. High Existing CPaaS Traffic, but Limited Opportunity for Growth with Rich Media Use Cases
- 4.5. Developing Markets
- 4.5.1. Vague or Highly Stringent Regulatory Frameworks
- 4.5.2. Low Demand for Advanced Capabilities of CPaaS Platforms
- Figure 4.8: Average Number of Chatbot Accesses per User per Month in Key Developing Markets in 2025
- Table 4.9: Juniper Research Competitor Leaderboard Scoring Heatmap: North America
- Table 4.10: Juniper Research Competitor Leaderboard Scoring Heatmap: Latin America
- Table 4.11: Juniper Research Competitor Leaderboard Scoring Heatmap: West Europe
- Table 4.12: Juniper Research Competitor Leaderboard Scoring Heatmap: Central & East Europe
- Table 4.13: Juniper Research Competitor Leaderboard Scoring Heatmap: Far East & China
- Table 4.14: Juniper Research Competitor Leaderboard Scoring Heatmap: Indian Subcontinent
- Table 4.15: Juniper Research Competitor Leaderboard Scoring Heatmap: Rest of Asia Pacific
- Table 4.16: Juniper Research Competitor Leaderboard Scoring Heatmap: Africa & Middle East
Competitor Leaderboard
1. Competitor Leaderboard
2. Company Profiles
- 2.1.1. Bandwidth
- i. Corporate Information
- Table 2.1: Bandwidth's Select Financial Information ($m), 2023-2024
- ii. Geographical Spread
- iii. Key Clients & Strategic Partnerships
- iv. High-level View of Offerings
- v. Juniper Research's View: Key Strengths & Strategic Development Opportunities
- i. Corporate Information
- 2.1.2. CEQUENS
- 2.1.3. Cisco Webex
- Table 2.3: Cisco's Selected Financial Information ($bn), Fiscal Year 2022-2024
- v. Juniper Research's View: Key Strengths & Strategic Development Opportunities
- 2.1.4. CM.com
- i. Corporate Information
- Table 2.4: Relevant Acquisitions Made by CM.com, 2020-present
- Table 2.5: CM.com's Select Financial Information (Euro-m), 2022-2024
- ii. Geographical Spread
- iii. Key Clients & Strategic Partners
- iv. High-level View of Offerings
- v. Juniper Research's View: Key Strengths & Strategic Development Opportunities
- i. Corporate Information
- 2.1.5. Comviva
- i. Corporate Information
- ii. Geographical Spread
- iii. Key Clients & Strategic Recommendations
- iv. High-level View of Offerings
- v. Juniper Research's View: Key Strengths & Strategic Development Opportunities
- 2.1.6. GMS (Global Message Services)
- i. Corporate Information
- ii. Geographical Spread
- iii. Key Clients & Strategic Partners
- iv. High-level View of Offerings
- v. Juniper Research's View: Key Strengths & Strategic Development Opportunities
- 2.1.7. Infobip
- i. Corporate Information
- Table 2.6: Infobip's Acquisitions - April 2021 to Present
- ii. Geographical Spread
- iii. Key Clients & Strategic Partnerships
- iv. High-level View of Offerings
- v. Juniper Research's View: Key Strengths & Strategic Development Opportunities
- i. Corporate Information
- 2.1.8. LINK Mobility
- i. Corporate Information
- iv. High-level View of Offerings
- v. Juniper Research's View: Key Strengths & Strategic Development Opportunities
- v. Juniper Research's View: Key Strengths & Strategic Development Opportunities
- 2.1.10. Monty Mobile
- 2.1.11. Route Mobile (Proximus Group)
- i. Corporate Information
- Table 2.7: Route Mobile's Financial Information (Indian Rupee- Cr), FY 2021-22 - FY 2023-24
- ii. Geographical Spread
- iii. Key Clients & Strategic Partners
- iv. High-level View of Offerings
- v. Juniper Research's View: Key Strengths & Strategic Development Opportunities
- i. Corporate Information
- 2.1.12. Sinch
- i. Corporate Information
- Table 2.8: Sinch's Most Recent Acquisitions, 2020-2021
- Table 2.9: Sinch's Select Financial Information (SEKm), 2022-2024
- ii. Geographical Spread
- iii. Key Clients & Strategic Partnerships
- iv. High-level View of Offerings
- v. Juniper Research's View: Key Strengths & Strategic Development Opportunities
- i. Corporate Information
- 2.1.13. Soprano Design
- i. Corporate Information
- ii. Geographical Spread
- Figure 2.10: Soprano Design's Global Reach and Support Network
- iii. Key Clients & Strategic Partnerships
- iv. High-level View of Offerings
- v. Juniper Research's View: Key Strengths & Strategic Development Opportunities
- 2.1.14. Syniverse
- i. Corporate Information
- ii. Geographical Spread
- iii. Key Customers & Strategic Partnerships
- iv. High-level View of Offerings
- v. Juniper Research's View: Key Strengths & Strategic Development Opportunities
- 2.1.15. Tanla Platforms
- i. Corporate Information
- ii. Geographical Spread
- iii. Key Clients & Strategic Partnerships
- iv. High-level View of Offerings
- v. Juniper Research's View: Key Strengths & Strategic Development Opportunities
- 2.1.16. Tata Communications
- i. Corporate Information
- Table 2.11: Tata Communications' Select Financial Information (Indian Rupee- in crore), FY 2022-23 & FY 2023-24
- ii. Geographical Spread
- iii. Key Clients & Strategic Partnerships
- v. Juniper Research's View: Key Strengths & Strategic Development Opportunities
- i. Corporate Information
- 2.1.17. Twilio
- i. Corporate Information
- Table 2.12: Twilio's Revenue Information 2021-present
- ii. Geographical Spread
- iii. Key Clients & Strategic Partnerships
- iv. High-level View of Offerings
- v. Juniper Research's View: Key Strengths & Strategic Development Opportunities
- i. Corporate Information
- 2.1.19. Vonage
- i. Corporate Information
- ii. Geographical Spread
- iii. Key Clients & Strategic Partnerships
- iv. High-level View of Offerings
- v. Juniper Research's View: Key Strengths & Strategic Development Opportunities
- Table 2.13: Juniper Research Competitor Leaderboard Scoring Criteria
- 2.2. Related Research
Data & Forecasting
1. Market Forecasts & Key Takeaways
- 1.1. Introduction to CPaaS Forecasts
- Figure 1.1: Key CPaaS Forecast Information
- 1.1.1. Total CPaaS Market Value
- Figure & Table 1.2: Total CPaaS Market Value ($m), Split by 8 Key Regions 2025-2029
- 1.1.2. Total CPaaS Traffic Revenue by Channel
- Figure & Table 1.3: Total CPaaS Traffic Revenue ($m), Split by 11 Key Channels, 2025-2029
- 1.1.3. CPaaS Traffic Revenue by Sector
- Figure & Table 1.4: Total CPaaS Traffic Revenue ($m), Split by 6 Key Sectors, 2025-2029
2. CPaaS Mobile Messaging Forecasts
- 2.1. Introduction to CPaaS SMS & MMS Forecasts
- 2.1.1. CPaaS SMS & MMS Forecast Methodology
- Figure 2.1: CPaaS SMS Forecast Methodology
- Figure 2.2: CPaaS MMS Forecast Methodology
- 2.1.2. Total CPaaS SMS Market
- Figure & Table 2.3: Total CPaaS SMS Revenue ($m), Split by 8 Key Regions, 2025-2029
- 2.1.3. Total CPaaS MMS Market
- Figure & Table 2.4: Total CPaaS SMS Revenue ($m), Split by 8 Key Regions, 2025-2029
- 2.1.1. CPaaS SMS & MMS Forecast Methodology
- 2.2. CPaaS RCS Messaging Market
- 2.2.1. RCS Business Messaging Forecast Methodology
- Figure 2.5: RCS Business Messaging Forecast Methodology
- 2.2.2. Total CPaaS RCS Revenue
- Figure & Table 2.6: Total CPaaS RCS Revenue ($m), Split by 8 Key Regions, 2025-2029
- 2.2.1. RCS Business Messaging Forecast Methodology
- 2.3. CPaaS OTT Messaging Market
- 2.3.1. OTT Business Messaging Forecast Methodology
- Figure 2.7: OTT Business Messaging Forecast Methodology
- 2.3.2. Total CPaaS OTT Business Messaging Revenue
- Figure & Table 2.8: Total CPaaS Revenue from OTT Business Messaging Traffic ($m), Split by 8 Key Regions, 2025-2029
- 2.3.1. OTT Business Messaging Forecast Methodology
- 2.4. CPaaS Identity API Market
- 2.4.1. Identity API Forecast Methodology
- Figure 2.9: Identity API Forecast Methodology
- 2.4.2. Total CPaaS Identity API Revenue
- Figure & Table 2.10: Total CPaaS Revenue from Mobile Identity API Calls ($m), Split by 8 Key Regions, 2025-2029
- 2.4.1. Identity API Forecast Methodology
3. Voice & Video Market Forecasts
- 3.1. Introduction to CPaaS Voice & Video
- 3.1.1. Voice & Video Forecast Methodology
- Figure 3.1: CPaaS Voice Forecast Methodology
- Figure 3.2: CPaaS Video Forecast Methodology
- 3.1.2. Total CPaaS Voice Revenue
- Figure & Table 3.3: Total CPaaS Voice Service Revenue ($m), Split by 8 Key Regions, 2025-2029
- 3.1.3. Total CPaaS Video Revenue
- Figure & Table 3.4: Total CPaaS Video Service Revenue ($m), Split by 8 Key Regions, 2025-2029
- 3.1.1. Voice & Video Forecast Methodology
 通讯平台即服务 (CPaaS) 市场:2026 年至 2032 年全球市场预测(按服务类型、部署模式、组织规模、应用程式和最终用户划分)
 2026年全球通讯平台即服务(CPaaS)市场报告
 印度通讯平台即服务 (CPaaS) 市场份额分析、行业趋势、统计数据和成长预测 (2026-2031)
 CPaaS(通讯平台即服务)市场规模、份额和成长分析(按部署类型、公司规模、垂直产业和地区划分)-2026-2033年产业预测
 通讯平台即服务 (CPaaS) 市场 - 2025 年至 2030 年预测CPaaS 革命:API、AI 和通讯的新时代
 全球通讯平台即服务市场
 2025-2029年通讯平台即服务(Cpaas)市场
 作为服务的通讯平台市场,规模,占有率,趋势,产业分析报告:各零件,各组织规模,各业界,各地区 - 2025年~2034年的市场预测通讯平台即服务 (CPaaS) 市场:2025 年至 2032 年全球产业分析、规模、占有率、成长、趋势与预测