


 |
市场调查报告书
商品编码
1761192
非接触付款市场资料:2025-2030年Contactless Payments Market Data: 2025-2030 |
||||||
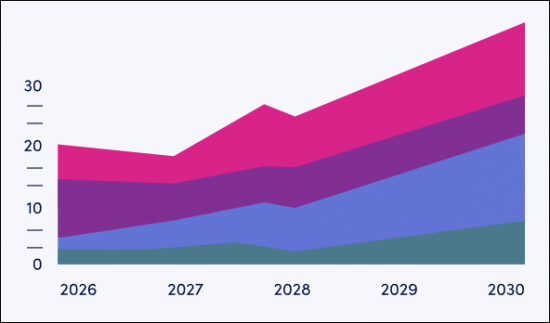
"到 2030 年,非接触式支付市场规模将翻一番,达到 18.1 兆美元 - NFC 票务的推出推动成长"
| 主要统计 | |
|---|---|
| 2025年的整体交易额: | 8兆7,500亿美元 |
| 2030年的整体交易额: | 18兆1,000亿美元 |
| 从2025年~2030年的市场成长率: | 106.9% |
| 预测期间: | 2025-2030年 |
本报告提供全面的市场数据,包括采用非接触式支付技术的行动钱包的普及率、非接触式交易的成长及其相关价值。该数据套件包含一整套预测数据,包含 139 个表格和超过 60,000 个数据点,以及一份分析成长原因的随附报告。研究套件中包含的指标包括:
- 非接触式支付用户数量
- 非接触式支付交易总额
- 年度非接触式支付交易总额
所有报告内容均提供英文版本。
主要的特征:
这些指标按以下主要细分领域分类:
- 非接触式卡
- 行动支付
- Apple Pay
- Google Pay
- Samsung Pay
- 其他OEM支付
- 穿戴式装置支付
- 非接触式票务支付
预测资料还包括非接触式标记化和非接触式ATM的市场规模。
资料与互动式预测
互动式预测(Excel)包含以下功能:
- 统计分析:您可以搜寻资料期间所有地区和国家显示的特定指标。图表可以轻鬆修改并汇出到剪贴簿。
- 国家/地区资料工具:您可以查看预测期间内所有地区和国家的指标。您可以使用搜寻栏缩小显示的指标范围。
- 国家比较工具:您可以选择特定的国家进行比较。此工具包含汇出图表的功能。
- 假设分析:五个互动式场景允许使用者比较预测假设。
样品view
市场资料&预测报告
目录
第1章 简介
- 非接触式支付的主要趋势和发展
- 非接触式支付是预设选择
- A2A非接触式支付在门市扩展
- Soft POS为非接触式支付开闢新市场
- 跨境二维码支付方案推动东南亚非接触式支付发展亚洲
- 生物辨识身分验证是非接触式支付的下一代发展方向
- QR编码付款
- i.优势
- ii.弱点
- NFC
- i.优势
- ii.弱点
- 结论
第2章 调查手法与前提
第3章 预测的摘要
- 非接触付款的利用预测
- 非接触机制:卡,行动,穿戴式
- 非接触付款所使用的行动装置的数
- 非接触交易数量:零售付款及票务
- 非接触交易额:零售付款及票务
第4章 非接触卡片付款
- 非接触卡的利用预测
- 非接触支付卡的使用情形
- 非接触卡交易预测
- 整体交易数量
- 整体交易额
第5章 行动非接触付款
- 非接触行动的利用预测
- 非接触付款所使用的NFC支援终端
- OEM Pay非接触用户数
- 非接触行动零售付款交易数量
- 非接触行动零售付款交易额
第6章 穿戴式非接触付款
- 智慧穿戴式非接触付款的利用预测
- 非接触付款实现的穿戴式
- 智慧穿戴式非接触付款交易数量
- 智慧穿戴式非接触付款交易额
第7章 NFC票
- NFC票利用预测
- NFC票用户
- NFC票交易数量
- NFC票交易额
第8章 非接触权标化
- 非接触权标化的预测
- 非接触权标化的数量
- 非接触权标化的收益
第9章 非接触ATM
- 非接触ATM预测
- 非接触ATM的运作情形
'Contactless Payment Value to Double by 2030, Reaching $18.1 Trillion, Accelerated by NFC Ticketing Roll-outs'
| KEY STATISTICS | |
|---|---|
| Total transaction value in 2025: | $8.75tn |
| Total transaction value in 2030: | $18.1tn |
| 2025 to 2030 market growth: | 106.9% |
| Forecast period: | 2025-2030 |
Overview
Our "Contactless Payments" market analysis provides exhaustive data coverage of the market in its entirety, including the adoption of mobile wallets featuring contactless payment technology, the growth of contactless transactions and its associated values. The data suite includes access to the full set of forecast data of 139 tables and over 60,000 datapoints, as well as an accompanying report analysing the reasons for growth. The metrics comprised in the research suite include:
- The number of users of contactless payments
- The total transaction value of contactless payments
- The total volume of contactless payments made annually.
All report content is delivered in the English language.
Key Features
These metrics are split by the following key segments:
- Contactless Cards
- Mobile Payments, further split by:
- Apple Pay
- Google Pay
- Samsung Pay
- Other Original Equipment Manufacturer (OEM) Pay
- Wearable Payments
- Contactless Ticketing Payments
The forecast data also includes market sizing for contactless tokenisation and contactless-enabled ATMs.
The data itself is accompanied by a Data & Forecasting report; analysing the main drivers of growth across key forecast metrics, as well as explaining the fundamental methodology and assumptions involved. Taken together, the research is a vital tool for sizing the contactless payments market.
Data & Interactive Forecast
Juniper Research's Interactive Forecast Excel contains the following functionality:
- Statistics Analysis: Users benefit from the ability to search for specific metrics, displayed for all regions and countries across the data period. Graphs are easily modified and can be exported to the clipboard.
- Country Data Tool: This tool lets users look at metrics for all regions and countries in the forecast period. Users can refine the metrics displayed via a search bar.
- Country Comparison Tool: Users can select and compare specific countries. The ability to export graphs is included in this tool.
- What-if Analysis: Here, users can compare forecast metrics against their own assumptions, via 5 interactive scenarios.
SAMPLE VIEW
Market Data & Forecasting Report
The numbers tell you what's happening, but our written report details why, alongside the methodologies.
Table of Contents
1. Introduction
- 1.1. Introduction
- 1.2. Key Trends & Developments Within Contactless Payments
- 1.2.1. Contactless Payments Are the Default Choice
- 1.2.2. Expansion of A2A Contactless Payments In-store
- Figure 1.1: Google Pay UPI Tap & Pay Methods
- 1.2.3. Soft POS Is Opening New Markets for Contactless
- Figure 1.2: How to Use Soft POS
- Figure 1.3: Tap to Pay on iPhone
- 1.2.4. Cross-border QR Code Payment Schemes Will Boost Contactless Payments in Southeast Asia
- Figure 1.4: Prominent Advances in Cross-border QR Code Schemes in 2025: Southeast Asia
- 1.2.5. Biometrics as the Next Evolution of Contactless Payments
- 1.2.6. QR Code Payments
- i. Strengths
- ii. Weaknesses
- Figure 1.5: QR Codes - Strengths & Weaknesses
- 1.2.7. NFC
- i. Strengths
- ii. Weaknesses
- Figure 1.6: NFC - Strengths & Weaknesses
- 1.2.8. Conclusion
2. Methodology & Assumptions
- 2.1. Methodology & Assumptions
- Figure 2.1: Contactless Cards Forecast Methodology
- Figure 2.2: NFC Mobile & Wearable Retail Payments Market Forecast Methodology
- Figure 2.3: NFC Mobile Ticketing Forecast Methodology
- Figure 2.4: Contactless Mobile Payment Tokenisation Methodology
3. Forecast Summary
- 3.1. Contactless Payments Usage Forecasts
- 3.1.1. Contactless Mechanisms: Cards, Mobiles and Wearables
- Figure & Table 3.1: Number of Contactless Devices or Cards in Use for Payments (m), Split by Payment Mechanism, 2025-2030
- 3.1.2. Number of Mobile Devices Used for Contactless Payments
- Figure & Table 3.2: Number of Mobile Devices Used for Contactless Payments (m), Split by Payment Provider, 2025-2030
- 3.1.3. Total Contactless Transaction Volume: Retail Payments & Ticketing
- Figure 3.3: Total Number of Contactless Transactions (m), Split by Retail Payments & Ticketing, 2025-2030
- 3.1.4. Total Contactless Transaction Value: Retail Payments & Ticketing
- Figure & Table 3.4: Total Contactless Transaction Value ($m), Split by Retail Payments & Ticketing, 2025-2030
- 3.1.1. Contactless Mechanisms: Cards, Mobiles and Wearables
4. Contactless Card Payments
- 4.1. Contactless Cards Usage Forecasts
- 4.1.1. Contactless Payment Cards in Use
- Figure & Table 4.1: Number of Contactless Payment Cards Used for Contactless Payment (m), Split by 8 Key Regions, 2025-2030
- 4.1.1. Contactless Payment Cards in Use
- 4.2. Contactless Cards Transaction Forecasts
- 4.2.1. Total Transaction Volume
- Figure & Table 4.2: Total Number of Contactless Card Transactions per annum (m), Split by 8 Key Regions, 2025-2030
- 4.2.2. Total Transaction Value
- Figure & Table 4.3: Total Value of Contactless Card Transactions per annum ($m), Split by 8 Key Regions, 2025-2030
- 4.2.1. Total Transaction Volume
5. Mobile Contactless Payments
- 5.1. Contactless Mobile Usage Forecast
- 5.1.1. NFC-enabled Handsets in Use for Contactless Payments
- Figure & Table 5.1: Number of NFC-enabled Handsets (including FeliCa) Using Contactless Payments (m), Split by 8 Key Regions, 2025-2030
- 5.1.2. Number of OEM Pay Contactless Users
- Figure & Table 5.2: Number of OEM Pay Contactless Users (m), Split by Apple Pay, Samsung Pay, Google Pay & Other OEM Pay, 2025-2030
- 5.1.3. Contactless Mobile Retail Payment Transactions Volume
- Figure & Table 5.3: Total Contactless Mobile Retail Payments Transaction Volume per annum (m), Split by 8 Key Regions, 2025-2030
- 5.1.4. Contactless Mobile Retail Payment Transaction Value
- Figure & Table 5.4: Total Value of NFC Retail Payments Transactions ($m), Split by 8 Key Regions, 2025-2030
- 5.1.1. NFC-enabled Handsets in Use for Contactless Payments
6. Wearable Contactless Payments
- 6.1. Smart Wearables Contactless Payment Usage Forecasts
- 6.1.1. Wearables Making Contactless Payments
- Figure & Table 6.1: Number of Active Smart Wearable Devices Making Contactless Payments per annum (m), Split by 8 Key Regions, 2025-2030
- 6.1.2. Smart Wearables Contactless Payment Transaction Volume
- Figure & Table 6.2: Smart Wearable Contactless Payment Transaction Volume per annum (m), Split by 8 Key Regions, 2025-2030
- 6.1.3. Smart Wearable Contactless Payment Transaction Value
- Figure & Table 6.3: Total Smart Wearable Contactless Payment Transaction Value ($m), Split by 8 Key Regions, 2025-2030
- 6.1.1. Wearables Making Contactless Payments
7. NFC Ticketing
- 7.1. NFC Ticketing Usage Forecasts
- 7.1.1. NFC Ticketing Users
- Figure & Table 7.1: Mobile Phone Users Who Use NFC Ticketing (m), Split by 8 Key Regions, 2025-2030
- 7.1.2. NFC Ticketing Transaction Volume
- Figure & Table 7.2: Transaction Volume of NFC Tickets Delivered or Validated (m), Split by 8 Key Regions, 2025-2030
- 7.1.3. NFC Ticketing Transaction Value
- Figure & Table 7.3: Total Transaction Value for NFC Tickets Purchased or Validated per annum ($m), Split by 8 Key Regions, 2025-2030
- 7.1.1. NFC Ticketing Users
8. Contactless Tokenisation
- 8.1. Contactless Tokenisation Forecasts
- 8.1.1. Contactless Tokenisation Volume
- Figure & Table 8.1: Number of Contactless Payments That Are Tokenised per annum (m), Split by 8 Key Regions, 2025-2030
- 8.1.2. Contactless Tokenisation Revenue
- Figure &Table 8.2: Contactless Tokenisation Revenue per annum ($m), Split by Key Regions, 2025-2030
- 8.1.1. Contactless Tokenisation Volume
9. Contactless ATMs
- 9.1. Contactless ATM Forecasts
- 9.1.1. Contactless ATMs in Use
- Figure & Table 9.1: Number of Contactless-enabled ATMs, Split by 8 Key Regions, 2025-2030
- 9.1.1. Contactless ATMs in Use
 2026年Android非接触式支付全球市场报告
 非接触式支付市场:按技术、终端、终端用户和应用划分-2026-2032年全球市场预测工业PDA市场:按类型、作业系统、连接方式、分销管道、应用和最终用户划分,全球预测,2026-2032年
 行动NFC支付市场分析及预测(至2035年):依类型、产品类型、服务、技术、组件、应用、设备、部署模式、最终用户及功能划分非接触式支付市场分析及预测(至2035年):依类型、产品类型、服务、技术、组件、应用、设备、部署模式及最终用户划分近距离支付市场分析及预测(至2035年):依类型、产品类型、服务、技术、组件、应用、设备、最终用户、功能及部署方式划分
 非接触式支付市场规模、份额、成长及全球产业分析:按类型、应用和地区分類的洞察,以及2026-2034年的预测非接触式支付全球市场规模、份额、趋势和成长分析报告(2026-2034)依最终用户、应用程式类型、作业系统、连接方式、部署方式和销售管道的电子支付用PDA市场,全球预测,2026-2032年
 非接触式支付市场预测至2032年:按技术、设备类型、解决方案、应用、最终用户和地区分類的全球分析