


 |
市场调查报告书
商品编码
1788492
智慧建筑市场:2025-2030年Smart Buildings Market: 2025-2030 |
||||||
工业智慧建筑:到 2030 年,能源浪费减少和专业垂直解决方案将推动采用率提升 525%
| 主要统计 | ||
|---|---|---|
| 到2030 年部署的智慧建筑感测器总数: | 4万8,670 | |
| 到 2030 年智慧建筑总收入: | 147亿 | |
| 到2030年为止的智慧大楼总收益: | 1,706亿美元 | |
| 预测期间: | 2025-2030年 | |
本研究套件深入分析和评估了硬体和软体服务供应商如何利用物联网和人工智慧。
本报告涵盖 61 个国家/地区,涵盖商业、工业和住宅三大细分市场的市场规模和预测。此外,报告还包含一份市场格局和策略文件,对主要趋势、挑战和利害关係人建议进行了全面评估。
本报告完全以英文撰写。
主要的特征
- 关键要点和策略建议:本报告深入分析了智慧建筑市场的关键发展机会和洞察,并为利害关係人提供了重要的策略建议。
- 市场动态:深入分析市场中的关键趋势和市场扩张挑战、智慧楼宇系统高度技术性所带来的挑战、消费者和楼宇管理者对安全性、隐私性和工业 5.0 未来影响的持续担忧,并分析市场中的经济驱动因素(按能源消耗和碳足迹驱动计算的能源成本、促进能源成本的零目标)和技术和技术驱动因素(跟踪能源化)。此外,报告还包含 61 个国家的市场成长分析,并提供未来展望。
- 基准产业预测:智慧建筑服务供应商的业务概览,包括商业、工业和住宅领域的智慧建筑技术总收入预测。
- Juniper Research 竞争力排行榜:评估 18 家领先网路营运商的能力。
样品view
市场资料·预测PDF报告
样品
市场趋势·策略报告
市场数据与预测
此研究套件包含 48 个表格和超过 33,000 个资料点的完整预测资料。此研究套件包含以下指标:
- 智慧建筑部署数量
- 智慧建筑感测器采用数量
- 智慧建筑感测器硬体收入
- 智慧建筑平台收入
- 智慧建筑市场价值
这些指标涵盖以下主要市场:
- 商业用
- 产业用
- 住宅用
Juniper Research 互动式预测 Excel 包含以下功能:
- 统计分析:显示资料期间所有地区和国家的统计分析。图表易于编辑,并可汇出至剪贴簿。
- 国家/地区资料工具:此工具可让您查看预测期间内所有地区和国家的指标。您可以使用搜寻栏缩小查看指标的范围。
- 国家比较工具:您可以选择要比较的国家。此工具包含汇出图表的功能。
- 假设分析:透过五个互动式场景,使用者可以比较不同的预测假设。
竞争排行榜报告
竞争力排行榜包括以下主要公司:
|
|
目录
市场趋势与策略
第1章 重要点和策略性建议
- 重要点
- 策略性建议
第2章 市场概要与未来形势
- 市场概要
- 传统大楼 vs 智慧建筑
- 推动市场要素
- 科技加速发展
- MBSaaS(楼宇管理软体即服务,即系统即服务)
- 政府法规与举措
- 智慧工作环境的需求趋势
- 课题
- 安全与网路安全威胁
- 隐私
- 高技术与基础架构部署成本
- 可靠的网路连接
- 复杂性与技术整合
第3章 与市场趋势经营模式分析
- 智慧建筑市场趋势
- 5G
- 高资料吞吐量和低延迟
- 可靠性
- 安全性
- 6G 对智慧建筑的影响
- 工业 4.0 和 5.0
- 安全
- 物理的保全
- 网路安全
- 其他技术领域
- 经营模式分析
竞争排行榜
第1章 Juniper Research的竞争的排行榜
- 智慧建筑-业者简介
- ABB
- Avnet
- Bosch
- Carrier Global Corporation
- Cisco
- Delta Controls
- Hitachi
- Honeywell
- Huawei
- IBM
- Intel
- Johnson Controls
- Legrand
- Schneider Electric
- Siemens
- Telit Cinterion
- Verdigris Technologies
- Boldyn Networks
- 评估手法
- 限制与解释
- 相关调查
资料·预测
第1章 市场资料·预测
- 智慧建筑市场概要
- 智慧建筑预测
- 智慧大楼总数
- 智慧建筑总收益
- 商业用智慧建筑总数
- 产业用智慧建筑总数
- 住宅用智慧建筑总数
'Industrial Smart Buildings: Energy Wastage and Bespoke Vertical Solutions to Drive 525% Surge in Deployments by 2030'
| KEY STATISTICS | |
|---|---|
| Total smart building deployments by 2030: | 486.7m |
| Total smart building sensor deployments by 2030: | 14.7bn |
| Total smart building revenue by 2030: | $170.6bn |
| Forecast period: | 2025-2030 |
Overview
Our "Smart Buildings" research suite provides in-depth analysis and evaluation of how hardware and software service providers are reimagining smart building solutions as living ecosystems, using Internet of Things (IoT) and AI.
The suite includes a data deliverable; sizing the market and providing key forecast data across 61 countries and three market segments - Commercial, Industrial, and Residential. It also includes a Market Trends and Strategies document, which gives a complete assessment of the key trends, challenges, and recommendations for stakeholders. Collectively, they provide a critical tool for understanding this rapidly emerging market; allowing building automation vendors, IoT vendors, energy consumption management vendors, and smart building vendors to shape their future strategy.
All report content is delivered in the English language.
Key Features
- Key Takeaways & Strategic Recommendations: In-depth analysis of key development opportunities and findings within the smart buildings market; accompanied by key strategic recommendations for stakeholders.
- Market Dynamics: Insights into key trends and market expansion challenges within the market; addressing challenges posed by the highly technical nature of smart building systems, as well as ongoing consumer and building manager fears regarding security, privacy and the future impacts of industry 5.0. It analyses economical drivers (energy costs from energy consumption and carbon emission tracking, and net zero goals driving energy efficiency) as well as technological drivers (smart technology such as IoT technologies and digital transformation) within the market. Our Smart Buildings market research also includes a regional market growth analysis on the current development and segment growth of the smart building market in 61 countries; providing a future outlook.
- Benchmark Industry Forecasts: The business overview of smart building service providers includes forecasts for total revenue for smart building technologies, split by commercial, industrial, and residential sectors.
- Juniper Research Competitor Leaderboard: Key player capability and capacity assessment for 18 network operators, via the Juniper Research Competitor Leaderboard.
SAMPLE VIEW
Market Data & Forecasts PDF Report
The numbers tell you what's happening, but our written report details why, alongside the methodologies.
SAMPLE VIEW
Market Trends & Strategies Report
A comprehensive analysis of the current market landscape, alongside strategic recommendations.
Market Data & Forecasts
The market-leading research suite for the "Smart Buildings" market includes access to the full set of forecast data of 48 tables and over 33,000 datapoints. Metrics in the research suite include:
- Smart Building Deployments
- Smart Building Sensors Deployed
- Smart Building Sensor Hardware Revenue
- Smart Building Platform Revenue
- Smart Building Market Value
These metrics are provided for the following key market verticals:
- Commercial
- Industrial
- Residential
Juniper Research Interactive Forecast Excel contains the following functionality:
- Statistics Analysis: Users benefit from the ability to search for specific metrics; displayed for all regions and countries across the data period. Graphs are easily modified and can be exported to the clipboard.
- Country Data Tool: This tool allows users to look at metrics for all regions and countries in the forecast period. Users can refine the metrics displayed via a search bar.
- Country Comparison Tool: Users can select and compare countries. The ability to export graphs is included in this tool.
- What-if Analysis: Here, users can compare forecast metrics against their own assumptions, via five interactive scenarios.
Market Trends & Strategies Report
This report evaluates the global market for smart buildings. It considers the key technical differences between legacy and smart technology, and the challenges in bridging the gap between them going forwards. It also analyses different business models for deploying smart buildings and their pros and cons. Furthermore, it includes Juniper Research's ultimate Key Takeaways and Strategic Recommendations for the smart buildings market; summarising all its analysis.
Competitor Leaderboard Report
This market study includes a Competitor Leaderboard report, which provides detailed evaluation and market positioning of 18 smart buildings vendors. The vendors are positioned as established leaders, leading challengers, or disruptors and challengers, based on product and capability assessments.
Juniper Research's Competitor Leaderboard for Smart Buildings includes the following key players:
|
|
This report is centred around the Juniper Research Competitor Leaderboard; a vendor positioning tool that provides an at-a-glance view of the competitive landscape in a market, backed by a robust methodology.
Table of Contents
Market Trends & Strategies
1. Key Takeaways & Strategic Recommendations
- 1.1. Key Takeaways
- 1.2. Strategic Recommendations
2. Market Overview & Future Landscape
- 2.1.1. Market Overview
- Figure 2.1: Smart Building Technology
- 2.1.2. Traditional vs Smart
- i. Smart Building Sectors
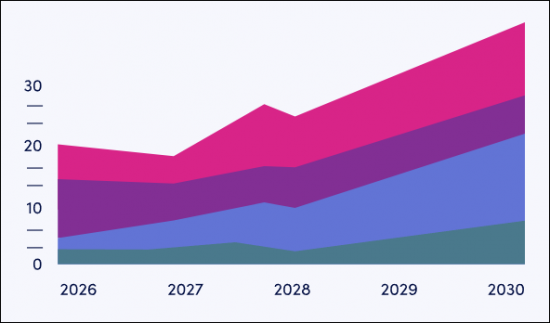
- Figure 2.2: Total Smart Building Deployments, Split by Segment (m), 2025-2030
- i. Smart Building Sectors
- 2.1.3. Market Drivers
- i. Technological Acceleration
- ii. Building Management Systems-as-a-Service (MBSaaS)
- iii. Government Regulation and Initiatives
- iv. Demand Trends for Smart Working Environments
- 2.1.4. Challenges
- i. Security and Cyber Security Threats
- ii. Privacy
- iii. High Cost of Technological and Infrastructural Implementation
- iv. Reliable Network Connection
- v. Complexity and Technological Integration
3. Market Trends & Business Model Analysis
- 3.1. Smart Buildings Market Trends
- Figure 3.1: Smart Buildings Market Revenue ($m) Split by 8 Key Regions, 2021-2030
- 3.1.1 5G
- i. High Data Throughput and Lower Latency
- ii. Reliability
- iii. Security
- Figure 3.1: Proportion of SIMs That Are 5G, Split by 8 Key Regions, 2025-2030
- iv. How 6G Will Impact Smart Buildings
- Figure 3.2: Average Number of Sensors per Residential Smart Building Deployment (m), Split by 8 Key Regions, 2025-2030
- 3.1.2. Industry 4.0 and 5.0
- 3.1.3. Security
- i. Physical Security
- ii. Cyber Security
- 3.1.4. Other Technical Areas
- 3.2. Business Model Analysis
- i. Buying
- ii. Leasing
- iii. Smart Financing
- iv. As-a-Service
- v. Summary
Competitor Leaderboard
1. Juniper Research Competitor Leaderboard
- 1.1. Why Read this Report
- Table 1.1: Juniper Research Competitor Leaderboard: Smart Buildings Market - Vendors Products & Portfolio
- Figure 1.2: Juniper Research Competitor Leaderboard: Smart Buildings Vendors
- Source: Juniper ResearchTable 1.3: Juniper Research Competitor Leaderboard: Smart Buildings Market -18 Vendors
- Table 1.4: Juniper Research Competitor Leaderboard Heatmap - Smart Buildings Vendors (1 of 2)
- Table 1.5: Juniper Research Competitor Leaderboard Heatmap - Smart Buildings Vendors (2 of 2)
- 1.2. Smart Buildings - Vendor Profiles
- 1.2.1. ABB
- i. Corporate
- Table 1.6: ABB's Financial Snapshot ($m), 2022-2025
- ii. Geographical Spread
- iii. Key Clients & Strategic Partnerships
- iv. High-level View of Offerings
- v. Juniper Research's View: Key Strengths & Strategic Opportunities
- i. Corporate
- 1.2.2. Avnet
- i. Corporate
- Table 1.7: Avnet's Financial Snapshot ($m), 2022-2024
- ii. Geographical Spread
- iii. Key Clients & Strategic Partnerships
- iv. High-level View of Offerings
- v. Juniper Research's View: Key Strengths & Strategic Development Opportunities
- i. Corporate
- 1.2.3. Bosch
- i. Corporate
- Table 1.8: Bosch's Financial Snapshot ($m), 2021-2024
- ii. Geographical Spread
- iii. Key Clients & Strategic Partnerships
- iv. High-level View of Offerings
- v. Juniper Research's View: Key Strengths & Strategic Development Opportunities
- i. Corporate
- 1.2.4. Carrier Global Corporation
- i. Corporate
- Table 1.9: Carrier's Financial Snapshot ($m), 2022-2024
- ii. Geographical Spread
- iii. Key Clients & Strategic Partnerships
- iv. High-level View of Offerings
- v. Juniper Research's View: Key Strengths & Strategic Development Opportunities
- i. Corporate
- 1.2.5. Cisco
- i. Corporate
- Table 1.10: Cisco's Financial Snapshot ($m), 2022-2024
- ii. Geographical Spread
- iii. Key Clients & Strategic Partnerships
- iv. High-level View of Offerings
- v. Juniper Research's View: Key Strengths & Strategic Development Opportunities
- i. Corporate
- 1.2.6. Delta Controls
- i. Corporate
- ii. Geographical Spread
- iii. Key Clients & Strategic Partnerships
- iv. High-level View of Offerings
- v. Juniper Research's View: Key Strengths & Strategic Development Opportunities
- 1.2.7. Hitachi
- i. Corporate
- Table 1.11: Hitachi's Financial Snapshot ($m), 2021-2024
- ii. Geographical Spread
- iii. Key Clients & Strategic Partnerships
- iv. High-level View of Offerings
- v. Juniper Research's View: Key Strengths & Strategic Development Opportunities
- i. Corporate
- 1.2.8. Honeywell
- i. Corporate
- Table 1.12: Honeywell's Financial Snapshot ($m), 2021-2024
- ii. Geographical Spread
- iii. Key Clients & Strategic Partnerships
- iv. High-level View of Offerings
- v. Juniper Research's View: Key Strengths & Strategic Development Opportunities
- i. Corporate
- 1.2.9. Huawei
- i. Corporate
- Table 1.13: Huawei's Financial Summary ($m), 2021-2024
- ii. Geographical Spread
- iii. Key Clients & Strategic Partnerships
- iv. High-level View of Offerings
- v. Juniper Research's View: Key Strengths & Strategic Development Opportunities
- i. Corporate
- 1.2.10. IBM
- i. Corporate
- Table 1.14: IBM's Financial Summary ($m), 2022-2024
- ii. Geographical Spread
- iii. Key Clients & Strategic Partnerships
- iv. High-level View of Offerings
- v. Juniper Research's View: Key Strengths & Strategic Development Opportunities
- i. Corporate
- 1.2.11. Intel
- i. Corporate
- Table 1.15: Intel's Financial Summary ($m), 2022-2024
- ii. Geographical Spread
- iii. Key Clients & Strategic Partnerships
- iv. High-level View of Offerings
- v. Juniper Research's View: Key Strengths & Strategic Development Opportunities
- i. Corporate
- 1.2.12. Johnson Controls
- i. Corporate
- Table 1.16: Johnson Controls' Financial Summary ($m), 2022-2024
- ii. Geographical Spread
- iii. Key Clients & Strategic Partnerships
- iv. High-level View of Offerings
- v. Juniper Research's View: Key Strengths & Strategic Development Opportunities
- i. Corporate
- 1.2.13. Legrand
- i. Corporate
- Table 1.17: Legrand's Financial Summary ($m) 2022-2024
- ii. Geographical Spread
- iii. Key Clients & Strategic Partnerships
- iv. High-level View of Offerings
- v. Juniper Research's View: Key Strengths & Strategic Development Opportunities
- i. Corporate
- 1.2.14. Schneider Electric
- i. Corporate
- Table 1.18: Schneider Electric's Financial Summary, 2022-2024
- ii. Geographical Spread
- iii. Key Clients & Strategic Partnerships
- iv. High-level View of Offerings
- v. Juniper Research's View: Key Strengths & Strategic Development Opportunities
- i. Corporate
- 1.2.15. Siemens
- i. Corporate
- Table 1.19: Siemens' Financial Summary 2022-2024
- ii. Geographical Spread
- iii. Key Clients & Strategic Partnerships
- iv. High-level View of Offerings
- v. Juniper Research's View: Key Strengths & Strategic Development Opportunities
- i. Corporate
- 1.2.16. Telit Cinterion
- i. Corporate
- ii. Geographical Spread
- iii. Key Clients & Strategic Partnerships
- iv. High-level View of Offerings
- v. Juniper Research's View: Key Strengths & Strategic Development Opportunities
- 1.2.17. Verdigris Technologies
- i. Corporate
- ii. Geographical Spread
- iii. Key Clients & Strategic Partnerships
- iv. High-level View of Offerings
- v. Juniper Research's View: Key Strengths & Strategic Development Opportunities
- 1.2.18. Boldyn Networks
- i. Corporate
- ii. Geographical Spread
- iii. Key Clients & Strategic Partnerships
- iv. High-level View of Offerings
- v. Juniper Research's View: Key Strengths & Strategic Development Opportunities
- 1.2.1. ABB
- 1.3. Juniper Research Leaderboard Assessment Methodology
- 1.4. Limitation & Interpretations
- Table 1.20: Juniper Research Competitor Leaderboard Scoring Criteria
- 1.5. Related Research
Data & Forecasting
1. Market Data & Forecasting
- 1.1. Smart Buildings Market Overview
- 1.1.1. Methodology
- Figure 1.1: Smart Buildings Forecast Methodology: Commercial Buildings
- Figure 1.2: Smart Buildings Forecast Methodology: Industrial Buildings
- Figure 1.3: Smart Buildings Forecast Methodology: Residential Buildings
- 1.1.1. Methodology
- 1.2. Smart Building Forecasts
- 1.2.1. Total Number of Smart Buildings
- Figure & Table 1.4: Number of Buildings Deploying Smart Building Technologies (m), Split by 8 Key Regions, 2025-2030
- Table 1.5: Number of Buildings Deploying Smart Features, Split by Segment, 2025-2030
- 1.2.2. Total Smart Buildings Revenue
- Figure & Table 1.6: Smart Buildings Revenue ($m), Split by 8 Key Regions, 2025-2030
- Table 1.7: Smart Buildings Revenue, Split by Segment, 2025-2030
- 1.2.3. Total Commercial Smart Buildings
- Figure & Table 1.8: Number of Commercial Buildings Deploying Smart Building Technologies (m), Split by 8 Key Regions, 2025-2030
- 1.2.4. Total Industrial Smart Buildings
- Figure & Table 1.9: Number of Industrial Buildings Deploying Smart Building Technologies (m), Split by 8 Key Regions, 2025-2030
- 1.2.5. Total Residential Smart Buildings
- Figure & Table 1.10: Number of Industrial Buildings Deploying Smart Building Technologies (m), Split by 8 Key Regions, 2025-2030
- 1.2.1. Total Number of Smart Buildings
 智慧建筑市场:按组件、连接方式、部署模式、建筑类型、应用和最终用户划分-2026-2032年全球市场预测
 2026年全球办公大楼市场报告2026年全球智慧建筑(非住宅建筑)市场报告
 建筑能源模拟软体市场分析与预测(至2035年):类型、产品类型、服务、技术、组件、应用、部署、最终用户、功能、解决方案2026年全球建筑能源模拟软体市场报告2026年智慧建筑与基础设施人工智慧全球市场报告
 2026年智慧建筑领域五大成长机会智慧建筑市场分析及预测(至2035年):依类型、产品类型、服务、技术、组件、应用、设备、部署类型及最终用户划分智慧建筑市场规模、份额、成长及全球产业分析:按类型、应用和地区分類的洞察,2026-2034 年预测
 智慧建筑新创公司(2026):併购与投资 | 贯穿 AEC/O 生命週期的数位孪生与人工智慧新创公司