


 |
市场调查报告书
商品编码
1851822
智慧建筑:市场占有率分析、产业趋势、统计数据和成长预测(2025-2030 年)Smart Building - Market Share Analysis, Industry Trends & Statistics, Growth Forecasts (2025 - 2030) |
||||||
※ 本网页内容可能与最新版本有所差异。详细情况请与我们联繫。
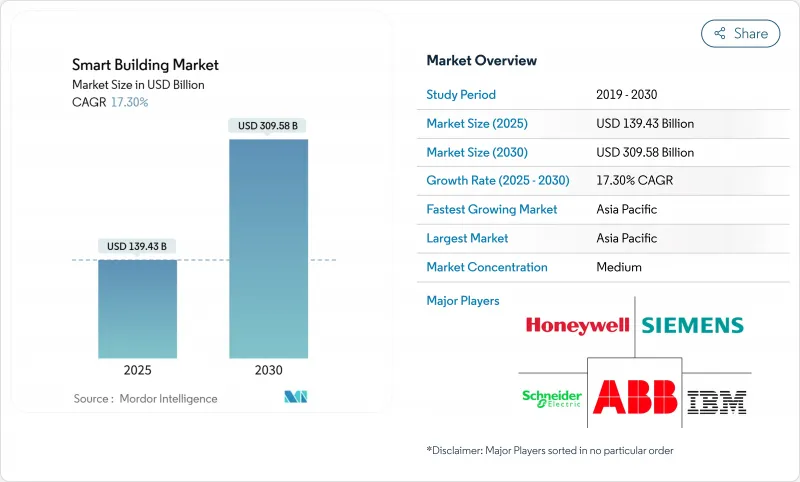
预计到 2025 年,智慧建筑市场规模将达到 1,394.3 亿美元,到 2030 年将达到 3,095.8 亿美元,年复合成长率为 17.30%。
操作技术和资讯科技的日益融合,以及即时分析的运用,正将建筑从被动资产转变为主动能源节点。业主希望将照明、暖通空调、安防和能源管理整合到单一平台上,因此网路安全和开放式架构比专有系统更受青睐。为了使商业房地产组合符合净零排放路径,维修;同时,公用事业公司透过新的收费系统,鼓励建筑采用需量反应。在亚太地区,中国和印度正在大力推动国家智慧城市计划,强制要求建造互联互通的建筑基础设施,从而推动了相关技术的普及。
全球智慧建筑市场趋势与洞察
日益严格的净零碳排放法规推动了全面的建筑维修
净零排放法规要求进行大规模的节能维修,因为建筑排放排放全球排放的40%。针对整个建筑群的强制性要求正促使业主安装高效节能的暖通空调系统、实现暖气电气化,并采用分析技术来检验性能。 ABB 估计,随着脱碳期限的临近,到2050年,维修机会可能达到3.9兆美元。各地对节能定义的差异正在推动地方创新,许多城市的节能标准都超过了国家目标。
物联网感测器的普及将实现即时建筑智慧。
不断扩展的感测器网路使营运商能够精细地了解人员居住情况、设备运作状况和室内空气品质。到2025年,中国将拥有3,100万栋智慧建筑,美国将拥有1,600万栋。江森自控的OpenBlue等平台将原始资料转化为预测性控制,已证实可达到10%至12%的节能效果。随着工业感测器销售额在2025年接近299亿美元,对低功耗无线感测器的需求正在不断增长。
传统电池管理系统通讯协定的碎片化阻碍了系统整合。
老旧的楼宇管理系统采用专有通讯协定,这使得维修变得复杂。 2024 年 MDPI 的评估报告指出,这种分散是最大的障碍,常常迫使业主部署中间件或更换整个子系统。整合延迟会增加计划成本,并可能削弱进阶分析的商业价值。
细分市场分析
到2024年,解决方案将占总收入的68%,这反映出它们在照明控制、安防整合和能源管理方面的核心作用。云端原生楼宇管理系统正在取代本地伺服器,从而减少升级停机时间并实现功能快速部署。服务业务占比虽小,但正以17.68%的复合年增长率成长,因为业主将分析、网路安全监控和生命週期维护等业务外包。这种转变缓解了企业内部技能短缺的问题,同时也为供应商提供了持续的收入来源。
开放API的普及促进了解决方案提供者与专业服务公司之间的伙伴关係。智慧建筑市场正在出现将託管服务协议与基于结果的保证捆绑在一起的现象,供应商承诺达到节能阈值。随着人工智慧模组的集成,对持续调整和模型重新训练的需求将会增加,从而进一步推动服务的成长。
有线乙太网路、BACnet MS/TP 和乙太网路供电 (PoE) 仍连接 55.2% 的智慧型设备,但无线设备的安装正以 18.8% 的复合年增长率成长。无线通讯协定为传统建筑中不便进行钻孔布线的场所提供了灵活的安装方式。 Wi-Fi 6/6E 为视讯分析提供了更高的频宽,而 Zigbee 和 Thread 则适用于低功耗感测器。 DECT NR+ 为密集设备丛集提供Sub-GHz频段覆盖,并且是目前西门子和Schneider Electric认可的标准。
设备密集化正推动设计转向多重通讯协定网路基地台,将蓝牙信标、LoRaWAN 计量器和 5G 闸道连接到统一的主干网路。网路安全加固的网状架构使边缘设备能够自主协商凭证,从而缩短试运行时间。
区域分析
亚太地区将在2024年以31.7%的市占率引领智慧建筑市场,并在2030年之前维持20.4%的最快复合年增长率。中国、韩国和新加坡的国家智慧城市计画正在强制推行互联建筑系统,以提供全市范围的数位双胞胎数据。在印度,甲级商业房地产正在扩展应用智慧照明、空气品质感测器和可再生微电网。
在公用事业需求响应计画和强制性碳倡议揭露的推动下,北美地区也纷纷效法。美国的「更佳建筑倡议」已记录了220亿美元的节能效益,并透过分析证明了维修的经济合理性。加拿大国家建筑规范现已提及与智慧电錶相容的控制系统,鼓励在当地广泛采用。
在欧洲,欧盟分类体系、建筑能源性能指令和翻新浪潮战略都体现了高度的政策一致性。资料主权规则鼓励边缘运算,因此供应商正在提供结合云端仪錶板的现场人工智慧推理引擎。斯堪地那维亚在区域供热整合方面处于领先地位,而德国正在推广智慧电錶网关,以便将安全的载入资料通讯给电网营运商。
其他福利:
- Excel格式的市场预测(ME)表
- 3个月的分析师支持
目录
第一章 引言
- 研究假设和市场定义
- 调查范围
第二章调查方法
第三章执行摘要
第四章 市场情势
- 市场概览
- 市场驱动因素
- 经合组织商业不动产净零碳排放要求日益提高
- 物联网感测器的普及将推动即时分析的发展。
- 融合的OT-IT网路安全框架支援整合平台
- 北美公用事业需量反应奖励加速智慧维修
- 亚洲的城市校园正在迅速采用数位双胞胎来加强其营运。
- 欧盟税收要求促进绿建筑投资
- 市场限制
- 碎片化的传统电池管理系统通讯协定阻碍了现有库存的互通性
- 2024年起半导体密集型设备的资本支出通膨状况
- 资料隐私问题限制了欧洲云端基础的建筑分析应用。
- 新兴市场人工智慧赋能设施管理技能缺口
- 价值链分析
- 监理与技术展望
- 波特五力分析
- 新进入者的威胁
- 买方的议价能力
- 供应商的议价能力
- 替代品的威胁
- 竞争对手之间的竞争
- 投资分析
- 宏观经济因素如何影响市场
第五章 市场规模与成长预测
- 按组件
- 解决方案
- 建筑能源管理系统
- 基础设施管理系统
- 智慧安防系统
- 照明控制系统
- 暖通空调控制系统
- 其他解决方案
- 服务
- 专业服务
- 託管服务
- 解决方案
- 透过连接技术
- 有线
- 无线的
- Wi-Fi
- ZigBee/Z-Wave
- Bluetooth Low Energy
- 6LoWPAN 和其他
- 透过建构生命週期
- 新建设
- 改装
- 依建筑类型
- 住房
- 商业
- 办公室
- 零售
- 饭店业
- 机场和交通枢纽
- 工业与物流
- 设施(医疗保健、教育、政府)
- 按地区
- 北美洲
- 美国
- 加拿大
- 墨西哥
- 南美洲
- 巴西
- 阿根廷
- 其他南美洲国家
- 欧洲
- 德国
- 英国
- 法国
- 义大利
- 西班牙
- 其他欧洲地区
- 中东
- 沙乌地阿拉伯
- 阿拉伯聯合大公国
- 土耳其
- 其他中东地区
- 非洲
- 南非
- 奈及利亚
- 肯亚
- 其他非洲地区
- 亚太地区
- 中国
- 印度
- 日本
- 韩国
- ASEAN
- 亚太其他地区
- 北美洲
第六章 竞争情势
- 市场集中度
- 策略趋势
- 市占率分析
- 公司简介
- Honeywell International Inc.
- Siemens AG
- Schneider Electric SE
- Johnson Controls International plc
- ABB Ltd.
- Cisco Systems Inc.
- IBM Corporation
- Huawei Technologies Co., Ltd.
- Legrand SA
- Emerson Electric Co.
- Delta Electronics, Inc.
- Robert Bosch GmbH
- Hitachi, Ltd.
- United Technologies Corp.(Carrier)
- Trane Technologies plc
- Avnet, Inc.(IoTConnect)
- Softdel(UNIDEL Group)
- Verdigris Technologies, Inc.
- KMC Controls, Inc.
- BuildingIQ, Inc.
第七章 市场机会与未来展望
The smart building market is valued at USD 139.43 billion in 2025 and is forecast to reach USD 309.58 billion by 2030, advancing at a 17.30% CAGR.
Enhanced integration of operational technology and information technology, combined with real-time analytics, is converting buildings from passive assets into active energy nodes. Cyber-secure, open architectures are being selected ahead of proprietary systems as owners seek to unify lighting, HVAC, security, and energy management on a single platform. Retrofit demand is climbing because commercial real-estate portfolios must align with net-zero pathways, while utilities are rewarding buildings that automate demand response with new tariff structures. Asia Pacific leads adoption as China and India scale national smart-city programs that mandate connected building infrastructure.
Global Smart Building Market Trends and Insights
Escalating Net-Zero Carbon Mandates Driving Comprehensive Building Retrofits
Net-zero regulations require deep energy refurbishment because buildings generate 40% of global emissions. Mandates covering whole portfolios are pushing owners to install high-efficiency HVAC, electrify heat, and layer analytics that verify performance. ABB estimates the retrofit opportunity could reach USD 3.9 trillion by 2050 as decarbonization deadlines shorten. Regional differences in definitions are accelerating local innovation, with many city codes surpassing national targets.
IoT Sensor Proliferation Enabling Real-Time Building Intelligence
An expanding sensor base is giving operators granular visibility into occupancy, equipment health, and indoor-air quality. China hosts 31 million smart buildings, while the United States has 16 million as of 2025. Platforms such as Johnson Controls' OpenBlue have documented 10%-12% energy savings by turning raw data into prescriptive controls. Demand for low-power wireless sensors is rising as industrial sensor revenue approaches USD 29.9 billion in 2025.
Legacy BMS Protocol Fragmentation Impeding System Integration
Older Building Management Systems use proprietary protocols that complicate retrofits. A 2024 MDPI review identified this fragmentation as a top barrier, often forcing owners to deploy middleware or replace entire subsystems. Integration delays raise project costs and can erode the business case for advanced analytics.
Other drivers and restraints analyzed in the detailed report include:
- OT-IT Cybersecurity Convergence Enabling Integrated Building Platforms
- Utility Demand-Response Programs Accelerating Smart Building Adoption
- Semiconductor Supply-Chain Volatility Impacting Device Availability
For complete list of drivers and restraints, kindly check the Table Of Contents.
Segment Analysis
Solutions generated 68% of 2024 revenue, reflecting their central role in lighting control, security integration, and energy management. Cloud-native Building Management Systems are replacing on-premise servers, cutting upgrade downtime and enabling faster feature deployment. Services hold a smaller share but are growing at 17.68% CAGR as owners outsource analytics, cybersecurity monitoring, and lifecycle maintenance. This shift is easing internal skill shortages while creating recurring revenue streams for vendors.
Wider availability of open APIs is driving partnerships between solution providers and specialist service firms. The smart building market is seeing managed-service contracts bundled with outcome-based guarantees that commit vendors to energy-saving thresholds. As artificial-intelligence modules become embedded, demand for continuous tuning and model retraining rises, reinforcing service growth.
Wired Ethernet, BACnet MS/TP, and power-over-Ethernet still connect 55.2% of smart devices, but wireless installations are expanding at an 18.8% CAGR. Radio protocols offer install flexibility for heritage buildings where core drilling is impractical. Wi-Fi 6/6E enhances bandwidth for video analytics, while Zigbee and Thread handle low-power sensors. DECT NR+ introduces sub-GHz coverage for dense device clusters, a standard now backed by Siemens and Schneider Electric.
Growing device density is shifting designs toward multi-protocol access points that coordinate Bluetooth beacons, LoRaWAN meters, and 5G gateways on a converged backbone. Cyber-hardened mesh architectures allow edge devices to negotiate credentials autonomously, cutting commissioning time.
The Smart Building Market Report is Segmented by Component (Solutions and Services), Connectivity Technology (Wired and Wireless), Building Lifecycle (New Construction and Retrofit), Building Type (Residential, Commercial, Industrial and Logistics, and More), and Geography
Geography Analysis
Asia Pacific led the smart building market with a 31.7% share in 2024 and will maintain the fastest 20.4% CAGR through 2030. National smart-city programs in China, South Korea, and Singapore mandate connected building systems that feed city-wide digital twins. India's Grade-A commercial real estate expansion is also embedding intelligent lighting, air-quality sensors, and renewable microgrids.
North America follows closely, propelled by utility demand-response programs and mandatory carbon-performance disclosure. The U.S. Better Buildings Initiative has already logged USD 22 billion in savings, validating the financial case for analytics retrofits. Canada's national building code now references smart-meter-compatible controls, nudging regional adoption.
Europe shows strong policy alignment via the EU Taxonomy, Energy Performance of Buildings Directive, and Renovation Wave strategy. Data-sovereignty rules encourage edge computing, so vendors supply on-site AI inference engines coupled with cloud dashboards. Scandinavia is pioneering district heating integration, while Germany expands smart-meter gateways that communicate secure load data to grid operators.
- Honeywell International Inc.
- Siemens AG
- Schneider Electric SE
- Johnson Controls International plc
- ABB Ltd.
- Cisco Systems Inc.
- IBM Corporation
- Huawei Technologies Co., Ltd.
- Legrand SA
- Emerson Electric Co.
- Delta Electronics, Inc.
- Robert Bosch GmbH
- Hitachi, Ltd.
- United Technologies Corp. (Carrier)
- Trane Technologies plc
- Avnet, Inc. (IoTConnect)
- Softdel (UNIDEL Group)
- Verdigris Technologies, Inc.
- KMC Controls, Inc.
- BuildingIQ, Inc.
Additional Benefits:
- The market estimate (ME) sheet in Excel format
- 3 months of analyst support
TABLE OF CONTENTS
1 INTRODUCTION
- 1.1 Study Assumptions and Market Definition
- 1.2 Scope of the Study
2 RESEARCH METHODOLOGY
3 EXECUTIVE SUMMARY
4 MARKET LANDSCAPE
- 4.1 Market Overview
- 4.2 Market Drivers
- 4.2.1 Escalating Net-Zero Carbon Mandates in OECD Commercial Real Estate
- 4.2.2 Proliferation of Building IoT Sensor Deployments Driving Real-time Analytics
- 4.2.3 Convergence of OT-IT Cyber-security Frameworks Enabling Integrated Platforms
- 4.2.4 Utility Demand-Response Incentives Accelerating Smart Retrofits in North America
- 4.2.5 Rapid Urban Campus Digital-Twin Deployments in Asia for Operational Resilience
- 4.2.6 EU Taxonomy Requirements Boosting Green Building Investments
- 4.3 Market Restraints
- 4.3.1 Fragmented Legacy BMS Protocols Hindering Interoperability in Existing Stock
- 4.3.2 Capex Inflation for Semiconductor-Intensive Devices Post-2024 Shortage
- 4.3.3 Data-privacy Concerns Limiting Cloud-based Building Analytics in Europe
- 4.3.4 Skills Gap in AI-enabled Facility Management across Emerging Markets
- 4.4 Value Chain Analysis
- 4.5 Regulatory and Technological Outlook
- 4.6 Porter's Five Forces Analysis
- 4.6.1 Threat of New Entrants
- 4.6.2 Bargaining Power of Buyers
- 4.6.3 Bargaining Power of Suppliers
- 4.6.4 Threat of Substitutes
- 4.6.5 Intensity of Competitive Rivalry
- 4.7 Investment Analysis
- 4.8 Impact of Macroeconomic Factors on the Market
5 MARKET SIZE AND GROWTH FORECASTS (VALUE)
- 5.1 By Component
- 5.1.1 Solutions
- 5.1.1.1 Building Energy Management Systems
- 5.1.1.2 Infrastructure Management Systems
- 5.1.1.3 Intelligent Security Systems
- 5.1.1.4 Lighting Control Systems
- 5.1.1.5 HVAC Control Systems
- 5.1.1.6 Other Solutions
- 5.1.2 Services
- 5.1.2.1 Professional Services
- 5.1.2.2 Managed Services
- 5.1.1 Solutions
- 5.2 By Connectivity Technology
- 5.2.1 Wired
- 5.2.2 Wireless
- 5.2.2.1 Wi-Fi
- 5.2.2.2 ZigBee / Z-Wave
- 5.2.2.3 Bluetooth Low Energy
- 5.2.2.4 6LoWPAN and Others
- 5.3 By Building Lifecycle
- 5.3.1 New Construction
- 5.3.2 Retrofit
- 5.4 By Building Type
- 5.4.1 Residential
- 5.4.2 Commercial
- 5.4.2.1 Office
- 5.4.2.2 Retail
- 5.4.2.3 Hospitality
- 5.4.2.4 Airports and Transportation Hubs
- 5.4.3 Industrial and Logistics
- 5.4.4 Institutional (Healthcare, Education, Government)
- 5.5 By Geography
- 5.5.1 North America
- 5.5.1.1 United States
- 5.5.1.2 Canada
- 5.5.1.3 Mexico
- 5.5.2 South America
- 5.5.2.1 Brazil
- 5.5.2.2 Argentina
- 5.5.2.3 Rest of South America
- 5.5.3 Europe
- 5.5.3.1 Germany
- 5.5.3.2 United Kingdom
- 5.5.3.3 France
- 5.5.3.4 Italy
- 5.5.3.5 Spain
- 5.5.3.6 Rest of Europe
- 5.5.4 Middle East
- 5.5.4.1 Saudi Arabia
- 5.5.4.2 United Arab Emirates
- 5.5.4.3 Turkey
- 5.5.4.4 Rest of Middle East
- 5.5.5 Africa
- 5.5.5.1 South Africa
- 5.5.5.2 Nigeria
- 5.5.5.3 Kenya
- 5.5.5.4 Rest of Africa
- 5.5.6 Asia Pacific
- 5.5.6.1 China
- 5.5.6.2 India
- 5.5.6.3 Japan
- 5.5.6.4 South Korea
- 5.5.6.5 ASEAN
- 5.5.6.6 Rest of Asia Pacific
- 5.5.1 North America
6 COMPETITIVE LANDSCAPE
- 6.1 Market Concentration
- 6.2 Strategic Moves
- 6.3 Market Share Analysis
- 6.4 Company Profiles (includes Global level Overview, Market level overview, Core Segments, Financials as available, Strategic Information, Market Rank/Share for key companies, Products and Services, and Recent Developments)
- 6.4.1 Honeywell International Inc.
- 6.4.2 Siemens AG
- 6.4.3 Schneider Electric SE
- 6.4.4 Johnson Controls International plc
- 6.4.5 ABB Ltd.
- 6.4.6 Cisco Systems Inc.
- 6.4.7 IBM Corporation
- 6.4.8 Huawei Technologies Co., Ltd.
- 6.4.9 Legrand SA
- 6.4.10 Emerson Electric Co.
- 6.4.11 Delta Electronics, Inc.
- 6.4.12 Robert Bosch GmbH
- 6.4.13 Hitachi, Ltd.
- 6.4.14 United Technologies Corp. (Carrier)
- 6.4.15 Trane Technologies plc
- 6.4.16 Avnet, Inc. (IoTConnect)
- 6.4.17 Softdel (UNIDEL Group)
- 6.4.18 Verdigris Technologies, Inc.
- 6.4.19 KMC Controls, Inc.
- 6.4.20 BuildingIQ, Inc.
7 MARKET OPPORTUNITIES AND FUTURE OUTLOOK
- 7.1 White-space and Unmet-need Assessment
 2026年智慧建筑领域五大成长机会
 智慧建筑市场分析及预测(至2035年):依类型、产品类型、服务、技术、组件、应用、设备、部署类型及最终用户划分
 智慧建筑新创公司(2026):併购与投资 | 贯穿 AEC/O 生命週期的数位孪生与人工智慧新创公司
 智慧建筑
智慧建筑 智慧建筑市场规模、份额和趋势分析报告:按组件、解决方案、服务、最终用途、地区和细分市场预测(2026-2033 年)
 智慧建筑市场规模、份额和成长分析(按组件、建筑类型、解决方案和地区划分)-2026-2033年产业预测
 智慧建筑市场:按组件、连接性、部署、建筑类型、应用和最终用户划分-2025-2032 年全球预测智慧建筑的全球市场 (~2035年):解决方案类型·技术·用途·建筑物类型·功能类型·各地区
 2025-2029年全球智慧建筑与基础设施人工智慧市场
 智慧建筑市场:2025-2030年