


 |
市场调查报告书
商品编码
1808086
全球膳食补充剂测试市场按测试类型、目标产品、技术、最终用户、服务供应商和地区划分 - 预测至 2030 年Dietary Supplements Testing Market by Test Type, Product Tested, Technology, End-use, Service Provider, and Region - Global Forecast to 2030 |
||||||
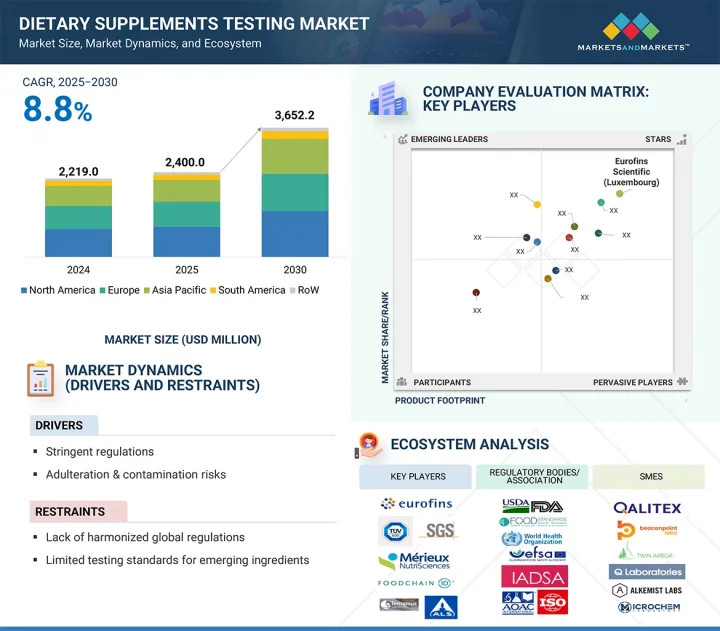
预计到 2025 年膳食补充剂测试市场价值将达到 24 亿美元,到 2030 年预计将达到 36.522 亿美元,复合年增长率为 8.8%。
| 调查范围 | |
|---|---|
| 调查年份 | 2021-2030 |
| 基准年 | 2024 |
| 预测期 | 2025-2030 |
| 单位数量 | 金额(百万美元)及数量(单位) |
| 按细分市场 | 按测试类型、测试目标产品、技术、最终用户、服务供应商和地区 |
| 目标区域 | 北美、欧洲、亚太地区、南美洲、世界其他地区 (RoW) |
由于慢性病的流行导致膳食补充剂产品的使用量不断增加,检测服务技术的进步以及检测和合规性监管要求的不断提高,膳食补充剂检测市场正经历着巨大的发展。此外,对成分可追溯性和供应链透明度的关注,以及对洁净标示、纯素和无过敏原产品日益增长的需求,预计将推动膳食补充剂检测的需求。随着全球对膳食补充剂的需求持续增长,对强大可靠的检测服务的需求仍然是确保产品安全、消费者信任和监管完整性的核心,这使得该行业成为现代健康和营养生态系统的关键。
此外,国际贸易日益受到技术性贸易壁垒 (TBT) 和非关税措施的控制,这些措施要求产品进行检测、认证和记录,以确保安全和品质。为了因应这种监管环境,出口商通常需要遵守全球公认的标准,例如粮农组织/世卫组织制定的《食品转码器》,该法典旨在协调各国的食品安全和品质要求。因此,对能够进行成分鑑定、微生物分析、重金属检测和稳定性测试等验证性测试的认证实验室的需求显着增加。然而,先进测试方法的高成本以及新兴成分的有限测试标准预计将为膳食补充剂测试市场带来挑战。
膳食补充剂检测服务市场正处于一个重要的转折点,正在重新定义实验室、製造商和相关人员的经营方式。其中最显着的颠覆性变化之一是新一代分析技术的快速普及,例如高解析度质谱 (HRMS)、用于植物鑑定的次世代定序(NGS)、基于人工智慧的污染物检测以及基于区块链的追溯系统。这些技术使检测速度更快、更准确,涵盖更多分析物,同时降低成本。这些仪器正在取代传统的单一参数检测方法,迫使小型实验室对其检测能力和服务进行现代化升级。此外,亚马逊、CVS 和沃尔玛等零售商日益严格的全球合规要求和检测规定,如今要求在其平台上销售的补充剂必须进行独立的第三方检测,这使得外包检测本质上成为一项商业性要求,而非一项可选的品质衡量标准。此外,全球供应链的多元化、跨境监管要求以及日益严格的掺假指标,正在进一步改变全球膳食补充剂检测行业。
由于安全问题日益严重、良好生产规范 (GMP) 监管限制日益严格,以及植物性食品、益生菌和低度加工补充剂产品存在较高的污染风险,膳食补充剂检测市场中的微生物检测部分预计将大幅增长。沙门氏菌、大肠桿菌和李斯特菌等病原体可能导致产品召回并损害品牌声誉,因此需要定期检测原料和成品。益生菌补充剂的成长也受到製造商识别菌株和确认不含致病微生物的需求的推动。定量聚合酵素链锁反应(qPCR) 和三Adenosine腺苷 (ATP) 生物发光等快速检测方法可实现更快、更准确的检测,进一步推动微生物检测市场的成长。
据估计,维生素和矿物质细分市场在膳食补充剂检测市场中占据重要份额,这得益于其广泛的消费者群体、高产量以及严格的监管要求,以确保准确的效力、纯度和污染分析。准确的定量和稳定性测量是补充品产品的关键要求,因为维生素D、铁和钙等营养素的过量或不足都会带来潜在的健康风险。一般保健品和个人化补充剂正在推动市场成长,这增加了包括生物有效性和相互作用研究在内的检测需求,而软糖和液体等各种给药形式需要灵活的检测程序,这使得该细分市场成为检测服务需求的稳定驱动力。
美国是最大的膳食补充剂检测市场之一。由于美国消费者偏好和偏好的变化、食源性疾病的爆发、新型安全检测技术的创新以及新风险的发现,美国市场正在经历显着增长。美国实施了各种法规,以认证和确保膳食补充剂的品质和安全,免受生物和化学威胁。这些法规的实施旨在维护和监督国内外检测实验室网路的互联互通。这些实验室透过专门的有害物质检测实验室进行可靠的检测。美国政府为维护膳食补充剂的安全和品质而实施的这些严格法规,导致过去几年对膳食补充剂安全检测的需求不断增加。
本报告研究了全球膳食补充剂测试市场,并按测试类型、目标产品、技术、最终用户、服务供应商、区域趋势和参与市场的公司概况进行细分。
目录
第一章 引言
第二章调查方法
第三章执行摘要
第四章重要考察
第五章市场概述
- 介绍
- 总体经济指标
- 市场动态
- 生成式人工智慧对食品和健康营养产品检测产业的影响
第六章 产业趋势
- 介绍
- 2025年美国关税的影响 - 膳食补充剂食品检测市场
- 价值链分析
- 贸易分析
- 技术分析
- 定价分析
- 生态系分析
- 影响客户业务的趋势/中断
- 专利分析
- 2025-2026年主要会议和活动
- 监管状况
- 波特五力分析
- 主要相关人员和采购标准
- 案例研究分析
- 投资金筹措场景
7. 膳食补充剂检测市场(依检测类型)
- 介绍
- 识别/认证
- 效力
- 污染物
- 微生物
- 伪造
- 稳定性和保质期
- 过敏原和基因改造
- 标籤声明检验
- 功能展示
- 其他的
第八章膳食补充剂测试市场(按测试目标产品)
- 介绍
- 成分水平测试
- 成品测试
9. 膳食补充剂测试市场(依技术)
- 介绍
- 传统的
- 快速检测
第 10 章膳食补充品测试市场(以最终用户划分)
- 介绍
- 营养补充品公司
- 契约製造
- 分销商/零售商(线上和线下)
- 监管机构
第 11 章膳食补充剂测试市场(按服务供应商划分)
- 介绍
- 独立第三方检测实验室
- CRO
- 其他的
第 12 章。膳食补充剂测试市场(按地区)
- 介绍
- 北美洲
- 美国
- 加拿大
- 墨西哥
- 欧洲
- 德国
- 英国
- 法国
- 义大利
- 西班牙
- 其他的
- 亚太地区
- 中国
- 日本
- 印度
- 澳洲和纽西兰
- 越南
- 其他的
- 南美洲
- 巴西
- 阿根廷
- 其他的
- 其他地区
- 非洲
- 中东
第十三章竞争格局
- 概述
- 主要参与企业的策略/优势,2021 年 8 月至 2025 年
- 2022-2024年收益分析
- 2024年市场占有率分析
- 估值和财务指标
- 品牌/产品比较
- 公司估值矩阵:2024 年关键参与企业
- 公司估值矩阵:Start-Ups/中小企业,2024 年
- 竞争场景
第十四章:公司简介
- 主要参与企业
- EUROFINS SCIENTIFIC
- SGS SA
- MERIEUX NUTRISCIENCES
- INTERTEK GROUP PLC(UK)
- UL SOLUTIONS
- ALS
- TUV SUD
- TENTAMUS
- AGROLAB GROUP
- FOODCHAIN ID
- ELEMENT MATERIALS TECHNOLOGY
- LGC LIMITED
- CERTIFIED LABORATORIES
- VIMTA LABS LTD.
- QALITEX
- 其他公司
- ANRESCO LABORATORIES
- BEACONPOINT LABS
- TWIN ARBOR LABS
- ALKEMIST
- AURIGA RESEARCH PRIVATE LIMITED
- ACCURATE LABS
- MICROCHEM LABORATORY
- MS BIOANALYTICAL LLC
- AEMTEK
- MICROBAC LABORATORIES
第十五章:邻近市场与相关市场
第十六章 附录
The dietary supplements testing market is estimated at USD 2,400.0 million in 2025 and is projected to reach USD 3,652.2 million by 2030, at a CAGR of 8.8%.
| Scope of the Report | |
|---|---|
| Years Considered for the Study | 2021-2030 |
| Base Year | 2024 |
| Forecast Period | 2025-2030 |
| Units Considered | Value (USD Million) and Volume (Units) |
| Segments | By Test type, product tested, technology, end-use, service provider, and region |
| Regions covered | North America, Europe, Asia Pacific, South America, and Rest of the World (RoW) |
The dietary supplements testing market is gaining significant traction, driven by increasing usage of dietary supplement products due to rising chronic disease prevalence, technological advancements in testing services, and increasing regulatory requirements for testing & compliance. Furthermore, the focus on ingredient traceability and supply chain transparency, as well as the rising demand for clean labels, vegan, and allergen-free products, is expected to enhance the demand for more testing of dietary supplement products. As the global appetite for dietary supplements continues to grow, the demand for robust and reliable testing services will remain at the core of ensuring product safety, consumer confidence, and regulatory alignment, making this field a cornerstone of the modern health and nutrition ecosystem.
Furthermore, international trade is increasingly governed by technical barriers to trade (TBTs), as well as non-tariff measures that require product testing, certification, and documentation to ensure safety and quality. To navigate these regulatory landscapes, exporters must often align with globally recognized standards like the Codex Alimentarius, developed by FAO/WHO, which harmonizes food safety and quality requirements across countries (Codex Alimentarius). As a result, the demand for accredited laboratories capable of conducting validated tests, such as ingredient identification, microbial analysis, heavy metal detection, and stability testing, has significantly increased. However, the high cost of advanced testing methods and limited testing standards for emerging ingredients are expected to pose a challenge in the dietary supplements testing market.
"Disruptions in the dietary supplements testing market may offer opportunities for players."
The market for dietary supplement testing services is witnessing major disruptions that are redefining the way laboratories, manufacturers, and regulatory players do business. One of the biggest disruptions is the rapid adoption of next-generation analytical technologies such as high-resolution mass spectrometry (HRMS), next-generation sequencing (NGS) for botanical authentication, contaminant detection through AI, and blockchain-based traceability systems, which are making testing faster, more accurate, and multi-analyte with lower costs. These instruments are replacing old, single-parameter testing methods and are putting pressure on smaller labs to modernize their capabilities and offerings. Additionally, the increasing global compliance requirements and test mandates from retailers, such as Amazon, CVS, and Walmart, now demand independent, third-party testing for supplements that get sold on their platforms, making outsourced testing essentially a commercial requirement rather than an optional quality measure. Furthermore, diversification in the global supply chain, regulatory requirements across multiple countries, and rising indices of adulteration are further transforming the global dietary supplements testing industry.
"The microbiological testing segment is projected to grow at a high rate."
The microbial testing segment in the dietary supplements testing market is projected to grow at a significant rate, owing to increasing safety issues, increased Good Manufacturing Practices (GMP) regulatory limits, and the high risk of contamination in botanicals, probiotics, and minimally processed supplement products. Pathogens such as Salmonella, E. coli, and Listeria may cause recalls and brand reputation loss, so there is a requirement for routine testing of raw materials and finished goods. The growth in probiotic supplements contributes as well, since manufacturers need to confirm strain identification and the lack of pathogenic microbes. Furthermore, international ingredient sourcing and different hygiene standards contribute to the demand, while quicker methods like quantitative polymerase chain reaction (qPCR) and adenosine triphosphate (ATP) bioluminescence allow for quicker, more precise detection, making microbial testing a driver for the market growth.
"The vitamins & minerals segment is expected to hold a significant market share."
The vitamins & minerals segment is estimated to account for a significant share of the dietary supplements testing market because it has a wide base of consumers, high levels of production, and stringent regulatory demands for ensuring the right potency, purity, and contamination analysis. Since over- or under-dosing nutrients such as vitamin D, iron, or calcium poses potential health risks, accurate quantitation and stability measurement are key requirements in the supplement products. General health supplements and personalized supplements have driven growth, increasing testing requirements to involve bioavailability and interaction studies, while various delivery formats such as gummies and liquids require flexible testing procedures, making this segment a steady driver of testing service demand.
"The US is projected to dominate the North American dietary supplements testing market during the forecast period."
The US is one of the largest markets for dietary supplements testing. The US market has been witnessing significant growth due to changing tastes and preferences of US consumers, outbreaks of foodborne illnesses, innovations in new safety testing technologies, and the identification of new risks. The US has been imposing different regulations to certify and ensure the quality and safety of supplements from biological and chemical threats. These regulations are enforced to maintain and supervise the correlation between national and international laboratories' networks. These laboratories have been carrying out definitive testing via dedicated laboratories to test for hazardous agents. This stringent enforcement of regulations by the US government in order to maintain the safety and quality of dietary supplements has led to an increased demand for dietary supplements safety testing over the past few years.
In-depth interviews have been conducted with chief executive officers (CEOs), directors, and other executives from various key organizations operating in the dietary supplements testing market.
- By Company Type: Tier 1-25%, Tier 2-40%, and Tier 3-35%
- By Designation: CXOs-20%, Managers-50%, Executives-30%
- By Region: North America-28%, Europe-22%, Asia Pacific-33%, South America-10%, and Rest of the World-7%
Prominent companies in the market include Eurofins Scientific (Luxembourg), SGS Societe Generale de Surveillance SA. (Switzerland), Intertek Group plc (UK), Merieux NutriSciences (US), UL Solutions (US), TUV SUD (Germany), ALS (Australia), Tentamus (Italy), Agrolab Group (Germany), FoodChain ID (US), Certified Laboratories (US), Element Materials Technology (UK), NSF (US), Vimta Labs Ltd (India), Qalitex (US), Alkemist (US), Anresco Laboratories (US), Beaconpoint Labs (US), Twin Arbor Labs (US), Q Laboratories (US), Microchem Laboratory (US), Accurate Labs (India), AEMTEK (US), and MS Bioanalytical LLC (US), among others.
Research Coverage
This research report categorizes the dietary supplements testing market by test type (identity/authentication, potency testing, contaminants testing, microbiological testing, adulteration testing, stability & shelf life, allergen & GMO testing, label claim verification, functional claims testing, and other testing types), product tested (ingredient level testing [botanicals, phytochemicals, vitamins & minerals, amino acids & proteins, specialty supplements, and other ingredients] and finished product testing), technology (traditional and rapid), end-use (qualitative) (nutraceutical companies, contract manufacturers, distributors/ retailers (online & offline), and regulatory authorities), service provider (qualitative) (independent third-party testing laboratories, contract research organizations (CROS), and other service providers), and region (North America, Europe, Asia Pacific, South America, and Rest of the World).
The scope of the report covers detailed information regarding the major factors, such as drivers, restraints, challenges, and opportunities, influencing the growth of the dietary supplements testing market. A thorough analysis of the key industry players has been done to provide insights into their business, services, key strategies, contracts, partnerships, agreements, service launches, mergers & acquisitions, and recent developments associated with the dietary supplements testing market. This report covers the competitive analysis of upcoming startups in the dietary supplements testing market ecosystem. Furthermore, industry-specific trends such as technology analysis, ecosystem & market mapping, and patent & regulatory landscape, among others, are also covered in the study.
Reasons to Buy This Report
The report will offer market leaders/new entrants information on the closest approximations of the revenue numbers for the overall dietary supplements testing and subsegments. It will also help stakeholders understand the competitive landscape and gain more insights to better position their businesses and plan suitable go-to-market strategies. The report also helps stakeholders understand the pulse of the market and provides them with information on key market drivers, restraints, challenges, and opportunities.
The report provides insights on the following pointers:
- Analysis of key drivers (adulteration & contamination risks: elevating the demand for supplement testing), restraints (limited testing standards for emerging ingredients), opportunities (rising demand for clean labels, vegan, and allergen-free products), and challenges (complexity of multi-ingredient formulations), influencing the growth of the dietary supplements testing market.
- Service Development/Innovation: Detailed insights on research & development activities and new service launches in the dietary supplements testing market.
- Market Development: Comprehensive information about lucrative markets-the report analyzes dietary supplements testing across varied regions.
- Market Diversification: Exhaustive information about new testing technologies, untapped geographies, recent developments, and investments in the dietary supplements testing market.
- Competitive Assessment: In-depth assessment of market shares, growth strategies, product offerings, service comparison, and service foot prints of leading players such as Eurofins Scientific (Luxembourg), SGS Societe Generale de Surveillance SA. (Switzerland), Intertek Group plc (UK), Merieux NutriSciences (US), UL Solutions (US), TUV SUD (Germany), Tentamus (Italy), AGROLAB GROUP (Germany), FoodChain ID (US), Certified Laboratories (US), Element Materials Technology (UK), NSF (US), Vimta Labs Ltd (India), Qalitex (US), Alkemist (US), Anresco Laboratories (US), Beaconpoint Labs (US), Twin Arbor Labs (US), Q Laboratories (US), Microchem Laboratory (US), Accurate Labs (India), and other players in the dietary supplements testing market.
TABLE OF CONTENTS
1 INTRODUCTION
- 1.1 STUDY OBJECTIVES
- 1.2 MARKET DEFINITION
- 1.3 STUDY SCOPE
- 1.3.1 MARKETS COVERED AND REGIONS CONSIDERED
- 1.3.2 INCLUSIONS AND EXCLUSIONS
- 1.3.3 YEARS CONSIDERED
- 1.3.4 CURRENCY CONSIDERED
- 1.3.5 UNITS CONSIDERED
- 1.4 STAKEHOLDERS
2 RESEARCH METHODOLOGY
- 2.1 RESEARCH DATA
- 2.1.1 SECONDARY DATA
- 2.1.1.1 Key data from secondary sources
- 2.1.2 PRIMARY DATA
- 2.1.2.1 Key data from primary sources
- 2.1.2.2 Breakdown of primary profiles
- 2.1.2.3 Key insights from industry experts
- 2.1.1 SECONDARY DATA
- 2.2 MARKET SIZE ESTIMATION
- 2.2.1 TOP-DOWN APPROACH
- 2.2.2 SUPPLY-SIDE ANALYSIS
- 2.2.3 BOTTOM-UP APPROACH (DEMAND SIDE)
- 2.3 DATA TRIANGULATION AND MARKET BREAKUP
- 2.4 RESEARCH ASSUMPTIONS
- 2.5 RESEARCH LIMITATIONS AND RISK ASSESSMENT
3 EXECUTIVE SUMMARY
4 PREMIUM INSIGHTS
- 4.1 ATTRACTIVE OPPORTUNITIES FOR PLAYERS IN DIETARY SUPPLEMENTS TESTING MARKET
- 4.2 NORTH AMERICA: DIETARY SUPPLEMENTS TESTING MARKET, BY TECHNOLOGY AND COUNTRY
- 4.3 DIETARY SUPPLEMENTS TESTING MARKET, BY TEST TYPE
- 4.4 DIETARY SUPPLEMENTS TESTING MARKET, BY PRODUCT TESTED
- 4.5 DIETARY SUPPLEMENTS TESTING MARKET, BY TECHNOLOGY AND REGION
- 4.6 DIETARY SUPPLEMENTS TESTING MARKET: REGIONAL SNAPSHOT
5 MARKET OVERVIEW
- 5.1 INTRODUCTION
- 5.2 MACROECONOMIC INDICATORS
- 5.2.1 CHANGING LIFESTYLE AND NUTRITIONAL GAPS DRIVING SUPPLEMENT DEMAND
- 5.2.2 CHRONIC ILLNESS DRIVES GLOBAL SHIFT TOWARD SUPPLEMENT CONSUMPTION, FUELING DEMAND FOR TESTING SERVICES
- 5.2.3 GLOBAL TRADE AND SUPPLEMENT EXPORTS
- 5.3 MARKET DYNAMICS
- 5.3.1 DRIVERS
- 5.3.1.1 Increasing micronutrient deficiency prevalence
- 5.3.1.2 Stringent regulations
- 5.3.1.3 Adulteration & contamination risks
- 5.3.1.4 Focus on ingredient traceability and supply chain transparency
- 5.3.2 RESTRAINTS
- 5.3.2.1 High cost of advanced testing methods
- 5.3.2.2 Lack of harmonized global regulations
- 5.3.2.3 Limited testing standards for emerging ingredients
- 5.3.3 OPPORTUNITIES
- 5.3.3.1 Personalized nutrition trends
- 5.3.3.2 Rising demand for clean-label, vegan, and allergen-free products
- 5.3.3.3 Technological advancements in testing
- 5.3.4 CHALLENGES
- 5.3.4.1 Complexity of multi-ingredient formulations
- 5.3.4.2 Global supply chain risks and sample variability
- 5.3.4.3 Talent and equipment gap in emerging markets
- 5.3.1 DRIVERS
- 5.4 IMPACT OF GEN AI ON FOOD AND HEALTH NUTRITIONAL PRODUCTS TESTING INDUSTRY
- 5.4.1 USE OF GEN AI IN FOOD AND HEALTH NUTRITIONAL PRODUCTS TESTING INDUSTRY
- 5.4.2 CASE STUDIES FOR GENERATIVE AI IN DIETARY SUPPLEMENTS SERVICES
- 5.4.2.1 Canomiks' genomic platform for validating botanical ingredients
- 5.4.2.2 SGS Digicomply advantage: AI-driven regulatory compliance
- 5.4.3 IMPACT OF GENERATIVE AI/AI ON DIETARY SUPPLEMENT TESTING SERVICES
- 5.4.4 ADJACENT ECOSYSTEM WORKING ON GENERATIVE AI
6 INDUSTRY TRENDS
- 6.1 INTRODUCTION
- 6.2 IMPACT OF 2025 US TARIFF - DIETARY SUPPLEMENTS TESTING MARKET
- 6.2.1 INTRODUCTION
- 6.2.2 KEY TARIFF RATES
- 6.2.3 DISRUPTION IN FOOD SAFETY TESTING INDUSTRY
- 6.2.4 PRICE IMPACT ANALYSIS
- 6.2.5 IMPACT ON COUNTRY/REGION
- 6.2.5.1 US
- 6.2.5.2 Europe
- 6.2.5.3 China
- 6.2.6 IMPACT ON END-USE INDUSTRIES
- 6.3 VALUE CHAIN ANALYSIS
- 6.3.1 RESEARCH & DEVELOPMENT
- 6.3.2 SOURCING
- 6.3.3 DATA ANALYSIS & INTERPRETATION
- 6.3.4 CONSULTATION & ADVISORY SERVICE
- 6.3.5 COLLABORATION & NETWORKING
- 6.3.6 END USERS
- 6.4 TRADE ANALYSIS
- 6.4.1 IMPORT SCENARIO OF HS CODE 3822
- 6.4.2 EXPORT SCENARIO OF HS CODE 3822
- 6.5 TECHNOLOGY ANALYSIS
- 6.5.1 KEY TECHNOLOGIES
- 6.5.1.1 Chromatographic techniques
- 6.5.1.2 Spectroscopy
- 6.5.1.3 Microbiological testing
- 6.5.1.4 Molecular testing
- 6.5.2 COMPLEMENTARY TECHNOLOGIES
- 6.5.2.1 IoT for analytics
- 6.5.2.2 AI and machine learning
- 6.5.2.3 Regulatory compliance software
- 6.5.3 ADJACENT TECHNOLOGIES
- 6.5.3.1 Sample preparation techniques
- 6.5.3.2 Laboratory information management systems (LIMS) and automation
- 6.5.1 KEY TECHNOLOGIES
- 6.6 PRICING ANALYSIS
- 6.6.1 AVERAGE SELLING PRICE, BY KEY PLAYER
- 6.6.2 AVERAGE SELLING PRICE TREND, BY REGION
- 6.7 ECOSYSTEM ANALYSIS
- 6.7.1 DEMAND SIDE
- 6.7.2 SUPPLY SIDE
- 6.8 TRENDS/DISRUPTIONS IMPACTING CUSTOMER BUSINESS
- 6.9 PATENT ANALYSIS
- 6.10 KEY CONFERENCES AND EVENTS, 2025-2026
- 6.11 REGULATORY LANDSCAPE
- 6.11.1 REGULATORY BODIES, GOVERNMENT AGENCIES, AND OTHER ORGANIZATIONS
- 6.11.2 REGULATORY FRAMEWORK
- 6.11.2.1 North America
- 6.11.2.2 Europe
- 6.11.2.3 Asia Pacific
- 6.12 PORTER'S FIVE FORCES ANALYSIS
- 6.12.1 THREAT OF NEW ENTRANTS
- 6.12.2 THREAT OF SUBSTITUTES
- 6.12.3 BARGAINING POWER OF SUPPLIERS
- 6.12.4 BARGAINING POWER OF BUYERS
- 6.12.5 INTENSITY OF COMPETITIVE RIVALRY
- 6.13 KEY STAKEHOLDERS AND BUYING CRITERIA
- 6.13.1 KEY STAKEHOLDERS IN BUYING PROCESS
- 6.13.2 BUYING CRITERIA
- 6.14 CASE STUDY ANALYSIS
- 6.14.1 SGS-NUTRASOURCE ACQUISITION: DRIVING INTEGRATED CLINICAL, REGULATORY, AND TESTING SOLUTIONS WORLDWIDE
- 6.14.2 MERIEUX NUTRISCIENCES' ENTRY INTO ECUADOR THROUGH BUREAU VERITAS
- 6.15 INVESTMENT AND FUNDING SCENARIO
7 DIETARY SUPPLEMENTS TESTING MARKET, BY TEST TYPE
- 7.1 INTRODUCTION
- 7.2 IDENTITY/AUTHENTICATION
- 7.2.1 ENSURING AUTHENTICITY AND COMPLIANCE IN DIETARY SUPPLEMENTS
- 7.3 POTENCY
- 7.3.1 VERIFYING STRENGTH AND SUPPORTING KEY SPECIFICATIONS OF PRODUCTS
- 7.4 CONTAMINANTS
- 7.4.1 PROTECTING SUPPLEMENTS FROM HIDDEN CONTAMINANTS
- 7.5 MICROBIOLOGICAL
- 7.5.1 SAFEGUARDING DIETARY SUPPLEMENTS FROM PATHOGENS
- 7.6 ADULTERATION
- 7.6.1 FINDING UNDECLARED SUBSTANCES AND FRAUDULENT ADDITIONS
- 7.7 STABILITY & SHELF LIFE
- 7.7.1 ENSURING QUALITY AND EFFICACY OVER TIME
- 7.8 ALLERGEN & GMO
- 7.8.1 PROTECTING CONSUMERS THROUGH ALLERGEN AND GMO VERIFICATION
- 7.9 LABEL CLAIM VERIFICATION
- 7.9.1 ENSURING ACCURACY AND REGULATORY COMPLIANCE
- 7.10 FUNCTIONAL CLAIMS
- 7.10.1 VALIDATING HEALTH BENEFITS IN DIETARY SUPPLEMENTS
- 7.11 OTHER TEST TYPES
8 DIETARY SUPPLEMENTS TESTING MARKET, BY PRODUCT TESTED
- 8.1 INTRODUCTION
- 8.2 INGREDIENT-LEVEL TESTING
- 8.2.1 DEMAND FOR RAW MATERIAL QUALITY ASSURANCE AND REGULATORY COMPLIANCE FOR INGREDIENTS TO DRIVE DEMAND
- 8.2.1.1 Botanicals
- 8.2.1.2 Herbs & spices
- 8.2.1.3 Fruits
- 8.2.1.4 Flowers
- 8.2.1.5 Leaves
- 8.2.1.6 Roots & other parts
- 8.2.2 PHYTOCHEMICALS
- 8.2.2.1 Alkaloids
- 8.2.2.2 Flavonoids
- 8.2.2.3 Terpenoids
- 8.2.2.4 Saponins
- 8.2.2.5 Glycosides
- 8.2.2.6 Tannins
- 8.2.2.7 Steroids
- 8.2.2.8 Phenols
- 8.2.3 VITAMINS & MINERALS
- 8.2.4 AMINO ACIDS & PROTEINS
- 8.2.5 SPECIALTY SUPPLEMENTS
- 8.2.6 OTHER INGREDIENTS
- 8.2.1 DEMAND FOR RAW MATERIAL QUALITY ASSURANCE AND REGULATORY COMPLIANCE FOR INGREDIENTS TO DRIVE DEMAND
- 8.3 FINISHED PRODUCT TESTING
- 8.3.1 THERAPEUTIC POTENTIAL TO DRIVE DEMAND FOR POSTBIOTICS IN PHARMACEUTICALS
9 DIETARY SUPPLEMENTS TESTING MARKET, BY TECHNOLOGY
- 9.1 INTRODUCTION
- 9.2 TRADITIONAL
- 9.2.1 ACCURACY AND RELIABILITY: ESTABLISHED TRADITIONAL TESTING METHODS
- 9.3 RAPID
- 9.3.1 SPEED AND EFFICIENCY: MODERN RAPID TESTING APPROACHES
10 DIETARY SUPPLEMENTS TESTING MARKET, BY END USER
- 10.1 INTRODUCTION
- 10.2 NUTRACEUTICAL COMPANIES
- 10.3 CONTRACT MANUFACTURERS
- 10.4 DISTRIBUTORS/RETAILERS (ONLINE & OFFLINE)
- 10.5 REGULATORY AUTHORITIES
11 DIETARY SUPPLEMENTS TESTING MARKET, BY SERVICE PROVIDER
- 11.1 INTRODUCTION
- 11.2 INDEPENDENT THIRD-PARTY TESTING LABORATORIES
- 11.3 CONTRACT RESEARCH ORGANIZATIONS (CROS)
- 11.4 OTHER SERVICE PROVIDERS
12 DIETARY SUPPLEMENTS TESTING MARKET, BY REGION
- 12.1 INTRODUCTION
- 12.2 NORTH AMERICA
- 12.2.1 US
- 12.2.1.1 High supplement use and stringent regulations to drive market
- 12.2.2 CANADA
- 12.2.2.1 High consumer reliance on supplements and stringent pre-market approval processes to drive market
- 12.2.3 MEXICO
- 12.2.3.1 Rising health consciousness and preventative focus to drive market
- 12.2.1 US
- 12.3 EUROPE
- 12.3.1 GERMANY
- 12.3.1.1 Sustainable food consumption and focus on verified supplements to drive market
- 12.3.2 UK
- 12.3.2.1 Focus on plant-based diets and sustainable and verified nutrition to drive market
- 12.3.3 FRANCE
- 12.3.3.1 Focus on reliable testing and safety of dietary supplements to drive market
- 12.3.4 ITALY
- 12.3.4.1 Need to ensure quality and confidence in dietary supplements to drive market
- 12.3.5 SPAIN
- 12.3.5.1 Focus on empowering health with safe and verified supplements to drive market
- 12.3.6 REST OF EUROPE
- 12.3.1 GERMANY
- 12.4 ASIA PACIFIC
- 12.4.1 CHINA
- 12.4.1.1 Focus on safe, high-quality supplements to drive market
- 12.4.2 JAPAN
- 12.4.2.1 Expanding laboratory networks to strengthen supplement testing to drive market
- 12.4.3 INDIA
- 12.4.3.1 Need to strengthen trust and secure wellness in dietary supplements to drive market
- 12.4.4 AUSTRALIA & NEW ZEALAND
- 12.4.4.1 Focus on strengthening testing capacity to uphold supplement quality to drive market
- 12.4.5 VIETNAM
- 12.4.5.1 Rising health awareness and counterfeit risks to drive market
- 12.4.6 REST OF ASIA PACIFIC
- 12.4.1 CHINA
- 12.5 SOUTH AMERICA
- 12.5.1 BRAZIL
- 12.5.1.1 Need to ensure quality in booming supplement testing segment to drive market
- 12.5.2 ARGENTINA
- 12.5.2.1 Demand for safeguarding health through reliable supplement testing to drive market
- 12.5.3 REST OF SOUTH AMERICA
- 12.5.1 BRAZIL
- 12.6 REST OF THE WORLD
- 12.6.1 AFRICA
- 12.6.1.1 Focus on nutrition through verified supplements to drive market
- 12.6.2 MIDDLE EAST
- 12.6.2.1 Need to address health challenges through trusted supplement testing to drive market
- 12.6.1 AFRICA
13 COMPETITIVE LANDSCAPE
- 13.1 OVERVIEW
- 13.2 KEY PLAYER STRATEGIES/RIGHT TO WIN, 2021-AUGUST 2025
- 13.3 REVENUE ANALYSIS, 2022-2024
- 13.4 MARKET SHARE ANALYSIS, 2024
- 13.5 COMPANY VALUATION AND FINANCIAL METRICS
- 13.6 BRAND/PRODUCT COMPARISON
- 13.7 COMPANY EVALUATION MATRIX: KEY PLAYERS, 2024
- 13.7.1 STARS
- 13.7.2 EMERGING LEADERS
- 13.7.3 PERVASIVE PLAYERS
- 13.7.4 PARTICIPANTS
- 13.7.5 COMPANY FOOTPRINT: KEY PLAYERS, 2024
- 13.7.5.1 Company footprint
- 13.7.5.2 Regional footprint
- 13.7.5.3 Technology footprint
- 13.7.5.4 Product tested footprint
- 13.8 COMPANY EVALUATION MATRIX: STARTUPS/SMES, 2024
- 13.8.1 PROGRESSIVE COMPANIES
- 13.8.2 RESPONSIVE COMPANIES
- 13.8.3 DYNAMIC COMPANIES
- 13.8.4 STARTING BLOCKS
- 13.8.5 COMPETITIVE BENCHMARKING: STARTUPS/SMES, 2024
- 13.8.5.1 Detailed list of key startups/SMEs
- 13.8.5.2 Competitive benchmarking of key startups/SMEs
- 13.9 COMPETITIVE SCENARIO
- 13.9.1 SERVICE LAUNCHES
- 13.9.2 DEALS
- 13.9.3 EXPANSIONS
14 COMPANY PROFILES
- 14.1 KEY PLAYERS
- 14.1.1 EUROFINS SCIENTIFIC
- 14.1.1.1 Business overview
- 14.1.1.2 Products/Services/Solutions offered
- 14.1.1.3 Recent developments
- 14.1.1.3.1 Service launches
- 14.1.1.3.2 Other developments
- 14.1.1.4 MnM view
- 14.1.1.4.1 Key strengths
- 14.1.1.4.2 Strategic choices
- 14.1.1.4.3 Weaknesses & competitive threats
- 14.1.2 SGS S.A.
- 14.1.2.1 Business overview
- 14.1.2.2 Products/Services/Solutions offered
- 14.1.2.3 Recent developments
- 14.1.2.3.1 Deals
- 14.1.2.3.2 Expansions
- 14.1.2.4 MnM view
- 14.1.2.4.1 Key strengths
- 14.1.2.4.2 Strategic choices
- 14.1.2.4.3 Weaknesses & competitive threats
- 14.1.3 MERIEUX NUTRISCIENCES
- 14.1.3.1 Business overview
- 14.1.3.2 Products/Services/Solutions offered
- 14.1.3.3 Recent developments
- 14.1.3.3.1 Deals
- 14.1.3.4 MnM view
- 14.1.3.4.1 Key strengths
- 14.1.3.4.2 Strategic choices
- 14.1.3.4.3 Weaknesses & competitive threats
- 14.1.4 INTERTEK GROUP PLC (UK)
- 14.1.4.1 Business overview
- 14.1.4.2 Products/Services/Solutions offered
- 14.1.4.3 Recent developments
- 14.1.4.3.1 Services launches
- 14.1.4.3.2 Deals
- 14.1.4.4 MnM view
- 14.1.4.4.1 Key strengths
- 14.1.4.4.2 Strategic choices
- 14.1.4.4.3 Weaknesses & competitive threats
- 14.1.5 UL SOLUTIONS
- 14.1.5.1 Business overview
- 14.1.5.2 Products/Services/Solutions offered
- 14.1.5.3 Recent developments
- 14.1.5.3.1 Deals
- 14.1.5.3.2 Expansions
- 14.1.5.4 MnM view
- 14.1.5.4.1 Key strengths
- 14.1.5.4.2 Strategic choices
- 14.1.5.4.3 Weaknesses & competitive threats
- 14.1.6 ALS
- 14.1.6.1 Business overview
- 14.1.6.2 Products/Services/Solutions offered
- 14.1.6.3 Recent developments
- 14.1.6.3.1 Expansions
- 14.1.6.4 MnM view
- 14.1.7 TUV SUD
- 14.1.7.1 Business overview
- 14.1.7.2 Products/Services/Solutions offered
- 14.1.7.3 Recent developments
- 14.1.7.4 MnM view
- 14.1.8 TENTAMUS
- 14.1.8.1 Business overview
- 14.1.8.2 Products/Services/Solutions offered
- 14.1.8.3 Recent developments
- 14.1.8.3.1 Expansions
- 14.1.8.4 MnM view
- 14.1.9 AGROLAB GROUP
- 14.1.9.1 Business overview
- 14.1.9.2 Products/Services/Solutions offered
- 14.1.9.3 Recent developments
- 14.1.9.4 MnM view
- 14.1.10 FOODCHAIN ID
- 14.1.10.1 Business overview
- 14.1.10.2 Products/Services/Solutions offered
- 14.1.10.3 Recent developments
- 14.1.10.3.1 Expansions
- 14.1.10.4 MnM view
- 14.1.11 ELEMENT MATERIALS TECHNOLOGY
- 14.1.11.1 Business overview
- 14.1.11.2 Products/Services/Solutions offered
- 14.1.11.3 Recent developments
- 14.1.11.4 MnM view
- 14.1.12 LGC LIMITED
- 14.1.12.1 Business overview
- 14.1.12.2 Products/Services/Solutions offered
- 14.1.12.3 Recent developments
- 14.1.12.4 MnM view
- 14.1.13 CERTIFIED LABORATORIES
- 14.1.13.1 Business overview
- 14.1.13.2 Products/Services/Solutions offered
- 14.1.13.3 Recent developments
- 14.1.13.3.1 Expansions
- 14.1.13.4 MnM view
- 14.1.14 VIMTA LABS LTD.
- 14.1.14.1 Business overview
- 14.1.14.2 Products/Services/Solutions offered
- 14.1.14.3 Recent developments
- 14.1.14.3.1 Other developments
- 14.1.14.4 MnM view
- 14.1.15 QALITEX
- 14.1.15.1 Business overview
- 14.1.15.2 Products/Services/Solutions offered
- 14.1.15.3 Recent developments
- 14.1.15.3.1 Expansions
- 14.1.15.4 MnM view
- 14.1.1 EUROFINS SCIENTIFIC
- 14.2 OTHER PLAYERS
- 14.2.1 ANRESCO LABORATORIES
- 14.2.1.1 Business overview
- 14.2.1.2 Products/Services/Solutions offered
- 14.2.1.3 Recent developments
- 14.2.1.4 MnM view
- 14.2.2 BEACONPOINT LABS
- 14.2.2.1 Business overview
- 14.2.2.2 Products/Services/Solutions offered
- 14.2.2.3 Recent developments
- 14.2.2.4 MnM view
- 14.2.3 TWIN ARBOR LABS
- 14.2.3.1 Business overview
- 14.2.3.2 Products/Services/Solutions offered
- 14.2.3.3 Recent developments
- 14.2.3.4 MnM view
- 14.2.4 ALKEMIST
- 14.2.4.1 Business overview
- 14.2.4.2 Products/Services/Solutions offered
- 14.2.4.3 Recent developments
- 14.2.4.4 MnM view
- 14.2.5 AURIGA RESEARCH PRIVATE LIMITED
- 14.2.5.1 Business overview
- 14.2.5.2 Products/Services/Solutions offered
- 14.2.5.3 Recent developments
- 14.2.5.4 MnM view
- 14.2.6 ACCURATE LABS
- 14.2.7 MICROCHEM LABORATORY
- 14.2.8 MS BIOANALYTICAL LLC
- 14.2.9 AEMTEK
- 14.2.10 MICROBAC LABORATORIES
- 14.2.1 ANRESCO LABORATORIES
15 ADJACENT & RELATED MARKETS
- 15.1 INTRODUCTION
- 15.2 STUDY LIMITATIONS
- 15.3 DIETARY SUPPLEMENTS MARKET
- 15.3.1 MARKET DEFINITION
- 15.3.2 MARKET OVERVIEW
- 15.4 FOOD SAFETY TESTING MARKET
- 15.4.1 MARKET DEFINITION
- 15.4.2 MARKET OVERVIEW
16 APPENDIX
- 16.1 DISCUSSION GUIDE
- 16.2 KNOWLEDGESTORE: MARKETSANDMARKETS' SUBSCRIPTION PORTAL
- 16.3 CUSTOMIZATION OPTIONS
- 16.4 RELATED REPORTS
- 16.5 AUTHOR DETAILS
List of Tables
- TABLE 1 USD EXCHANGE RATES, 2020-2024
- TABLE 2 DIETARY SUPPLEMENTS TESTING MARKET SNAPSHOT, 2025 VS. 2030 (USD MILLION)
- TABLE 3 US ADJUSTED RECIPROCAL TARIFF RATES
- TABLE 4 EXPECTED IMPACT LEVEL ON TARGET TESTING MATERIALS WITH RELEVANT HS CODES DUE TO US TARIFF IMPACT
- TABLE 5 DIETARY SUPPLEMENTS TESTING MARKET: EXPECTED TARIFF IMPACT ON END-USE INDUSTRIES
- TABLE 6 IMPORT SCENARIO FOR HS CODE: 3822, BY COUNTRY, 2020-2024 (TONS)
- TABLE 7 EXPORT SCENARIO FOR HS CODE: 3822, BY COUNTRY, 2020-2024 (TONS)
- TABLE 8 AVERAGE SELLING PRICE OF DIETARY SUPPLEMENT TESTING, BY KEY PLAYER, 2024 (USD)
- TABLE 9 INDICATIVE AVERAGE SELLING PRICE TREND OF DIETARY SUPPLEMENT TESTING, BY REGION, 2021-2024 (USD/SAMPLE TEST)
- TABLE 10 DIETARY SUPPLEMENTS TESTING MARKET: ECOSYSTEM
- TABLE 11 LIST OF MAJOR PATENTS PERTAINING TO DIETARY SUPPLEMENTS TESTING MARKET, 2018-2025
- TABLE 12 DIETARY SUPPLEMENTS TESTING MARKET: LIST OF KEY CONFERENCES AND EVENTS, 2025-2026
- TABLE 13 NORTH AMERICA: REGULATORY BODIES, GOVERNMENT AGENCIES, AND OTHER ORGANIZATIONS
- TABLE 14 EUROPE: REGULATORY BODIES, GOVERNMENT AGENCIES, AND OTHER ORGANIZATIONS
- TABLE 15 ASIA PACIFIC: REGULATORY BODIES, GOVERNMENT AGENCIES, AND OTHER ORGANIZATIONS
- TABLE 16 SOUTH AMERICA: REGULATORY BODIES, GOVERNMENT AGENCIES, AND OTHER ORGANIZATIONS
- TABLE 17 REST OF THE WORLD: REGULATORY BODIES, GOVERNMENT AGENCIES, AND OTHER ORGANIZATIONS
- TABLE 18 IMPACT OF PORTER'S FIVE FORCES ON DIETARY SUPPLEMENTS TESTING MARKET
- TABLE 19 INFLUENCE OF STAKEHOLDERS ON BUYING PROCESS FOR KEY TEST TYPES
- TABLE 20 KEY CRITERIA FOR SELECTING SUPPLIERS/VENDORS
- TABLE 21 DIETARY SUPPLEMENTS TESTING MARKET, BY TEST TYPE, 2021-2024 (USD MILLION)
- TABLE 22 DIETARY SUPPLEMENTS TESTING MARKET, BY TEST TYPE, 2025-2030 (USD MILLION)
- TABLE 23 IDENTITY/AUTHENTICATION: DIETARY SUPPLEMENTS TESTING MARKET, BY REGION, 2021-2024 (USD MILLION)
- TABLE 24 IDENTITY/AUTHENTICATION: DIETARY SUPPLEMENTS TESTING MARKET, BY REGION, 2025-2030 (USD MILLION)
- TABLE 25 POTENCY: DIETARY SUPPLEMENTS TESTING MARKET, BY REGION, 2021-2024 (USD MILLION)
- TABLE 26 POTENCY: DIETARY SUPPLEMENTS TESTING MARKET, BY REGION, 2025-2030 (USD MILLION)
- TABLE 27 CONTAMINANTS: DIETARY SUPPLEMENTS TESTING MARKET, BY REGION, 2021-2024 (USD MILLION)
- TABLE 28 CONTAMINANTS: DIETARY SUPPLEMENTS TESTING MARKET, BY REGION, 2025-2030 (USD MILLION)
- TABLE 29 MICROBIOLOGICAL: DIETARY SUPPLEMENTS TESTING MARKET, BY REGION, 2021-2024 (USD MILLION)
- TABLE 30 MICROBIOLOGICAL: DIETARY SUPPLEMENTS TESTING MARKET, BY REGION, 2025-2030 (USD MILLION)
- TABLE 31 ADULTERATION: DIETARY SUPPLEMENTS TESTING MARKET, BY REGION, 2021-2024 (USD MILLION)
- TABLE 32 ADULTERATION: DIETARY SUPPLEMENTS TESTING MARKET, BY REGION, 2025-2030 (USD MILLION)
- TABLE 33 STABILITY & SHELF LIFE: DIETARY SUPPLEMENTS TESTING MARKET, BY REGION, 2021-2024 (USD MILLION)
- TABLE 34 STABILITY & SHELF LIFE: DIETARY SUPPLEMENTS TESTING MARKET, BY REGION, 2025-2030 (USD MILLION)
- TABLE 35 ALLERGEN & GMO: DIETARY SUPPLEMENTS TESTING MARKET, BY REGION, 2021-2024 (USD MILLION)
- TABLE 36 ALLERGEN & GMO: DIETARY SUPPLEMENTS TESTING MARKET, BY REGION, 2025-2030 (USD MILLION)
- TABLE 37 LABEL CLAIM VERIFICATION: DIETARY SUPPLEMENTS TESTING MARKET, BY REGION, 2021-2024 (USD MILLION)
- TABLE 38 LABEL CLAIM VERIFICATION: DIETARY SUPPLEMENTS TESTING MARKET, BY REGION, 2025-2030 (USD MILLION)
- TABLE 39 FUNCTIONAL CLAIMS: DIETARY SUPPLEMENTS TESTING MARKET, BY REGION, 2021-2024 (USD MILLION)
- TABLE 40 FUNCTIONAL CLAIMS: DIETARY SUPPLEMENTS TESTING MARKET, BY REGION, 2025-2030 (USD MILLION)
- TABLE 41 OTHER TEST TYPES: DIETARY SUPPLEMENTS TESTING MARKET, BY REGION, 2021-2024 (USD MILLION)
- TABLE 42 OTHER TEST TYPES: DIETARY SUPPLEMENTS TESTING MARKET, BY REGION, 2025-2030 (USD MILLION)
- TABLE 43 DIETARY SUPPLEMENTS TESTING MARKET, BY PRODUCT TESTED, 2021-2024 (USD MILLION)
- TABLE 44 DIETARY SUPPLEMENTS TESTING MARKET, BY PRODUCT TESTED, 2025-2030 (USD MILLION)
- TABLE 45 BOTANICALS: DIETARY SUPPLEMENTS TESTING MARKET, BY REGION, 2021-2024 (USD MILLION)
- TABLE 46 BOTANICALS: DIETARY SUPPLEMENTS TESTING MARKET, BY REGION, 2025-2030 (USD MILLION)
- TABLE 47 PHYTOCHEMICALS: DIETARY SUPPLEMENTS TESTING MARKET, BY REGION, 2021-2024 (USD MILLION)
- TABLE 48 PHYTOCHEMICALS: DIETARY SUPPLEMENTS TESTING MARKET, BY REGION, 2025-2030 (USD MILLION)
- TABLE 49 VITAMINS & MINERALS: DIETARY SUPPLEMENTS TESTING MARKET, BY REGION, 2021-2024 (USD MILLION)
- TABLE 50 VITAMINS & MINERALS: DIETARY SUPPLEMENTS TESTING MARKET, BY REGION, 2025-2030 (USD MILLION)
- TABLE 51 AMINO ACIDS & PROTEINS: DIETARY SUPPLEMENTS TESTING MARKET, BY REGION, 2021-2024 (USD MILLION)
- TABLE 52 AMINO ACIDS & PROTEINS: DIETARY SUPPLEMENTS TESTING MARKET, BY REGION, 2025-2030 (USD MILLION)
- TABLE 53 SPECIALTY SUPPLEMENTS: DIETARY SUPPLEMENTS TESTING MARKET, BY REGION, 2021-2024 (USD MILLION)
- TABLE 54 SPECIALTY SUPPLEMENTS: DIETARY SUPPLEMENTS TESTING MARKET, BY REGION, 2025-2030 (USD MILLION)
- TABLE 55 OTHER INGREDIENTS: DIETARY SUPPLEMENTS TESTING MARKET, BY REGION, 2021-2024 (USD MILLION)
- TABLE 56 OTHER INGREDIENTS: DIETARY SUPPLEMENTS TESTING MARKET, BY REGION, 2025-2030 (USD MILLION)
- TABLE 57 FINISHED PRODUCT TESTING: DIETARY SUPPLEMENTS TESTING MARKET, BY REGION, 2021-2024 (USD MILLION)
- TABLE 58 FINISHED PRODUCT TESTING: DIETARY SUPPLEMENTS TESTING MARKET, BY REGION, 2025-2030 (USD MILLION)
- TABLE 59 DIETARY SUPPLEMENTS TESTING MARKET, BY TECHNOLOGY, 2021-2024 (USD MILLION)
- TABLE 60 DIETARY SUPPLEMENTS TESTING MARKET, BY TECHNOLOGY, 2025-2030 (USD MILLION)
- TABLE 61 TRADITIONAL: DIETARY SUPPLEMENTS TESTING MARKET, BY REGION, 2021-2024 (USD MILLION)
- TABLE 62 TRADITIONAL: DIETARY SUPPLEMENTS TESTING MARKET, BY REGION, 2025-2030 (USD MILLION)
- TABLE 63 RAPID: DIETARY SUPPLEMENTS TESTING MARKET, BY REGION, 2021-2024 (USD MILLION)
- TABLE 64 RAPID: DIETARY SUPPLEMENTS TESTING MARKET, BY REGION, 2025-2030 (USD MILLION)
- TABLE 65 DIETARY SUPPLEMENTS TESTING MARKET, BY REGION, 2021-2024 (USD MILLION)
- TABLE 66 DIETARY SUPPLEMENTS TESTING MARKET, BY REGION, 2025-2030 (USD MILLION)
- TABLE 67 DIETARY SUPPLEMENTS TESTING MARKET, BY REGION, 2021-2024 (THOUSAND UNITS)
- TABLE 68 DIETARY SUPPLEMENTS TESTING MARKET, BY REGION, 2025-2030 (THOUSAND UNITS)
- TABLE 69 NORTH AMERICA: DIETARY SUPPLEMENTS TESTING MARKET, BY COUNTRY, 2021-2024 (USD MILLION)
- TABLE 70 NORTH AMERICA: DIETARY SUPPLEMENTS TESTING MARKET, BY COUNTRY, 2025-2030 (USD MILLION)
- TABLE 71 NORTH AMERICA: DIETARY SUPPLEMENTS TESTING MARKET, BY TEST TYPE, 2021-2024 (USD MILLION)
- TABLE 72 NORTH AMERICA: DIETARY SUPPLEMENTS TESTING MARKET, BY TEST TYPE, 2025-2030 (USD MILLION)
- TABLE 73 NORTH AMERICA: DIETARY SUPPLEMENTS TESTING MARKET, BY PRODUCT TESTED, 2021-2024 (USD MILLION)
- TABLE 74 NORTH AMERICA: DIETARY SUPPLEMENTS TESTING MARKET, BY PRODUCT TESTED, 2025-2030 (USD MILLION)
- TABLE 75 NORTH AMERICA: DIETARY SUPPLEMENTS TESTING MARKET, BY TECHNOLOGY, 2021-2024 (USD MILLION)
- TABLE 76 NORTH AMERICA: DIETARY SUPPLEMENTS TESTING MARKET, BY TECHNOLOGY, 2025-2030 (USD MILLION)
- TABLE 77 US: DIETARY SUPPLEMENTS TESTING MARKET, BY TEST TYPE, 2021-2024 (USD MILLION)
- TABLE 78 US: DIETARY SUPPLEMENTS TESTING MARKET, BY TEST TYPE, 2025-2030 (USD MILLION)
- TABLE 79 CANADA: DIETARY SUPPLEMENTS TESTING MARKET, BY TEST TYPE, 2021-2024 (USD MILLION)
- TABLE 80 CANADA: DIETARY SUPPLEMENTS TESTING MARKET, BY TEST TYPE, 2025-2030 (USD MILLION)
- TABLE 81 MEXICO: DIETARY SUPPLEMENTS TESTING MARKET, BY TEST TYPE, 2021-2024 (USD MILLION)
- TABLE 82 MEXICO: DIETARY SUPPLEMENTS TESTING MARKET, BY TEST TYPE, 2025-2030 (USD MILLION)
- TABLE 83 EUROPE: DIETARY SUPPLEMENTS TESTING MARKET, BY COUNTRY, 2021-2024 (USD MILLION)
- TABLE 84 EUROPE: DIETARY SUPPLEMENTS TESTING MARKET, BY COUNTRY, 2025-2030 (USD MILLION)
- TABLE 85 EUROPE: DIETARY SUPPLEMENTS TESTING MARKET, BY TEST TYPE, 2021-2024 (USD MILLION)
- TABLE 86 EUROPE: DIETARY SUPPLEMENTS TESTING MARKET, BY TEST TYPE, 2025-2030 (USD MILLION)
- TABLE 87 EUROPE: DIETARY SUPPLEMENTS TESTING MARKET, BY PRODUCT TESTED, 2021-2024 (USD MILLION)
- TABLE 88 EUROPE: DIETARY SUPPLEMENTS TESTING MARKET, BY PRODUCT TESTED, 2025-2030 (USD MILLION)
- TABLE 89 EUROPE: DIETARY SUPPLEMENTS TESTING MARKET, BY TECHNOLOGY, 2021-2024 (USD MILLION)
- TABLE 90 EUROPE: DIETARY SUPPLEMENTS TESTING MARKET, BY TECHNOLOGY, 2025-2030 (USD MILLION)
- TABLE 91 GERMANY: DIETARY SUPPLEMENTS TESTING MARKET, BY TEST TYPE, 2021-2024 (USD MILLION)
- TABLE 92 GERMANY: DIETARY SUPPLEMENTS TESTING MARKET, BY TEST TYPE, 2025-2030 (USD MILLION)
- TABLE 93 UK: DIETARY SUPPLEMENTS TESTING MARKET, BY TEST TYPE, 2021-2024 (USD MILLION)
- TABLE 94 UK: DIETARY SUPPLEMENTS TESTING MARKET, BY TEST TYPE, 2025-2030 (USD MILLION)
- TABLE 95 FRANCE: DIETARY SUPPLEMENTS TESTING MARKET, BY TEST TYPE, 2021-2024 (USD MILLION)
- TABLE 96 FRANCE: DIETARY SUPPLEMENTS TESTING MARKET, BY TEST TYPE, 2025-2030 (USD MILLION)
- TABLE 97 ITALY: DIETARY SUPPLEMENTS TESTING MARKET, BY TEST TYPE, 2021-2024 (USD MILLION)
- TABLE 98 ITALY: DIETARY SUPPLEMENTS TESTING MARKET, BY TEST TYPE, 2025-2030 (USD MILLION)
- TABLE 99 SPAIN: DIETARY SUPPLEMENTS TESTING MARKET, BY TEST TYPE, 2021-2024 (USD MILLION)
- TABLE 100 SPAIN: DIETARY SUPPLEMENTS TESTING MARKET, BY TEST TYPE, 2025-2030 (USD MILLION)
- TABLE 101 REST OF EUROPE: DIETARY SUPPLEMENTS TESTING MARKET, BY TEST TYPE, 2021-2024 (USD MILLION)
- TABLE 102 REST OF EUROPE: DIETARY SUPPLEMENTS TESTING MARKET, BY TEST TYPE, 2025-2030 (USD MILLION)
- TABLE 103 ASIA PACIFIC: DIETARY SUPPLEMENTS TESTING MARKET, BY COUNTRY, 2021-2024 (USD MILLION)
- TABLE 104 ASIA PACIFIC: DIETARY SUPPLEMENTS TESTING MARKET, BY COUNTRY, 2025-2030 (USD MILLION)
- TABLE 105 ASIA PACIFIC: DIETARY SUPPLEMENTS TESTING MARKET, BY TEST TYPE, 2021-2024 (USD MILLION)
- TABLE 106 ASIA PACIFIC: DIETARY SUPPLEMENTS TESTING MARKET, BY TEST TYPE, 2025-2030 (USD MILLION)
- TABLE 107 ASIA PACIFIC: DIETARY SUPPLEMENTS TESTING MARKET, BY PRODUCT TESTED, 2021-2024 (USD MILLION)
- TABLE 108 ASIA PACIFIC: DIETARY SUPPLEMENTS TESTING MARKET, BY PRODUCT TESTED, 2025-2030 (USD MILLION)
- TABLE 109 ASIA PACIFIC: DIETARY SUPPLEMENTS TESTING MARKET, BY TECHNOLOGY, 2021-2024 (USD MILLION)
- TABLE 110 ASIA PACIFIC: DIETARY SUPPLEMENTS TESTING MARKET, BY TECHNOLOGY, 2025-2030 (USD MILLION)
- TABLE 111 CHINA: DIETARY SUPPLEMENTS TESTING MARKET, BY TEST TYPE, 2021-2024 (USD MILLION)
- TABLE 112 CHINA: DIETARY SUPPLEMENTS TESTING MARKET, BY TEST TYPE, 2025-2030 (USD MILLION)
- TABLE 113 JAPAN: DIETARY SUPPLEMENTS TESTING MARKET, BY TEST TYPE, 2021-2024 (USD MILLION)
- TABLE 114 JAPAN: DIETARY SUPPLEMENTS TESTING MARKET, BY TEST TYPE, 2025-2030 (USD MILLION)
- TABLE 115 INDIA: DIETARY SUPPLEMENTS TESTING MARKET, BY TEST TYPE, 2021-2024 (USD MILLION)
- TABLE 116 INDIA: DIETARY SUPPLEMENTS TESTING MARKET, BY TEST TYPE, 2025-2030 (USD MILLION)
- TABLE 117 AUSTRALIA & NEW ZEALAND: DIETARY SUPPLEMENTS TESTING MARKET, BY TEST TYPE, 2021-2024 (USD MILLION)
- TABLE 118 AUSTRALIA & NEW ZEALAND: DIETARY SUPPLEMENTS TESTING MARKET, BY TEST TYPE, 2025-2030 (USD MILLION)
- TABLE 119 VIETNAM: DIETARY SUPPLEMENTS TESTING MARKET, BY TEST TYPE, 2021-2024 (USD MILLION)
- TABLE 120 VIETNAM: DIETARY SUPPLEMENTS TESTING MARKET, BY TEST TYPE, 2025-2030 (USD MILLION)
- TABLE 121 REST OF ASIA PACIFIC: DIETARY SUPPLEMENTS TESTING MARKET, BY TEST TYPE, 2021-2024 (USD MILLION)
- TABLE 122 REST OF ASIA PACIFIC: DIETARY SUPPLEMENTS TESTING MARKET, BY TEST TYPE, 2025-2030 (USD MILLION)
- TABLE 123 SOUTH AMERICA: DIETARY SUPPLEMENT TESTING MARKET, BY COUNTRY, 2021-2024 (USD MILLION)
- TABLE 124 SOUTH AMERICA: DIETARY SUPPLEMENT TESTING MARKET, BY COUNTRY, 2025-2030 (USD MILLION)
- TABLE 125 SOUTH AMERICA: DIETARY SUPPLEMENT TESTING MARKET, BY TEST TYPE, 2021-2024 (USD MILLION)
- TABLE 126 SOUTH AMERICA: DIETARY SUPPLEMENT TESTING MARKET, BY TEST TYPE, 2025-2030 (USD MILLION)
- TABLE 127 SOUTH AMERICA: DIETARY SUPPLEMENT TESTING MARKET, BY PRODUCT TESTED, 2021-2024 (USD MILLION)
- TABLE 128 SOUTH AMERICA: DIETARY SUPPLEMENT TESTING MARKET, BY PRODUCT TESTED, 2025-2030 (USD MILLION)
- TABLE 129 SOUTH AMERICA: DIETARY SUPPLEMENT TESTING MARKET, BY TECHNOLOGY, 2021-2024 (USD MILLION)
- TABLE 130 SOUTH AMERICA: DIETARY SUPPLEMENT TESTING MARKET, BY TECHNOLOGY, 2025-2030 (USD MILLION)
- TABLE 131 BRAZIL: DIETARY SUPPLEMENT TESTING MARKET, BY TEST TYPE, 2021-2024 (USD MILLION)
- TABLE 132 BRAZIL: DIETARY SUPPLEMENT TESTING MARKET, BY TEST TYPE, 2025-2030 (USD MILLION)
- TABLE 133 ARGENTINA: DIETARY SUPPLEMENT TESTING MARKET, BY TEST TYPE, 2021-2024 (USD MILLION)
- TABLE 134 ARGENTINA: DIETARY SUPPLEMENT TESTING MARKET, BY TEST TYPE, 2025-2030 (USD MILLION)
- TABLE 135 REST OF SOUTH AMERICA: DIETARY SUPPLEMENT TESTING MARKET, BY TEST TYPE, 2021-2024 (USD MILLION)
- TABLE 136 REST OF SOUTH AMERICA: DIETARY SUPPLEMENT TESTING MARKET, BY TEST TYPE, 2025-2030 (USD MILLION)
- TABLE 137 REST OF THE WORLD: DIETARY SUPPLEMENT TESTING MARKET, BY COUNTRY, 2021-2024 (USD MILLION)
- TABLE 138 ROW: DIETARY SUPPLEMENT TESTING MARKET, BY COUNTRY, 2025-2030 (USD MILLION)
- TABLE 139 REST OF THE WORLD: DIETARY SUPPLEMENT TESTING MARKET, BY TEST TYPE, 2021-2024 (USD MILLION)
- TABLE 140 REST OF THE WORLD: DIETARY SUPPLEMENT TESTING MARKET, BY TEST TYPE, 2025-2030 (USD MILLION)
- TABLE 141 REST OF THE WORLD: DIETARY SUPPLEMENT TESTING MARKET, BY PRODUCT TESTED, 2021-2024 (USD MILLION)
- TABLE 142 REST OF THE WORLD: DIETARY SUPPLEMENT TESTING MARKET, BY PRODUCT TESTED, 2025-2030 (USD MILLION)
- TABLE 143 REST OF THE WORLD: DIETARY SUPPLEMENT TESTING MARKET, BY TECHNOLOGY, 2021-2024 (USD MILLION)
- TABLE 144 REST OF THE WORLD: DIETARY SUPPLEMENT TESTING MARKET, BY TECHNOLOGY, 2025-2030 (USD MILLION)
- TABLE 145 AFRICA: DIETARY SUPPLEMENT TESTING MARKET, BY TEST TYPE, 2021-2024 (USD MILLION)
- TABLE 146 AFRICA: DIETARY SUPPLEMENT TESTING MARKET, BY TEST TYPE, 2025-2030 (USD MILLION)
- TABLE 147 MIDDLE EAST: DIETARY SUPPLEMENT TESTING MARKET, BY TEST TYPE, 2021-2024 (USD MILLION)
- TABLE 148 MIDDLE EAST: DIETARY SUPPLEMENT TESTING MARKET, BY TEST TYPE, 2025-2030 (USD MILLION)
- TABLE 149 OVERVIEW OF STRATEGIES ADOPTED BY KEY DIETARY SUPPLEMENTS TESTING MARKET PLAYERS, 2021-AUGUST 2025
- TABLE 150 SHARE ANALYSIS OF DIETARY SUPPLEMENTS TESTING MARKET, 2024
- TABLE 151 DIETARY SUPPLEMENTS TESTING MARKET: REGIONAL FOOTPRINT
- TABLE 152 DIETARY SUPPLEMENTS TESTING MARKET: TECHNOLOGY FOOTPRINT
- TABLE 153 DIETARY SUPPLEMENTS TESTING MARKET: PRODUCT TESTED FOOTPRINT
- TABLE 154 DIETARY SUPPLEMENTS TESTING MARKET: DETAILED LIST OF KEY STARTUPS/SMES
- TABLE 155 DIETARY SUPPLEMENTS TESTING MARKET: COMPETITIVE BENCHMARKING OF KEY STARTUPS/SMES
- TABLE 156 DIETARY SUPPLEMENTS TESTING MARKET: SERVICE LAUNCHES, 2021-AUGUST 2025
- TABLE 157 DIETARY SUPPLEMENTS TESTING MARKET: DEALS, 2021-AUGUST 2025
- TABLE 158 DIETARY SUPPLEMENTS TESTING MARKET: EXPANSIONS, 2021-AUGUST 2025
- TABLE 159 EUROFINS SCIENTIFIC: COMPANY OVERVIEW
- TABLE 160 EUROFINS SCIENTIFIC: PRODUCTS/SERVICES/SOLUTIONS OFFERED
- TABLE 161 EUROFINS SCIENTIFIC: SERVICE LAUNCHES
- TABLE 162 EUROFINS SCIENTIFIC: OTHER DEVELOPMENTS
- TABLE 163 SGS S.A.: COMPANY OVERVIEW
- TABLE 164 SGS S.A.: PRODUCTS/SERVICES/SOLUTIONS OFFERED
- TABLE 165 SGS S.A.: DEALS
- TABLE 166 SGS S.A.: EXPANSIONS
- TABLE 167 MERIEUX NUTRISCIENCES: COMPANY OVERVIEW
- TABLE 168 MERIEUX NUTRISCIENCES: PRODUCTS/SERVICES/SOLUTIONS OFFERED
- TABLE 169 MERIEUX NUTRISCIENCES: DEALS
- TABLE 170 INTERTEK GROUP PLC: COMPANY OVERVIEW
- TABLE 171 INTERTEK GROUP PLC: PRODUCTS/SERVICES/SOLUTIONS OFFERED
- TABLE 172 INTERTEK GROUP PLC: SERVICE LAUNCHES
- TABLE 173 INTERTEK GROUP PLC: DEALS
- TABLE 174 UL SOLUTIONS: COMPANY OVERVIEW
- TABLE 175 UL SOLUTIONS: PRODUCTS/SERVICES/SOLUTIONS OFFERED
- TABLE 176 UL SOLUTIONS: DEALS
- TABLE 177 UL SOLUTIONS: EXPANSIONS
- TABLE 178 ALS: COMPANY OVERVIEW
- TABLE 179 ALS: PRODUCTS/SERVICES/SOLUTIONS OFFERED
- TABLE 180 ALS: EXPANSIONS
- TABLE 181 TUV SUD: COMPANY OVERVIEW
- TABLE 182 TUV SUD: PRODUCTS/SERVICES/SOLUTIONS OFFERED
- TABLE 183 TENTAMUS: COMPANY OVERVIEW
- TABLE 184 TENTAMUS: PRODUCTS/SERVICES/SOLUTIONS OFFERED
- TABLE 185 TENTAMUS: EXPANSIONS
- TABLE 186 AGROLAB GROUP: COMPANY OVERVIEW
- TABLE 187 AGROLAB GROUP: PRODUCTS/SERVICES/SOLUTIONS OFFERED
- TABLE 188 FOODCHAIN ID: COMPANY OVERVIEW
- TABLE 189 FOODCHAIN ID: PRODUCTS/SERVICES/SOLUTIONS OFFERED
- TABLE 190 FOODCHAIN ID: EXPANSIONS
- TABLE 191 ELEMENT MATERIALS TECHNOLOGY: COMPANY OVERVIEW
- TABLE 192 ELEMENT MATERIALS TECHNOLOGY: PRODUCTS/SERVICES/SOLUTIONS OFFERED
- TABLE 193 LGC LIMITED: COMPANY OVERVIEW
- TABLE 194 LGC LIMITED: PRODUCTS/SERVICES/SOLUTIONS OFFERED
- TABLE 195 CERTIFIED LABORATORIES: COMPANY OVERVIEW
- TABLE 196 CERTIFIED LABORATORIES: PRODUCTS/SERVICES/SOLUTIONS OFFERED
- TABLE 197 CERTIFIED LABORATORIES: EXPANSIONS
- TABLE 198 VIMTA LABS LTD.: COMPANY OVERVIEW
- TABLE 199 VIMTA LABS LTD.: PRODUCTS/SERVICES/SOLUTIONS OFFERED
- TABLE 200 VIMTA LABS LTD.: OTHER DEVELOPMENTS
- TABLE 201 QALITEX: COMPANY OVERVIEW
- TABLE 202 QALITEX: PRODUCTS/SERVICES/SOLUTIONS OFFERED
- TABLE 203 QALITEX: EXPANSIONS
- TABLE 204 ANRESCO LABORATORIES: COMPANY OVERVIEW
- TABLE 205 ANRESCO LABORATORIES: PRODUCTS/SERVICES/SOLUTIONS OFFERED
- TABLE 206 BEACONPOINT LABS: COMPANY OVERVIEW
- TABLE 207 BEACONPOINT LABS: PRODUCTS/SERVICES/SOLUTIONS OFFERED
- TABLE 208 TWIN ARBOR LABS: COMPANY OVERVIEW
- TABLE 209 TWIN ARBOR LABS: PRODUCTS/SERVICES/SOLUTIONS OFFERED
- TABLE 210 ALKEMIST: COMPANY OVERVIEW
- TABLE 211 ALKEMIST: PRODUCTS/SERVICES/SOLUTIONS OFFERED
- TABLE 212 AURIGA RESEARCH PRIVATE LIMITED: COMPANY OVERVIEW
- TABLE 213 AURIGA RESEARCH PRIVATE LIMITED: PRODUCTS/SERVICES/SOLUTIONS OFFERED
- TABLE 214 MARKETS ADJACENT TO DIETARY SUPPLEMENTS TESTING MARKET
- TABLE 215 DIETARY SUPPLEMENTS MARKET, BY MODE OF APPLICATION, 2020-2023 (USD MILLION)
- TABLE 216 DIETARY SUPPLEMENTS MARKET, BY MODE OF APPLICATION, 2024-2029 (USD MILLION)
- TABLE 217 FOOD SAFETY TESTING MARKET, BY TECHNOLOGY, 2017-2021 (USD MILLION)
- TABLE 218 FOOD SAFETY TESTING MARKET, BY TECHNOLOGY, 2022-2027 (USD MILLION)
List of Figures
- FIGURE 1 DIETARY SUPPLEMENTS TESTING MARKET: RESEARCH DESIGN
- FIGURE 2 BREAKDOWN OF PRIMARY INTERVIEWS: BY COMPANY TYPE, DESIGNATION, AND REGION
- FIGURE 3 MARKET SIZE ESTIMATION METHODOLOGY: TOP-DOWN APPROACH
- FIGURE 4 SUPPLY-SIDE ANALYSIS: SOURCES OF INFORMATION AT EVERY STEP
- FIGURE 5 DIETARY SUPPLEMENTS TESTING MARKET: BOTTOM-UP APPROACH
- FIGURE 6 DATA TRIANGULATION
- FIGURE 7 DIETARY SUPPLEMENTS TESTING MARKET, BY TEST TYPE, 2025 VS. 2030 (USD MILLION)
- FIGURE 8 DIETARY SUPPLEMENTS TESTING MARKET, BY PRODUCT TESTED, 2025 VS. 2030 (USD MILLION)
- FIGURE 9 DIETARY SUPPLEMENTS TESTING MARKET, BY TECHNOLOGY, 2025 VS. 2030 (USD MILLION)
- FIGURE 10 DIETARY SUPPLEMENTS TESTING MARKET SHARE AND GROWTH RATE, BY REGION, 2025 (BY VALUE)
- FIGURE 11 STRINGENT REGULATORY REQUIREMENTS ACROSS REGIONS AND RISING DEMAND FOR PREVENTIVE HEALTHCARE SOLUTIONS TO DRIVE MARKET
- FIGURE 12 US AND RAPID SEGMENT TO ACCOUNT FOR SIGNIFICANT MARKET SHARES IN 2025
- FIGURE 13 POTENCY SEGMENT TO LEAD MARKET IN 2025
- FIGURE 14 INGREDIENT-LEVEL TESTING SEGMENT TO DOMINATE MARKET DURING FORECAST PERIOD
- FIGURE 15 RAPID TECHNOLOGY SEGMENT TO LEAD MARKET DURING FORECAST PERIOD
- FIGURE 16 US TO ACCOUNT FOR LARGEST MARKET SHARE IN 2025
- FIGURE 17 CHRONIC DISEASES: TOP CAUSES OF DEATH WORLDWIDE AMONG ALL AGES, 2021
- FIGURE 18 DIETARY SUPPLEMENTS TESTING MARKET: DRIVERS, RESTRAINTS, OPPORTUNITIES, AND CHALLENGES
- FIGURE 19 ADOPTION OF GEN AI IN FOOD AND HEALTH NUTRITIONAL PRODUCTS TESTING INDUSTRY
- FIGURE 20 DIETARY SUPPLEMENTS TESTING MARKET: VALUE CHAIN ANALYSIS
- FIGURE 21 IMPORT OF HS CODE 3822, BY KEY COUNTRY, 2020-2024 (TONS)
- FIGURE 22 EXPORT OF HS CODE 3822, BY KEY COUNTRY, 2020-2024 (TONS)
- FIGURE 23 AVERAGE SELLING PRICE OF DIETARY SUPPLEMENT TESTING, BY KEY PLAYER, 2024 (USD)
- FIGURE 24 INDICATIVE AVERAGE SELLING PRICE TREND OF DIETARY SUPPLEMENT TESTING, BY REGION, 2021-2024 (USD/ SAMPLE TEST)
- FIGURE 25 DIETARY SUPPLEMENTS TESTING MARKET: ECOSYSTEM ANALYSIS
- FIGURE 26 TRENDS/DISRUPTIONS IMPACTING CUSTOMER BUSINESS
- FIGURE 27 NUMBER OF PATENTS APPLIED AND GRANTED, 2017-2025
- FIGURE 28 REGIONAL ANALYSIS OF PATENTS GRANTED FOR DIETARY SUPPLEMENTS TESTING SERVICES
- FIGURE 29 DIETARY SUPPLEMENTS TESTING MARKET: PORTER'S FIVE FORCES ANALYSIS
- FIGURE 30 INFLUENCE OF STAKEHOLDERS ON BUYING PROCESS FOR KEY TEST TYPES
- FIGURE 31 KEY CRITERIA FOR SELECTING SUPPLIERS/VENDORS
- FIGURE 32 DIETARY SUPPLEMENTS TESTING MARKET: INVESTMENT AND FUNDING SCENARIO
- FIGURE 33 DIETARY SUPPLEMENTS TESTING MARKET, BY TEST TYPE, 2025 VS. 2030 (USD MILLION)
- FIGURE 34 DIETARY SUPPLEMENTS TESTING MARKET, BY PRODUCT TESTED, 2025 VS. 2030 (USD MILLION)
- FIGURE 35 DIETARY SUPPLEMENTS TESTING MARKET, BY TECHNOLOGY, 2025 VS. 2030 (USD MILLION)
- FIGURE 36 INDIA TO RECORD HIGHEST CAGR DURING FORECAST PERIOD
- FIGURE 37 NORTH AMERICA: DIETARY SUPPLEMENTS TESTING MARKET SNAPSHOT
- FIGURE 38 ASIA PACIFIC: DIETARY SUPPLEMENTS TESTING MARKET SNAPSHOT
- FIGURE 39 REVENUE ANALYSIS OF KEY PLAYERS, 2022-2024 (USD BILLION)
- FIGURE 40 MARKET SHARE ANALYSIS, 2024
- FIGURE 41 COMPANY VALUATION
- FIGURE 42 FINANCIAL METRICS
- FIGURE 43 DIETARY SUPPLEMENTS TESTING MARKET: BRAND/PRODUCT COMPARISON
- FIGURE 44 DIETARY SUPPLEMENTS TESTING MARKET: COMPANY EVALUATION MATRIX (KEY PLAYERS), 2024
- FIGURE 45 DIETARY SUPPLEMENTS TESTING MARKET: COMPANY FOOTPRINT
- FIGURE 46 DIETARY SUPPLEMENTS TESTING MARKET: COMPANY EVALUATION MATRIX (STARTUPS/SMES), 2024
- FIGURE 47 EUROFINS SCIENTIFIC: COMPANY SNAPSHOT
- FIGURE 48 SGS S.A.: COMPANY SNAPSHOT
- FIGURE 49 INTERTEK GROUP PLC: COMPANY SNAPSHOT
- FIGURE 50 UL SOLUTIONS: COMPANY SNAPSHOT
- FIGURE 51 ALS: COMPANY OVERVIEW
- FIGURE 52 TUV SUD: COMPANY OVERVIEW
- FIGURE 53 LGC LIMITED: COMPANY SNAPSHOT
- FIGURE 54 VIMTA LABS LTD.: COMPANY OVERVIEW

