


 |
市场调查报告书
商品编码
1923691
全球生物甲烷市场依原料、生产流程、最终用途及地区划分-预测至2030年Biomethane Market by Feedstock (Agriculture Residue, Municipal Waste, Energy Crops), Production Process (Anaerobic Digestion & Fermentation, Thermal Gasification), End-use (Power generation, Transportation, Industrial), Region - Global Forecast to 2030 |
||||||
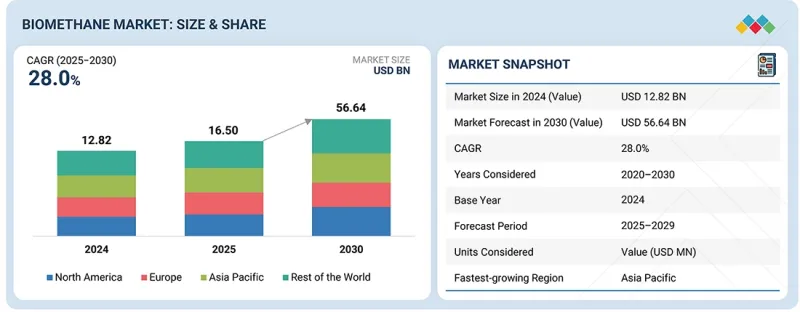
预计生物甲烷市场将从 2025 年的 165 亿美元成长到 2030 年的 566.4 亿美元,预测期内复合年增长率为 28.0%。
生物甲烷市场的发展动力源于人们对循环经济实践的日益关注,这种实践旨在将有机废弃物转化为宝贵的能源。随着掩埋限制和污水处理法规的日益严格,城市和工业企业正转向生物甲烷作为替代能源。
| 调查范围 | |
|---|---|
| 调查期 | 2020-2030 |
| 基准年 | 2024 |
| 预测期 | 2025-2030 |
| 目标单元 | 价值(百万美元/十亿美元);数量(十亿立方米) |
| 部分 | 按原料、製造流程、最终用途和地区划分 |
| 目标区域 | 欧洲、亚太地区、北美洲、南美洲、世界其他地区 |
天然气价格的波动迫使能源消费者将目光投向国内可再生天然气市场,寻求新的供应来源。提纯、液化和数位化工厂优化技术的进步已显着提升了营运效率和可靠性,而天然气网互联和可再生天然气认证体系的兴起,则透过提高市场透明度和交易性,促进了生物甲烷更广泛的商业应用。
由于热气化能够将多种干燥的木质纤维素原料转化为可再生气体,预计未来几年它将成为生物甲烷领域中成长最快的细分市场。与生物法製程的关键差异在于,热气化可以轻鬆处理难以消化的物料,例如林业残余物和工业废弃物,从而扩大生物甲烷原料的来源。人们对先进的废弃物系统的兴趣日益浓厚,加上掩埋处理法规的日益严格,是推动该技术快速普及的关键因素。技术创新正在提高合成气的产量和质量,而製程整合度的提高则最大限度地降低了营运风险。此外,对低碳燃料投资的增加以及支持先进可再生气体技术的政策框架的出台,也提高了热气化计划的商业性可行性。
随着能源消耗产业实施经济高效的脱碳措施的趋势日益普遍,工业领域预计将成为生物甲烷最大的应用领域。许多工业活动严重依赖天然气进行高温加热,这使得电气化在短期内技术上复杂或成本过高。生物甲烷是一种易于整合且直接的替代方案,它使工业部门能够在无需对现有机械设备进行重大改造的情况下减少范围1排放。监管合规、碳排放税和排放报告要求正在加速生物甲烷的应用。此外,长期生物甲烷供应合约使工业部门能够在石化燃料市场波动的情况下获得价格稳定的优势。同时,企业净零排放承诺和永续性目标正鼓励各产业将可再生气体视为可行的脱碳选择,从而帮助它们实现目标。
预计欧洲将成为全球第二大生物甲烷市场,这得益于其发达的可再生天然气生态系统和强有力的优惠政策。儘管一些欧洲国家已经实现了生物甲烷技术的广泛应用,但透过取代老旧技术、提升产能以及将生物甲烷纳入能源转型计划,市场仍在持续扩张。欧洲市场受益于完善的天然气供应系统、明确的永续性认证流程以及在工业和交通运输等领域的大规模应用。公用事业公司、大型能源企业和农业合作社之间的合作持续推动市场发展。此外,欧洲对氧化亚氮排放的关注、减少对外部天然气依赖的目标以及对循环经济的大力支持,共同使欧洲在全球生物甲烷需求中处于领先地位,使其成为市场的重要参与企业,儘管略逊于亚太地区和其他地区。
方法论详情:
我们对包括主要行业相关人员、主题专家、主要市场参与企业的高管和行业顾问在内的各领域专家进行了深入访谈,以收集和检验关键的定性和定量信息,从而评估未来的市场前景。
生物甲烷市场由少数几家地域分布广泛的主要参与企业主导,包括壳牌生物燃气公司(英国)、液化空气集团(法国)、英国石油公司(英国)、Gasum有限公司(英国)、OPAL燃料公司(美国)、Waga能源公司(法国)、Vanguard可再生能源公司(美国)、哥德堡能源公司(瑞典)、WELTEC生物动力参与企业(德国)、PlanET生物燃气集团(德国)、ETW能源技术有限公司(德国)、清洁能源燃料公司(美国)、EQTEC公司(爱尔兰)和GENeco公司(英国)。
研究范围:
本报告按规模、应用和燃料类型对电子燃料市场进行定义、描述和预测。该报告还提供了详细的市场定性和定量分析,全面回顾了关键市场驱动因素、限制因素、机会和挑战,并涵盖了市场的各个重要方面,包括竞争格局分析、市场动态、基于价值的市场估算以及生物甲烷市场的未来趋势。
购买本报告的主要益处
- 沼气市场的主要驱动力是全球向低碳绿色能源系统转型,尤其是在难以完全淘汰化石天然气使用的地区。人们对气候变迁、能源安全和甲烷排放日益增长的担忧,正在加速生物甲烷作为可再生、低碳天然气替代品的应用,使其普及率不断提高。生物甲烷可利用多种废弃物生产,包括农业残余物、畜禽粪便和都市固体垃圾,使其适用于发电等应用,并有助于实现循环经济目标。生物甲烷与现有天然气基础设施完全相容,因此可轻鬆应用于交通运输、工业供热、发电和併网等各个领域。日益严格的排放法规和相关政府政策,使得对生物甲烷计划的投资越来越普遍。同时,厌氧消化、气体纯化和数位化工厂优化等方面的技术进步,也对提高生物甲烷製程的效率和扩充性产生了正面影响。除了上述因素外,企业永续性措施正成为全球能源转型为低碳环境的重要驱动力,而生物甲烷正日益被认为是关键因素。
- 产品开发与创新:生物甲烷产业正透过产品和製程创新不断进步,旨在提高生产效率、扩充性和环境绩效。该领域最重要的进展之一是多家公司开发新型厌氧消化系统。这些系统具有更高的甲烷产量、更灵活的原料柔软性和更短的停留时间。此外,膜分离、变压式吸附和低温净化等气体纯化技术均能达到甚至超越生物甲烷品质标准,同时也能降低能耗。市场趋势正推动小规模、灵活的生物甲烷装置取代大型集中式基础设施,这些装置选址更靠近废弃物源,从而避免了长途运输带来的高成本。自动化和数位监控系统的整合已开始实施,支援即时製程优化、预测性维护和排放追踪。此外,沼渣管理、营养物回收和生物甲烷生产技术的进步也有助于提高资源利用效率。研究和实验不断探索共消化製程和先进的废弃物流利用,有效增加了原料多样性,并扩大了生物甲烷对循环低碳能源系统的贡献。
- 市场发展—2025年9月,赫伯罗特与壳牌生物燃气公司签署了一项多年期协议,壳牌生物燃气公司将向赫伯罗特供应液化生物甲烷,以支持赫伯罗特的脱碳计画。这项始于2023年的合作将使赫伯罗特的LNG双燃料船舶无需任何机械改造即可燃烧这种环保船用燃料。壳牌已在全球22个加油站安装了液化生物甲烷供应点,进一步提高了可再生燃料的供应量。经ISCC EU等认证机构认证的生物燃气具有很高的生命週期温室气体减排潜力,不仅有助于赫伯罗特船队营运的排放,也有助于其客户供应链的减排。
- 市场多元化:2025年5月,道达尔能源公司签署股份购买协议(SPA),将其持有的波兰领先的沼气生产商波兰生物燃气集团(Polska Grupa Biogazowa,简称PGB)一半的股份出售给HitecVision公司。 PGB目前拥有20座生物甲烷工厂,总产能超过450吉瓦时(GWh),并计画在2030年达到2太瓦时(TWh)的产能。此次合作不仅加速了PGB进军生物甲烷业务的步伐,也符合道达尔能源公司透过资产剥离来优化其可再生能源投资组合的策略。同时,HitecVision公司也藉此机会为推动波兰仍在发展中的沼气市场成长奠定了坚实的基础。
目录
第一章 引言
第二章执行摘要
第三章重要考察
第四章 市场概览
- 市场动态
- 相互关联的市场与跨产业机会
- 1/2/3级参与企业的策略倡议
第五章 产业趋势
- 波特五力分析
- 宏观经济展望
- 供应链分析
- 生态系分析
- 贸易分析
- 案例研究分析
- 2025-2026 年主要会议和活动
- 定价分析
- 影响客户业务的趋势/颠覆性因素
- 投资和资金筹措方案
- 2025年美国关税对生物甲烷市场的影响
第六章:技术进步、人工智慧的影响、专利、创新与未来应用
- 关键新兴技术
- 互补技术
- 邻近技术
- 技术/产品蓝图
- 专利分析
- 未来应用
- 人工智慧/生成式人工智慧对生物甲烷市场的影响
第七章 监理环境与永续性倡议
- 地方法规和合规性
- 对永续性的承诺
- 监理政策如何影响永续性倡议
第八章:顾客状况与购买行为
- 决策流程
- 采购过程中的关键相关人员及其评估标准
- 招募障碍和内部挑战
- 来自各个最终用户/最终用途行业的未满足需求
- 市场盈利
第九章 生物甲烷市场的经销形式
- 管道注入
- 压缩天然气
- 液化天然气
第十章 生物甲烷市场的终端使用者类型
- 产业
- 商业
- 住宅
第十一章 生物甲烷市场(按原始资料划分)
- 能源作物
- 农业残余物和动物粪便
- 都市垃圾
- 其他成分
第十二章 生物甲烷市场(依生产製程划分)
- 厌氧消化和发酵
- 热气化
- 其他的
第十三章 依最终用途分類的生物甲烷市场
- 运输
- 发电
- 产业
第十四章 各地区生物甲烷市场
- 北美洲
- 我们
- 加拿大
- 墨西哥
- 欧洲
- 德国
- 英国
- 法国
- 丹麦
- 义大利
- 瑞典
- 其他的
- 亚太地区
- 中国
- 印度
- 其他的
- 其他地区
- 中东和非洲
- 南美洲
第十五章 竞争格局
- 主要参与企业的竞争策略/优势,2022-2025 年
- 2020-2024年收入分析
- 2024年市占率分析
- 估值和财务指标
- 品牌对比
- 公司估值矩阵:主要参与企业,2024 年
- 公司估值矩阵:Start-Ups/中小企业,2024 年
- 竞争场景
第十六章:公司简介
- 主要参与企业
- SHELL
- GASUM LTD
- AIR LIQUIDE
- BP PLC
- VERBIO SE
- TOTALENERGIES
- OPAL FUELS
- CHEVRON CORPORATION
- E.ON SE
- ENGIE
- VEOLIA
- KINDER MORGAN
- AMERESCO
- CLEAN ENERGY FUELS
- GOTEBORG ENERGI
- 其他公司
- ENVITEC BIOGAS AG
- RAIZEN
- VANGUARD RENEWABLES
- ANAERGIA
- WAGA ENERGY
- WELTEC BIPOWER GMBH
- ETW ENERGIETECHNIK GMBH
- GENECO
- PLANET BIOGAS GROUP
- EQTEC PLC AND GROUP
第十七章调查方法
第十八章附录
The biomethane market is estimated to reach USD 56.64 billion by 2030 from USD 16.50 billion in 2025, at a CAGR of 28.0% during the forecast period. The biomethane market is being propelled by the rising focus on circular economy practices that transform organic waste into energy resources that are worth. The mounting limitations on landfills and more stringent regulations on wastewater treatment are leading cities and factories to biomethane as an alternative.
| Scope of the Report | |
|---|---|
| Years Considered for the Study | 2020-2030 |
| Base Year | 2024 |
| Forecast Period | 2025-2030 |
| Units Considered | Value (USD Million/Billion); Volume (BCM) |
| Segments | by Feedstock, Production Process, End-use, Region |
| Regions covered | Europe, Asia Pacific, North America, South America, Rest of the World |
Price swings in natural gas are making it necessary for energy consumers to explore the domestic renewable gas market as a supplier. Advances in upgrading, liquefaction, and digital plant optimization technologies are already leading to a better operational efficiency and reliability. Meanwhile, there are more and more gas grid interconnections and certification schemes for renewable gas that are making the market more transparent and tradable, thus facilitating the wider commercial use of biomethane.
"By production process, thermal gasification is projected to be the fastest-growing segment of the biomethane market during the forecast period."
The thermal gasification method, as a production process, is expected to occupy the fastest position among the biomethane segments during the coming years because of its capability to turn various kinds of dry and lignocellulosic feedstocks into renewable gas. The main difference from biological processes is that thermal gasification can easily process forestry residues, industrial waste, and other materials that are hard to digest, thus widening the overall biomethane feedstock base. The combination of increasing interest in advanced waste-to-energy systems and stricter regulations on landfilling is a major factor behind the rapid adoption of the technique. Innovations in technology are increasing the yield, quality of syngas, and interlinkage of the processes, thus minimizing risks to the operation. Moreover, the heightened investment in low-carbon fuels and the introduction of policy frameworks that favor advanced renewable gas technologies are improving the commercial viability of thermal gasification projects.
"The industrial segment is expected to remain the fastest segment by application"
The industrial segment is projected to be the largest application area in the biomethane market owing to the prevailing trend of the adoption of cost-effective decarbonization measures in the energy consuming industries. A number of industrial activities are very much dependent on natural gas for their operations that require high-temperature heating, thus making electrification either technically complicated or too expensive for the near future. Biomethane is a direct alternative that can be integrated easily and that helps the industrial sector to cut down their Scope 1 emissions without making any significant changes to existing machinery or facilities. Regulatory compliance, taxes on carbon emissions and compulsory emissions reporting are among the factors that have been speeding up the trend of biomethane usage. Apart from that, contracts for the long-term supply of biomethane have made it possible for industries to have a stable price during the ups and downs of the fossil fuel market, whereas the corporate net-zero pledges and sustainability targets are pushing the industries to consider renewable gas as a feasible option for decarbonization through which they could achieve their targets.
"By region, Europe is expected to be the second-largest region in the biomethane market during the forecast period."
By region, the biomethane industry is forecasted to have Europe as the second-largest market, thanks to its developed renewable gas ecosystem and robust and favorable policies. Some European countries have already achieved advanced deployment of the technology but still, the expansion continues through replacement of old technology, upgrading of capacities, and integration of biomethane into the energy transition plans. European market is supported by a good natural gas supply system, well-defined sustainability certification process, and large-scale use in sectors such as industrial, and transportation. The collaboration between the power companies, big energy firms, and farmers' cooperatives is still driving the market. Besides, Europe's worry about nitrous oxide emissions, its goal to be less dependent on gas from outside, and its being more supportive of the recycling economy are also factors that put the region at the forefront when it comes to global biomethane demand and thus, Europe's being a major player in the market despite it being a bit late in the game compared to the Asia-Pacific and other regions.
Breakdown of Primaries:
In-depth interviews have been conducted with various key industry participants, subject-matter experts, C-level executives of key market players, and industry consultants, among other experts, to obtain and verify critical qualitative and quantitative information and assess future market prospects. The distribution of primary interviews is as follows:
By Company Type: Tier 1- 65%, Tier 2- 24%, and Tier 3- 11%
By Designation: C-Level Executives - 30%, Managers- 25%, and Others- 45%
By Region: North America- 20%, Europe- 40%, Asia Pacific- 30%, and RoW- 10%
Note: Others include product engineers, product specialists, and engineering leads.
Note: The tiers of the companies are defined based on their total revenues as of 2023. Tier 1: > USD 1 billion, Tier 2: From USD 500 million to USD 1 billion, and Tier 3: < USD 500 million
The biomethane market is dominated by a few major players that have a wide regional presence. The leading players in the biomethane market are Shell Biogas (United Kingdom), Air Liquide (France), BP p.l.c. (UK), Gasum Ltd (Finland), OPAL Fuels (US), Waga Energy (France), Vanguard Renewables (United States), Gothenburg Energy (Sweden), WELTEC BIOPOWER GmbH (Germany), PlanET Biogas Group (Germany), ETW Energietechnik GmbH (Germany), Clean Energy Fuels (United States), EQTEC PLC (Ireland), and GENeco (UK), among others.
Study Coverage:
The report defines, describes, and forecasts the e-fuel market by size, application, and fuel type. It also offers a detailed qualitative and quantitative analysis of the market. The report provides a comprehensive review of the major market drivers, restraints, opportunities, and challenges. It also covers various important aspects of the market. These include an analysis of the competitive landscape, market dynamics, market estimates in terms of value, and future trends in the biomethane market.
Key Benefits of Buying the Report
- The biogas market is mainly influenced by the global shift to decarbonized and eco-friendly energy systems, especially in areas where it is difficult to eliminate the use of fossil gas completely. The increasing worries about methane getting emitted, along with climate change, and energy security, are fast-tracking the biomethane usage as a renewable, low-carbon gas alternative to natural gas and hence, it is being adopted more and more. Biomethane is being generated from various waste streams including agricultural residues, animal dung, and municipal waste, thereby not only power generation and more but also being able to achieve the circular economy goals. Its complete compatibility with the existing gas infrastructure allows it to be used effortlessly in all the mentioned areas viz. transport, industrial heating, power generation, and grid injection. The stricter emission regulations and other related government policies, have led to a situation where investment in biomethane projects is becoming more and more common. At the same time, the advancements in the technologies used for anaerobic digestion, gas upgrading, and digital plant optimization are having a positive impact on the efficiency and scalability of the process. Alongside the above-mentioned factors, the corporate sustainability commitments are becoming a major driving force behind the global energy transition to a low carbon scenario, and thus, biomethane is gradually being identified as one of the key players.
- Product Development/Innovation: The biomethane industry is making strides through product and process innovations that aim to improve not only the efficiency of production but also the scalability and environmental performance. Among the most significant developments in this area are the new anaerobic digestion systems that are being created by companies. These systems are characterized by higher methane yields, greater flexibility in the types of feedstock used, and shorter retention times. Moreover, biogas upgrading technologies such as membrane separation, pressure swing adsorption, and cryogenic upgrading have all met and exceeded the quality requirements for biomethane and have done so with a lower energy footprint. The market trend is to promote the installation of small and flexible biomethane units that can take the place of big and centralized infrastructures as they come closer to waste sources and thus eliminate the long and costly transportation industry. Automation and digital monitoring system integration are already in place, providing support for the optimization of the process in real-time, maintenance based on predictions, and tracking of emissions. Furthermore, advances in digestate management, nutrient recovery, and biological methanation are also contributing to the increase in resource efficiency. Research and experimentation are continuously exploring co-digestion and the use of advanced waste streams, which are in fact increasing feedstock diversity and thus the contribution of biomethane to circular and low-carbon energy systems.
- Market Development: In September 2025, Hapag-Lloyd and Shell Biogas signed a multi-year deal for liquefied biomethane delivery to support the former's decarbonization programme. The coalition between the two companies, which started in 2023, allows Hapag-Lloyd's LNG dual-fuelled ships, to burn the eco-friendly marine fuel without the need for any modification of their machinery. Shell has already set up liquefied biomethane supply points at 22 bunkering places across the globe, thereby making the renewable fuel even more available. The biogas certified by ISCC EU and the like provides extensive lifecycle GHG reductions which enhance the reduction of emissions in not just fleet operations but also in customer supply chains.
- Market Diversification: TotalEnergies, in May 2025, made a deal through an SPA to divest half of the shares in Polska Grupa Biogazowa (PGB) which is the main biogas producer in Poland, to HitecVision. PGB has already acquired 20 units whose combined biomethane capacity amounts to more than 450 GWh and is also looking to reach 2 TWh by 2030. The alliance not just hastens PGB's foray into biomethane but also goes hand in hand with TotalEnergies' farmdown strategy to improve the renewable investment portfolio, while HitecVision seizes the opportunity of having a solid platform for driving growth in the biogas market in Poland which is still in the developing phase.
- Competitive Assessment: Assessment of rankings of some of the key players, including of TotalEnergies (France), Veolia (France), Chevron Corporation (United States), Shell Biogas (United Kingdom), Air Liquide (France), BP p.l.c. (United Kingdom), Raizen (Brazil), Gasum Ltd (Finland), Anaergia (Canada), EnviTec Biogas AG (Germany), Kinder Morgan (United States), Ameresco (United States), ENGIE (France), E.ON SE (Germany), Verbio SE (Germany), OPAL Fuels (United States) among others.
TABLE OF CONTENTS
1 INTRODUCTION
- 1.1 STUDY OBJECTIVES
- 1.2 MARKET DEFINITION
- 1.3 MARKET SCOPE
- 1.3.1 MARKET SEGMENTATION AND REGIONAL SCOPE
- 1.3.2 INCLUSIONS AND EXCLUSIONS
- 1.3.3 YEARS CONSIDERED
- 1.4 CURRENCY CONSIDERED
- 1.5 UNITS CONSIDERED
- 1.6 STAKEHOLDERS
- 1.7 SUMMARY OF CHANGES
2 EXECUTIVE SUMMARY
- 2.1 MARKET HIGHLIGHTS AND KEY INSIGHTS
- 2.2 KEY MARKET PARTICIPANTS: MAPPING OF STRATEGIC DEVELOPMENTS
- 2.3 DISRUPTIVE TRENDS IN BIOMETHANE MARKET
- 2.4 HIGH-GROWTH SEGMENTS
- 2.5 REGIONAL SNAPSHOT: MARKET SIZE, GROWTH RATE, AND FORECAST
3 PREMIUM INSIGHTS
- 3.1 ATTRACTIVE OPPORTUNITIES FOR PLAYERS IN BIOMETHANE MARKET
- 3.2 BIOMETHANE MARKET, BY REGION
- 3.3 BIOMETHANE MARKET, BY FEEDSTOCK TYPE
- 3.4 BIOMETHANE MARKET, BY PRODUCTION PROCESS
- 3.5 BIOMETHANE MARKET, BY END-USE APPLICATION
- 3.6 BIOMETHANE MARKET IN EUROPE, BY END-USE APPLICATION AND COUNTRY
4 MARKET OVERVIEW
- 4.1 INTRODUCTION
- 4.2 MARKET DYNAMICS
- 4.2.1 DRIVERS
- 4.2.1.1 Turning organic waste into low-cost renewable gas
- 4.2.1.2 Increasing biomethane output through advanced processing technologies
- 4.2.1.3 Government support through binding policy, incentives, and market integration
- 4.2.2 RESTRAINTS
- 4.2.2.1 Limited sustainable feedstock availability
- 4.2.2.2 Competition from alternative low-carbon and renewable gases
- 4.2.3 OPPORTUNITIES
- 4.2.3.1 Rapid scale-up via grid injection & national targets
- 4.2.3.2 Growth in heavy-duty transport & CNG/LNG/LBG market (road, shipping, buses)
- 4.2.4 CHALLENGES
- 4.2.4.1 High CAPEX/uncertain project economics
- 4.2.4.2 Gas network and injection constraints
- 4.2.1 DRIVERS
- 4.3 INTERCONNECTED MARKETS AND CROSS-SECTOR OPPORTUNITIES
- 4.3.1 INTERCONNECTED MARKETS
- 4.3.2 CROSS-SECTOR OPPORTUNITIES
- 4.4 STRATEGIC MOVES BY TIER 1/2/3 PLAYERS
5 INDUSTRY TRENDS
- 5.1 PORTER'S FIVE FORCES ANALYSIS
- 5.1.1 THREAT OF SUBSTITUTES
- 5.1.2 BARGAINING POWER OF SUPPLIERS
- 5.1.3 BARGAINING POWER OF BUYERS
- 5.1.4 THREAT OF NEW ENTRANTS
- 5.1.5 INTENSITY OF COMPETITIVE RIVALRY
- 5.2 MACROECONOMIC OUTLOOK
- 5.2.1 INTRODUCTION
- 5.2.2 PUBLIC CLEAN ENERGY SPENDING
- 5.2.3 ENERGY PRICE VOLATILITY
- 5.2.4 WASTE MANAGEMENT COSTS
- 5.2.5 AGRICULTURAL ECONOMICS
- 5.3 SUPPLY CHAIN ANALYSIS
- 5.4 ECOSYSTEM ANALYSIS
- 5.5 TRADE ANALYSIS
- 5.5.1 EXPORT SCENARIO (HS CODE 271111)
- 5.5.2 IMPORT SCENARIO (HS CODE 271111)
- 5.6 CASE STUDY ANALYSIS
- 5.6.1 BIOMETHANE PRODUCTION AT STEUBEN COUNTY LANDFILL (WAGA ENERGY)
- 5.6.2 VANGUARD RENEWABLES & ASTRAZENECA RNG AGREEMENT
- 5.6.3 PERDUE FARMS BIOMETHANE FROM WASTEWATER (GREENGAS USA)
- 5.7 KEY CONFERENCES AND EVENTS, 2025-2026
- 5.8 PRICING ANALYSIS
- 5.8.1 INDICATIVE PRICING OF BIOMETHANE MARKET, BY END-USE APPLICATION, 2024
- 5.8.2 AVERAGE SELLING PRICE TREND OF BIOMETHANE, BY REGION, 2020-2024
- 5.9 TRENDS/DISRUPTIONS IMPACTING CUSTOMERS' BUSINESSES
- 5.10 INVESTMENT AND FUNDING SCENARIO
- 5.11 IMPACT OF 2025 US TARIFFS-BIOMETHANE MARKET
- 5.11.1 INTRODUCTION
- 5.11.2 KEY TARIFF RATES
- 5.11.3 PRICE IMPACT ANALYSIS
- 5.11.4 IMPACT ON COUNTRIES/REGIONS
- 5.11.4.1 US
- 5.11.4.2 Europe
- 5.11.4.3 Asia Pacific
- 5.11.5 IMPACT ON END-USER INDUSTRIES
6 TECHNOLOGICAL ADVANCEMENTS, AI-DRIVEN IMPACT, PATENTS, INNOVATIONS, AND FUTURE APPLICATIONS
- 6.1 KEY EMERGING TECHNOLOGIES
- 6.1.1 MEMBRANE SEPARATION TECHNOLOGY
- 6.1.2 CRYOGENIC SEPARATION TECHNOLOGY
- 6.1.3 FEEDSTOCK PRE-TREATMENT TECHNOLOGIES
- 6.2 COMPLEMENTARY TECHNOLOGIES
- 6.2.1 PROCESS MONITORING & CONTROL SYSTEMS
- 6.2.2 DIGESTATE TREATMENT TECHNOLOGIES
- 6.3 ADJACENT TECHNOLOGIES
- 6.3.1 BIOGAS-TO-LIQUID TECHNOLOGIES
- 6.3.2 CARBON CAPTURE & UTILIZATION/STORAGE (CCUS)
- 6.4 TECHNOLOGY/PRODUCT ROADMAP
- 6.4.1 SHORT-TERM (2025-2027) | COMMERCIAL SCALE-UP AND MARKET CONSOLIDATION
- 6.4.2 MID-TERM (2028-2030) | SYSTEM INTEGRATION & COST OPTIMIZATION PHASE
- 6.4.3 LONG-TERM (2030-2035+) | NET-ZERO ALIGNMENT & MARKET MATURITY PHASE
- 6.5 PATENT ANALYSIS
- 6.6 FUTURE APPLICATIONS
- 6.7 IMPACT OF AI/GEN AI ON BIOMETHANE MARKET
- 6.7.1 TOP USE CASES AND MARKET POTENTIAL
- 6.7.2 BEST PRACTICES FOLLOWED BY OEMS IN BIOMETHANE MARKET
- 6.7.3 CASE STUDIES OF AI IMPLEMENTATION IN BIOMETHANE MARKET
- 6.7.4 INTERCONNECTED ECOSYSTEMS AND IMPACT ON MARKET PLAYERS
7 REGULATORY LANDSCAPE AND SUSTAINABILITY INITIATIVES
- 7.1 REGIONAL REGULATIONS AND COMPLIANCE
- 7.1.1 REGULATORY BODIES, GOVERNMENT AGENCIES, AND OTHER ORGANIZATIONS
- 7.1.2 INDUSTRY STANDARDS
- 7.2 SUSTAINABILITY INITIATIVES
- 7.2.1 WASTE VALORIZATION AND CIRCULAR FEEDSTOCK UTILIZATION
- 7.2.2 LOW-EMISSION PRODUCTION, UPGRADING EFFICIENCY, AND LIFECYCLE OPTIMIZATION
- 7.3 IMPACT OF REGULATORY POLICIES ON SUSTAINABILITY INITIATIVES
8 CUSTOMER LANDSCAPE & BUYING BEHAVIOR
- 8.1 DECISION-MAKING PROCESS
- 8.2 KEY STAKEHOLDERS INVOLVED IN BUYING PROCESS AND THEIR EVALUATION CRITERIA
- 8.2.1 KEY STAKEHOLDERS IN BUYING PROCESS
- 8.2.2 BUYING CRITERIA
- 8.3 ADOPTION BARRIERS AND INTERNAL CHALLENGES
- 8.4 UNMET NEEDS FROM VARIOUS END-USER/END-USE INDUSTRIES
- 8.5 MARKET PROFITABILITY
9 DISTRIBUTION MODES IN BIOMETHANE MARKET
- 9.1 INTRODUCTION
- 9.2 PIPELINE INJECTION
- 9.3 COMPRESSED NATURAL GAS
- 9.4 LIQUEFIED NATURAL GAS
10 END-USER TYPES IN BIOMETHANE MARKET
- 10.1 INTRODUCTION
- 10.2 INDUSTRIAL
- 10.3 COMMERCIAL
- 10.4 RESIDENTIAL
11 BIOMETHANE MARKET, BY FEEDSTOCK
- 11.1 INTRODUCTION
- 11.2 ENERGY CROPS
- 11.2.1 ENERGY CROPS PROVIDE FEEDSTOCK RELIABILITY IN BIOMETHANE VALUE CHAIN
- 11.3 AGRICULTURAL RESIDUES & ANIMAL MANURE
- 11.3.1 AGRICULTURAL RESIDUES & ANIMAL MANURE ANCHOR SCALABLE AND LOW-RISK BIOMETHANE SUPPLY
- 11.4 MUNICIPAL WASTE
- 11.4.1 MUNICIPAL WASTE EMERGES AS PRIMARY ENGINE OF SCALABLE, URBAN BIOMETHANE DEPLOYMENT
- 11.5 OTHER FEEDSTOCKS
- 11.5.1 INDUSTRIAL ORGANIC WASTE
- 11.5.2 SEWAGE SLUDGE
- 11.5.3 WASTEWATER
12 BIOMETHANE MARKET, BY PRODUCTION PROCESS
- 12.1 INTRODUCTION
- 12.2 ANAEROBIC DIGESTION & FERMENTATION
- 12.2.1 ANAEROBIC DIGESTION AND FERMENTATION FORM THE BACKBONE OF GLOBAL BIOMETHANE PRODUCTION
- 12.3 THERMAL GASIFICATION
- 12.3.1 THERMAL GASIFICATION EXPANDS BIOMETHANE PRODUCTION BEYOND BIOLOGICAL PATHWAYS
- 12.4 OTHER PRODUCTION PROCESSES
13 BIOMETHANE MARKET, BY END-USE APPLICATION
- 13.1 INTRODUCTION
- 13.2 TRANSPORTATION
- 13.2.1 TRANSPORT APPLICATIONS POSITION BIOMETHANE AS A LEADING DROP-IN DECARBONIZATION FUEL FOR MOBILITY
- 13.3 POWER GENERATION
- 13.3.1 BIOMETHANE STRENGTHENS THE POWER GENERATION MIX AS A DISPATCHABLE, LOW-CARBON ALTERNATIVE TO NATURAL GAS
- 13.4 INDUSTRIAL
- 13.4.1 INDUSTRIAL ENERGY TRANSITION INITIATIVES AND GOVERNMENT STRATEGIES TO SUPPORT GROWTH
14 BIOMETHANE MARKET, BY REGION
- 14.1 INTRODUCTION
- 14.2 NORTH AMERICA
- 14.2.1 US
- 14.2.1.1 US biomethane market is policy-driven and led by transportation demand
- 14.2.2 CANADA
- 14.2.2.1 Canada is supporting indigenous-led clean energy projects to advance energy independence and emissions reduction
- 14.2.3 MEXICO
- 14.2.3.1 Promising opportunities with strong potential from abundant waste and biomass resources
- 14.2.1 US
- 14.3 EUROPE
- 14.3.1 GERMANY
- 14.3.1.1 Germany's large-scale grid injection and strong policy support ensure market leadership
- 14.3.2 UK
- 14.3.2.1 Despite strong decarbonization potential, growth remains constrained by policy uncertainty and restrictive feedstock regulations
- 14.3.3 FRANCE
- 14.3.3.1 Strong targets and binding supplier obligations make France Europe's fastest-growing biomethane market
- 14.3.4 DENMARK
- 14.3.4.1 Denmark aims to replace fossil gas fully, but faces slowed growth after subsidy withdrawal
- 14.3.5 ITALY
- 14.3.5.1 Italy is scaling biomethane through strong policy funding, agricultural integration, and transport readiness
- 14.3.6 SWEDEN
- 14.3.6.1 High CO2 taxes, long-term policy support, and significant reliance on imported biomethane to propel growth
- 14.3.7 REST OF EUROPE
- 14.3.1 GERMANY
- 14.4 ASIA PACIFIC
- 14.4.1 CHINA
- 14.4.1.1 China is transitioning biomethane from waste-based power use to an industry-driven decarbonization fuel led by state utilities
- 14.4.2 INDIA
- 14.4.2.1 Strong government support, CBG blending mandates, and waste-to-energy policies accelerate biomethane adoption
- 14.4.3 REST OF ASIA PACIFIC
- 14.4.1 CHINA
- 14.5 REST OF THE WORLD
- 14.5.1 MIDDLE EAST & AFRICA
- 14.5.1.1 Pipeline of pilot and commercial projects is projected to offer sustained growth in MEA markets
- 14.5.2 SOUTH AMERICA
- 14.5.2.1 Promising initiatives in Brazil, Chile, and Colombia to spearhead growth of biomethane usage
- 14.5.1 MIDDLE EAST & AFRICA
15 COMPETITIVE LANDSCAPE
- 15.1 INTRODUCTION
- 15.2 KEY PLAYER COMPETITIVE STRATEGIES/RIGHT TO WIN, 2022-2025
- 15.3 REVENUE ANALYSIS, 2020-2024
- 15.4 MARKET SHARE ANALYSIS, 2024
- 15.5 COMPANY VALUATION AND FINANCIAL METRICS
- 15.6 BRAND COMPARISON
- 15.7 COMPANY EVALUATION MATRIX: KEY PLAYERS, 2024
- 15.7.1 STARS
- 15.7.2 EMERGING LEADERS
- 15.7.3 PERVASIVE PLAYERS
- 15.7.4 PARTICIPANTS
- 15.7.5 COMPANY FOOTPRINT, KEY PLAYERS, 2024
- 15.7.5.1 Company footprint
- 15.7.5.2 Region footprint
- 15.7.5.3 Feedstock footprint
- 15.7.5.4 Production process footprint
- 15.7.5.5 End-use application footprint
- 15.8 COMPANY EVALUATION MATRIX: STARTUPS/SMES, 2024
- 15.8.1 PROGRESSIVE COMPANIES
- 15.8.2 RESPONSIVE COMPANIES
- 15.8.3 DYNAMIC COMPANIES
- 15.8.4 STARTING BLOCKS
- 15.8.5 COMPETITIVE BENCHMARKING: STARTUPS/SMES, 2024
- 15.8.5.1 Detailed list of key startups/SMEs
- 15.8.5.2 Competitive benchmarking of key startups/SMEs
- 15.9 COMPETITIVE SCENARIO
- 15.9.1 DEALS
- 15.9.2 EXPANSIONS
- 15.9.3 OTHER DEVELOPMENTS
16 COMPANY PROFILES
- 16.1 KEY PLAYERS
- 16.1.1 SHELL
- 16.1.1.1 Business overview
- 16.1.1.2 Products/Solutions/Services offered
- 16.1.1.3 Recent developments
- 16.1.1.3.1 Deals
- 16.1.1.4 MnM view
- 16.1.1.4.1 Key strengths/Right to win
- 16.1.1.4.2 Strategic choices
- 16.1.1.4.3 Weaknesses/Competitive threats
- 16.1.2 GASUM LTD
- 16.1.2.1 Business overview
- 16.1.2.2 Products/Solutions/Services offered
- 16.1.2.3 Recent developments
- 16.1.2.3.1 Deals
- 16.1.2.3.2 Expansions
- 16.1.2.3.3 Other developments
- 16.1.2.4 MnM view
- 16.1.2.4.1 Key strengths/Right to win
- 16.1.2.4.2 Strategic choices
- 16.1.2.4.3 Weaknesses/Competitive threats
- 16.1.3 AIR LIQUIDE
- 16.1.3.1 Business overview
- 16.1.3.2 Products/Solutions/Services offered
- 16.1.3.3 Recent developments
- 16.1.3.3.1 Expansions
- 16.1.3.4 MnM view
- 16.1.3.4.1 Key strengths/Right to win
- 16.1.3.4.2 Strategic choices
- 16.1.3.4.3 Weaknesses/Competitive threats
- 16.1.4 BP P.L.C.
- 16.1.4.1 Business overview
- 16.1.4.2 Products/Solutions/Services offered
- 16.1.4.3 Recent developments
- 16.1.4.3.1 Deals
- 16.1.4.3.2 Expansions
- 16.1.4.4 MnM view
- 16.1.4.4.1 Key strengths/Right to win
- 16.1.4.4.2 Strategic choices
- 16.1.4.4.3 Weaknesses/Competitive threats
- 16.1.5 VERBIO SE
- 16.1.5.1 Business overview
- 16.1.5.2 Products/Solutions/Services offered
- 16.1.5.3 Recent developments
- 16.1.5.3.1 Deals
- 16.1.5.3.2 Expansions
- 16.1.5.4 MnM view
- 16.1.5.4.1 Key strengths/Right to win
- 16.1.5.4.2 Strategic choices
- 16.1.5.4.3 Weaknesses/Competitive threats
- 16.1.6 TOTALENERGIES
- 16.1.6.1 Business overview
- 16.1.6.2 Products/Solutions/Services offered
- 16.1.6.3 Recent developments
- 16.1.6.3.1 Deals
- 16.1.6.3.2 Expansions
- 16.1.6.4 MnM view
- 16.1.6.4.1 Key strengths/Right to win
- 16.1.6.4.2 Strategic choices
- 16.1.6.4.3 Weaknesses/Competitive threats
- 16.1.7 OPAL FUELS
- 16.1.7.1 Business overview
- 16.1.7.2 Products/Solutions/Services offered
- 16.1.7.3 Recent developments
- 16.1.7.3.1 Deals
- 16.1.7.3.2 Expansions
- 16.1.7.3.3 Other developments
- 16.1.8 CHEVRON CORPORATION
- 16.1.8.1 Business overview
- 16.1.8.2 Products/Solutions/Services offered
- 16.1.8.3 Recent developments
- 16.1.8.3.1 Deals
- 16.1.8.3.2 Expansions
- 16.1.9 E.ON SE
- 16.1.9.1 Business overview
- 16.1.9.2 Products/Solutions/Services offered
- 16.1.10 ENGIE
- 16.1.10.1 Business overview
- 16.1.10.2 Products/Solutions/Services offered
- 16.1.10.3 Recent developments
- 16.1.10.3.1 Deals
- 16.1.10.3.2 Expansions
- 16.1.10.3.3 Other developments
- 16.1.11 VEOLIA
- 16.1.11.1 Business overview
- 16.1.11.2 Products/Solutions/Services offered
- 16.1.11.3 Recent developments
- 16.1.11.3.1 Deals
- 16.1.11.3.2 Other developments
- 16.1.12 KINDER MORGAN
- 16.1.12.1 Business overview
- 16.1.12.2 Products/Solutions/Services offered
- 16.1.12.3 Recent developments
- 16.1.12.3.1 Deals
- 16.1.13 AMERESCO
- 16.1.13.1 Business overview
- 16.1.13.2 Products/Solutions/Services offered
- 16.1.13.3 Recent developments
- 16.1.13.3.1 Deals
- 16.1.13.3.2 Expansions
- 16.1.13.3.3 Other developments
- 16.1.14 CLEAN ENERGY FUELS
- 16.1.14.1 Business overview
- 16.1.14.2 Products/Solutions/Services offered
- 16.1.14.3 Recent developments
- 16.1.14.3.1 Deals
- 16.1.14.3.2 Expansions
- 16.1.15 GOTEBORG ENERGI
- 16.1.15.1 Business overview
- 16.1.15.2 Products/Solutions/Services offered
- 16.1.15.3 Recent developments
- 16.1.15.3.1 Expansions
- 16.1.1 SHELL
- 16.2 OTHER PLAYERS
- 16.2.1 ENVITEC BIOGAS AG
- 16.2.2 RAIZEN
- 16.2.3 VANGUARD RENEWABLES
- 16.2.4 ANAERGIA
- 16.2.5 WAGA ENERGY
- 16.2.6 WELTEC BIPOWER GMBH
- 16.2.7 ETW ENERGIETECHNIK GMBH
- 16.2.8 GENECO
- 16.2.9 PLANET BIOGAS GROUP
- 16.2.10 EQTEC PLC AND GROUP
17 RESEARCH METHODOLOGY
- 17.1 RESEARCH DATA
- 17.2 SECONDARY AND PRIMARY RESEARCH
- 17.2.1 SECONDARY DATA
- 17.2.1.1 List of key secondary sources
- 17.2.1.2 Key data from secondary sources
- 17.2.2 PRIMARY DATA
- 17.2.2.1 List of primary interview participants
- 17.2.2.2 Key industry insights
- 17.2.2.3 Breakdown of primaries
- 17.2.2.4 Key data from primary sources
- 17.2.1 SECONDARY DATA
- 17.3 MARKET SIZE ESTIMATION METHODOLOGY
- 17.3.1 BOTTOM-UP APPROACH
- 17.3.2 TOP-DOWN APPROACH
- 17.3.3 DEMAND-SIDE ANALYSIS
- 17.3.3.1 Demand-side assumptions
- 17.3.3.2 Demand-side calculations
- 17.3.4 SUPPLY-SIDE ANALYSIS
- 17.3.4.1 Supply-side assumptions
- 17.3.4.2 Supply-side calculations
- 17.4 GROWTH FORECASTS
- 17.5 MARKET BREAKDOWN AND DATA TRIANGULATION
- 17.6 RESEARCH LIMITATIONS
- 17.7 RISK ANALYSIS
18 APPENDIX
- 18.1 INSIGHTS FROM INDUSTRY EXPERTS
- 18.2 DISCUSSION GUIDE
- 18.3 KNOWLEDGESTORE: MARKETSANDMARKETS' SUBSCRIPTION PORTAL
- 18.4 CUSTOMIZATION OPTIONS
- 18.5 RELATED REPORTS
- 18.6 AUTHOR DETAILS
List of Tables
- TABLE 1 BIOMETHANE MARKET, BY FEEDSTOCK: INCLUSIONS AND EXCLUSIONS
- TABLE 2 BIOMETHANE MARKET, BY END-USE APPLICATION: INCLUSIONS AND EXCLUSIONS
- TABLE 3 BIOMETHANE MARKET, BY PRODUCTION PROCESS: INCLUSIONS AND EXCLUSIONS
- TABLE 4 BIOMETHANE MARKET, BY REGION: INCLUSIONS AND EXCLUSIONS
- TABLE 5 KEY MOVES AND STRATEGIC FOCUS OF TIER 1/2/3 PLAYERS
- TABLE 6 IMPACT OF PORTER'S FIVE FORCES ANALYSIS
- TABLE 7 BIOMETHANE MARKET: ROLE OF PLAYERS IN ECOSYSTEM
- TABLE 8 EXPORT DATA FOR HS CODE 271111-COMPLIANT PRODUCTS, BY COUNTRY, 2020-2024 (USD THOUSAND)
- TABLE 9 IMPORT DATA FOR HS CODE 271111-COMPLIANT PRODUCTS, BY COUNTRY, 2020-2024 (USD THOUSAND)
- TABLE 10 BIOMETHANE MARKET: LIST OF CONFERENCES AND EVENTS, 2025-2026
- TABLE 11 INDICATIVE PRICING TREND OF BIOMETHANE, BY END-USE APPLICATION, 2024 (USD/CUBIC METER)
- TABLE 12 AVERAGE SELLING PRICE TREND OF BIOMETHANE, BY REGION, 2020-2024 (USD/CUBIC METER)
- TABLE 13 US-ADJUSTED RECIPROCAL TARIFF RATES
- TABLE 14 EXPECTED CHANGE IN PRICES AND POTENTIAL IMPACT ON MARKET PLAYERS DUE TO TARIFFS
- TABLE 15 ADVANTAGES OF DIFFERENT PRETREATMENT TECHNOLOGIES
- TABLE 16 LIST OF PATENTS, BIOMETHANE MARKET, JANUARY 2024- OCTOBER 2025
- TABLE 17 RENEWABLE TRANSPORT FUELS (HEAVY-DUTY & LONG-HAUL MOBILITY)
- TABLE 18 INDUSTRIAL DECARBONIZATION (LOW-CARBON HEAT & PROCESS ENERGY)
- TABLE 19 GRID BALANCING & ENERGY STORAGE (FLEXIBLE POWER SUPPORT)
- TABLE 20 CARBON-NEGATIVE ENERGY SYSTEMS (NEGATIVE EMISSIONS PATHWAYS)
- TABLE 21 DECENTRALIZED WASTE-TO-ENERGY SYSTEMS (LOCAL ENERGY GENERATION)
- TABLE 22 TOP USE CASES AND MARKET POTENTIAL
- TABLE 23 BEST PRACTICES: COMPANIES IMPLEMENTING USE CASES
- TABLE 24 BIOMETHANE MARKET: CASE STUDIES RELATED TO GEN AI IMPLEMENTATION
- TABLE 25 INTERCONNECTED ECOSYSTEMS AND IMPACT ON BIOMETHANE MARKET PLAYERS
- TABLE 26 NORTH AMERICA: REGULATORY BODIES, GOVERNMENT AGENCIES, AND OTHER ORGANIZATIONS
- TABLE 27 EUROPE: REGULATORY BODIES, GOVERNMENT AGENCIES, AND OTHER ORGANIZATIONS
- TABLE 28 ASIA PACIFIC: REGULATORY BODIES, GOVERNMENT AGENCIES, AND OTHER ORGANIZATIONS
- TABLE 29 REST OF THE WORLD: REGULATORY BODIES, GOVERNMENT AGENCIES, AND OTHER ORGANIZATIONS
- TABLE 30 STANDARDS RELATED TO THE BIOMETHANE MARKET
- TABLE 31 BIOMETHANE MARKET: RELEVANT STANDARDS
- TABLE 32 INFLUENCE OF STAKEHOLDERS ON BUYING PROCESS, BY END USER
- TABLE 33 KEY BUYING CRITERIA, BY END-USE APPLICATION
- TABLE 34 PRIMARY DISTRIBUTION PATHWAYS FOR BIOMETHANE
- TABLE 35 BIOMETHANE FOR INDUSTRIAL END USERS
- TABLE 36 CASE STUDIES: COMMERCIAL BIOMETHANE ADOPTION
- TABLE 37 BIOMETHANE MARKET, BY FEEDSTOCK, 2020-2024 (USD MILLION)
- TABLE 38 BIOMETHANE MARKET, BY FEEDSTOCK, 2025-2030 (USD MILLION)
- TABLE 39 ENERGY CROPS: BIOMETHANE MARKET, BY REGION, 2020-2024 (USD MILLION)
- TABLE 40 ENERGY CROPS: BIOMETHANE MARKET, BY REGION, 2025-2030 (USD MILLION)
- TABLE 41 AGRICULTURAL RESIDUES & ANIMAL MANURE: BIOMETHANE MARKET, BY REGION, 2020-2024 (USD MILLION)
- TABLE 42 AGRICULTURAL RESIDUES & ANIMAL MANURE: BIOMETHANE MARKET, BY REGION, 2025-2030 (USD MILLION)
- TABLE 43 MUNICIPAL WASTE: BIOMETHANE MARKET, BY REGION, 2020-2024 (USD MILLION)
- TABLE 44 MUNICIPAL WASTE: BIOMETHANE MARKET, BY REGION, 2025-2030 (USD MILLION)
- TABLE 45 OTHER FEEDSTOCKS: BIOMETHANE MARKET, BY REGION, 2020-2024 (USD MILLION)
- TABLE 46 OTHER FEEDSTOCKS: BIOMETHANE MARKET, BY REGION, 2025-2030 (USD MILLION)
- TABLE 47 BIOMETHANE MARKET, BY PRODUCTION PROCESS, 2020-2024 (USD MILLION)
- TABLE 48 BIOMETHANE MARKET, BY PRODUCTION PROCESS, 2025-2030 (USD MILLION)
- TABLE 49 ANAEROBIC DIGESTION & FERMENTATION: BIOMETHANE MARKET, BY REGION, 2020-2024 (USD MILLION)
- TABLE 50 ANAEROBIC DIGESTION & FERMENTATION: BIOMETHANE MARKET, BY REGION, 2025-2030 (USD MILLION)
- TABLE 51 THERMAL GASIFICATION: BIOMETHANE MARKET, BY REGION, 2020-2024 (USD MILLION)
- TABLE 52 THERMAL GASIFICATION: BIOMETHANE MARKET, BY REGION, 2025-2030 (USD MILLION)
- TABLE 53 OTHER PRODUCTION PROCESSES: BIOMETHANE MARKET, BY REGION, 2020-2024 (USD MILLION)
- TABLE 54 OTHER PRODUCTION PROCESSES: BIOMETHANE MARKET, BY REGION, 2025-2030 (USD MILLION)
- TABLE 55 BIOMETHANE MARKET, BY END-USE APPLICATION, 2020-2024 (USD MILLION)
- TABLE 56 BIOMETHANE MARKET, BY END-USE APPLICATION, 2025-2030 (USD MILLION)
- TABLE 57 BIOMETHANE MARKET, BY END-USE APPLICATION, 2020-2024 (BCM)
- TABLE 58 BIOMETHANE MARKET, BY END-USE APPLICATION, 2025-2030 (BCM)
- TABLE 59 TRANSPORTATION: BIOMETHANE MARKET, BY REGION, 2020-2024 (USD MILLION)
- TABLE 60 TRANSPORTATION: BIOMETHANE MARKET, BY REGION, 2025-2030 (USD MILLION)
- TABLE 61 POWER GENERATION: BIOMETHANE MARKET, BY REGION, 2020-2024 (USD MILLION)
- TABLE 62 POWER GENERATION: BIOMETHANE MARKET, BY REGION, 2025-2030 (USD MILLION)
- TABLE 63 INDUSTRIAL: BIOMETHANE MARKET, BY REGION, 2020-2024 (USD MILLION)
- TABLE 64 INDUSTRIAL: BIOMETHANE MARKET, BY REGION, 2025-2030 (USD MILLION)
- TABLE 65 BIOMETHANE MARKET, BY REGION, 2020-2024 (USD MILLION)
- TABLE 66 BIOMETHANE MARKET, BY REGION, 2025-2030 (USD MILLION)
- TABLE 67 BIOMETHANE MARKET, BY REGION, 2020-2024 (BCM)
- TABLE 68 BIOMETHANE MARKET, BY REGION, 2025-2030 (BCM)
- TABLE 69 NORTH AMERICA: BIOMETHANE MARKET, BY FEEDSTOCK, 2020-2024 (USD MILLION)
- TABLE 70 NORTH AMERICA: BIOMETHANE MARKET, BY FEEDSTOCK, 2025-2030 (USD MILLION)
- TABLE 71 NORTH AMERICA: BIOMETHANE MARKET, BY PRODUCTION PROCESS, 2020-2024 (USD MILLION)
- TABLE 72 NORTH AMERICA: BIOMETHANE MARKET, BY PRODUCTION PROCESS, 2025-2030 (USD MILLION)
- TABLE 73 NORTH AMERICA: BIOMETHANE MARKET, BY END-USE APPLICATION, 2020-2024 (USD MILLION)
- TABLE 74 NORTH AMERICA: BIOMETHANE MARKET, BY END-USE APPLICATION, 2025-2030 (USD MILLION)
- TABLE 75 NORTH AMERICA: BIOMETHANE MARKET, BY COUNTRY, 2020-2024 (USD MILLION)
- TABLE 76 NORTH AMERICA: BIOMETHANE MARKET, BY COUNTRY, 2025-2030 (USD MILLION)
- TABLE 77 NORTH AMERICA: BIOMETHANE MARKET, BY COUNTRY, 2020-2024 (BCM)
- TABLE 78 NORTH AMERICA: BIOMETHANE MARKET, BY COUNTRY, 2025-2030 (BCM)
- TABLE 79 US: BIOMETHANE MARKET, BY END-USE APPLICATION, 2020-2024 (USD MILLION)
- TABLE 80 US: BIOMETHANE MARKET, BY END-USE APPLICATION, 2025-2030 (USD MILLION)
- TABLE 81 CANADA: BIOMETHANE MARKET, BY END-USE APPLICATION, 2020-2024 (USD MILLION)
- TABLE 82 CANADA: BIOMETHANE MARKET, BY END-USE APPLICATION, 2025-2030 (USD MILLION)
- TABLE 83 MEXICO: BIOMETHANE MARKET, BY END-USE APPLICATION, 2020-2024 (USD MILLION)
- TABLE 84 MEXICO: BIOMETHANE MARKET, BY END-USE APPLICATION, 2025-2030 (USD MILLION)
- TABLE 85 EUROPE: BIOMETHANE MARKET, BY FEEDSTOCK, 2020-2024 (USD MILLION)
- TABLE 86 EUROPE: BIOMETHANE MARKET, BY FEEDSTOCK, 2025-2030 (USD MILLION)
- TABLE 87 EUROPE: BIOMETHANE MARKET, BY PRODUCTION PROCESS, 2020-2024 (USD MILLION)
- TABLE 88 EUROPE: BIOMETHANE MARKET, BY PRODUCTION PROCESS, 2025-2030 (USD MILLION)
- TABLE 89 EUROPE: BIOMETHANE MARKET, BY END-USE APPLICATION, 2020-2024 (USD MILLION)
- TABLE 90 EUROPE: BIOMETHANE MARKET, BY END-USE APPLICATION, 2025-2030 (USD MILLION)
- TABLE 91 EUROPE: BIOMETHANE MARKET, BY COUNTRY, 2020-2024 (USD MILLION)
- TABLE 92 EUROPE: BIOMETHANE MARKET, BY COUNTRY, 2025-2030 (USD MILLION)
- TABLE 93 EUROPE: BIOMETHANE MARKET, BY COUNTRY, 2020-2024 (BCM)
- TABLE 94 EUROPE: BIOMETHANE MARKET, BY COUNTRY, 2025-2030 (BCM)
- TABLE 95 GERMANY: BIOMETHANE MARKET, BY END-USE APPLICATION, 2020-2024 (USD MILLION)
- TABLE 96 GERMANY: BIOMETHANE MARKET, BY END-USE APPLICATION, 2025-2030 (USD MILLION)
- TABLE 97 UK: BIOMETHANE MARKET, BY END-USE APPLICATION, 2020-2024 (USD MILLION)
- TABLE 98 UK: BIOMETHANE MARKET, BY END-USE APPLICATION, 2025-2030 (USD MILLION)
- TABLE 99 FRANCE: BIOMETHANE MARKET, BY END-USE APPLICATION, 2020-2024 (USD MILLION)
- TABLE 100 FRANCE: BIOMETHANE MARKET, BY END-USE APPLICATION, 2025-2030 (USD MILLION)
- TABLE 101 DENMARK: BIOMETHANE MARKET, BY END-USE APPLICATION, 2020-2024 (USD MILLION)
- TABLE 102 DENMARK: BIOMETHANE MARKET, BY END-USE APPLICATION, 2025-2030 (USD MILLION)
- TABLE 103 ITALY: BIOMETHANE MARKET, BY END-USE APPLICATION, 2020-2024 (USD MILLION)
- TABLE 104 ITALY: BIOMETHANE MARKET, BY END-USE APPLICATION, 2025-2030 (USD MILLION)
- TABLE 105 SWEDEN: BIOMETHANE MARKET, BY END-USE APPLICATION, 2020-2024 (USD MILLION)
- TABLE 106 SWEDEN: BIOMETHANE MARKET, BY END-USE APPLICATION, 2025-2030 (USD MILLION)
- TABLE 107 REST OF EUROPE: BIOMETHANE MARKET, BY END-USE APPLICATION, 2020-2024 (USD MILLION)
- TABLE 108 REST OF EUROPE: BIOMETHANE MARKET, BY END-USE APPLICATION, 2025-2030 (USD MILLION)
- TABLE 109 ASIA PACIFIC: BIOMETHANE MARKET, BY FEEDSTOCK, 2020-2024 (USD MILLION)
- TABLE 110 ASIA PACIFIC: BIOMETHANE MARKET, BY FEEDSTOCK, 2025-2030 (USD MILLION)
- TABLE 111 ASIA PACIFIC: BIOMETHANE MARKET, BY PRODUCTION PROCESS, 2020-2024 (USD MILLION)
- TABLE 112 ASIA PACIFIC: BIOMETHANE MARKET, BY PRODUCTION PROCESS, 2025-2030 (USD MILLION)
- TABLE 113 ASIA PACIFIC: BIOMETHANE MARKET, BY END-USE APPLICATION, 2020-2024 (USD MILLION)
- TABLE 114 ASIA PACIFIC: BIOMETHANE MARKET, BY END-USE APPLICATION, 2025-2030 (USD MILLION)
- TABLE 115 ASIA PACIFIC: BIOMETHANE MARKET, BY COUNTRY, 2020-2024 (USD MILLION)
- TABLE 116 ASIA PACIFIC: BIOMETHANE MARKET, BY COUNTRY, 2025-2030 (USD MILLION)
- TABLE 117 ASIA PACIFIC: BIOMETHANE MARKET, BY COUNTRY, 2020-2024 (BCM)
- TABLE 118 ASIA PACIFIC: BIOMETHANE MARKET, BY COUNTRY, 2025-2030 (BCM)
- TABLE 119 CHINA: BIOMETHANE MARKET, BY END-USE APPLICATION, 2020-2024 (USD MILLION)
- TABLE 120 CHINA: BIOMETHANE MARKET, BY END-USE APPLICATION, 2025-2030 (USD MILLION)
- TABLE 121 INDIA: BIOMETHANE MARKET, BY END-USE APPLICATION, 2020-2024 (USD MILLION)
- TABLE 122 INDIA: BIOMETHANE MARKET, BY END-USE APPLICATION, 2025-2030 (USD MILLION)
- TABLE 123 REST OF ASIA PACIFIC: BIOMETHANE MARKET, BY END-USE APPLICATION, 2020-2024 (USD MILLION)
- TABLE 124 REST OF ASIA PACIFIC: BIOMETHANE MARKET, BY END-USE APPLICATION, 2025-2030 (USD MILLION)
- TABLE 125 REST OF THE WORLD: BIOMETHANE MARKET, BY FEEDSTOCK, 2020-2024 (USD MILLION)
- TABLE 126 REST OF THE WORLD: BIOMETHANE MARKET, BY FEEDSTOCK, 2025-2030 (USD MILLION)
- TABLE 127 REST OF THE WORLD: BIOMETHANE MARKET, BY PRODUCTION PROCESS, 2020-2024 (USD MILLION)
- TABLE 128 REST OF THE WORLD: BIOMETHANE MARKET, BY PRODUCTION PROCESS, 2025-2030 (USD MILLION)
- TABLE 129 REST OF THE WORLD: BIOMETHANE MARKET, BY END-USE APPLICATION, 2020-2024 (USD MILLION)
- TABLE 130 REST OF THE WORLD: BIOMETHANE MARKET, BY END-USE APPLICATION, 2025-2030 (USD MILLION)
- TABLE 131 REST OF THE WORLD: BIOMETHANE MARKET, BY REGION, 2020-2024 (USD MILLION)
- TABLE 132 REST OF THE WORLD: BIOMETHANE MARKET, BY REGION, 2025-2030 (USD MILLION)
- TABLE 133 REST OF THE WORLD: BIOMETHANE MARKET, BY REGION, 2020-2024 (BCM)
- TABLE 134 REST OF THE WORLD: BIOMETHANE MARKET, BY REGION, 2025-2030 (BCM)
- TABLE 135 MIDDLE EAST & AFRICA: BIOMETHANE MARKET, BY END-USE APPLICATION, 2020-2024 (USD MILLION)
- TABLE 136 MIDDLE EAST & AFRICA: BIOMETHANE MARKET, BY END-USE APPLICATION, 2025-2030 (USD MILLION)
- TABLE 137 SOUTH AMERICA: BIOMETHANE MARKET, BY END-USE APPLICATION, 2020-2024 (USD MILLION)
- TABLE 138 SOUTH AMERICA: BIOMETHANE MARKET, BY END-USE APPLICATION, 2025-2030 (USD MILLION)
- TABLE 139 BIOMETHANE MARKET: OVERVIEW OF STRATEGIES ADOPTED BY KEY PLAYERS, JANUARY 2022-JULY 2025
- TABLE 140 BIOMETHANE MARKET: DEGREE OF COMPETITION, 2024
- TABLE 141 BIOMETHANE MARKET: REGION FOOTPRINT
- TABLE 142 BIOMETHANE MARKET: FEEDSTOCK FOOTPRINT
- TABLE 143 BIOMETHANE MARKET: PRODUCTION PROCESS FOOTPRINT
- TABLE 144 BIOMETHANE MARKET: END-USE APPLICATION FOOTPRINT
- TABLE 145 BIOMETHANE MARKET: DETAILED LIST OF KEY STARTUPS/SMES
- TABLE 146 BIOMETHANE MARKET: COMPETITIVE BENCHMARKING OF KEY STARTUPS/SMES
- TABLE 147 BIOMETHANE MARKET: DEALS, JANUARY 2022-JULY 2025
- TABLE 148 BIOMETHANE MARKET: EXPANSIONS, JANUARY 2020-DECEMBER 2025
- TABLE 149 BIOMETHANE MARKET: OTHER DEVELOPMENTS, JANUARY 2020-DECEMBER 2025
- TABLE 150 SHELL: COMPANY OVERVIEW
- TABLE 151 SHELL: PRODUCTS/SOLUTIONS/SERVICES OFFERED
- TABLE 152 SHELL: DEALS
- TABLE 153 GASUM LTD: COMPANY OVERVIEW
- TABLE 154 GASUM LTD: PRODUCTS/SOLUTIONS/SERVICES OFFERED
- TABLE 155 GASUM LTD: DEALS
- TABLE 156 GASUM LTD: EXPANSIONS
- TABLE 157 GASUM LTD: OTHER DEVELOPMENTS
- TABLE 158 AIR LIQUIDE: COMPANY OVERVIEW
- TABLE 159 AIR LIQUIDE: PRODUCTS/SOLUTIONS/SERVICES OFFERED
- TABLE 160 AIR LIQUIDE: EXPANSIONS
- TABLE 161 BP P.L.C.: COMPANY OVERVIEW
- TABLE 162 BP P.L.C.: PRODUCTS/SOLUTIONS/SERVICES OFFERED
- TABLE 163 BP P.L.C.: DEALS
- TABLE 164 BP P.L.C.: EXPANSIONS
- TABLE 165 VERBIO SE: COMPANY OVERVIEW
- TABLE 166 VERBIO SE: PRODUCTS/SOLUTIONS/SERVICES OFFERED
- TABLE 167 VERBIO SE: DEALS
- TABLE 168 VERBIO SE: EXPANSIONS
- TABLE 169 TOTALENERGIES: COMPANY OVERVIEW
- TABLE 170 TOTALENERGIES: PRODUCTS/SOLUTIONS/SERVICES OFFERED
- TABLE 171 TOTALENERGIES: DEALS
- TABLE 172 TOTALENERGIES: EXPANSIONS
- TABLE 173 OPAL FUELS: COMPANY OVERVIEW
- TABLE 174 OPAL FUELS: PRODUCTS/SOLUTIONS/SERVICES OFFERED
- TABLE 175 OPAL FUELS: DELAS
- TABLE 176 OPAL FUELS: EXPANSIONS
- TABLE 177 OPAL FUELS: OTHER DEVELOPMENTS
- TABLE 178 CHEVRON CORPORATION: COMPANY OVERVIEW
- TABLE 179 CHEVRON CORPORATION: PRODUCTS/SOLUTIONS/SERVICES OFFERED
- TABLE 180 CHEVRON CORPORATION: DEALS
- TABLE 181 CHEVRON CORPORATION: EXPANSIONS
- TABLE 182 E.ON SE: COMPANY OVERVIEW
- TABLE 183 E.ON SE: PRODUCTS/SOLUTIONS/SERVICES OFFERED
- TABLE 184 ENGIE: COMPANY OVERVIEW
- TABLE 185 ENGIE: PRODUCTS/SOLUTIONS/SERVICES OFFERED
- TABLE 186 ENGIE: DEALS
- TABLE 187 ENGIE: EXPANSIONS
- TABLE 188 ENGIE: OTHER DEVELOPMENTS
- TABLE 189 VEOLIA: COMPANY OVERVIEW
- TABLE 190 VEOLIA: PRODUCTS/SOLUTIONS/SERVICES OFFERED
- TABLE 191 VEOLIA: DEALS
- TABLE 192 VEOLIA: OTHER DEVELOPMENTS
- TABLE 193 KINDER MORGAN: COMPANY OVERVIEW
- TABLE 194 KINDER MORGAN: PRODUCTS/SOLUTIONS/SERVICES OFFERED
- TABLE 195 KINDER MORGAN: DEALS
- TABLE 196 AMERESCO: COMPANY OVERVIEW
- TABLE 197 AMERESCO: PRODUCTS/SOLUTIONS/SERVICES OFFERED
- TABLE 198 AMERESCO: DEALS
- TABLE 199 AMERESCO: EXPANSIONS
- TABLE 200 AMERESCO: OTHER DEVELOPMENTS
- TABLE 201 CLEAN ENERGY FUELS: COMPANY OVERVIEW
- TABLE 202 CLEAN ENERGY FUELS: PRODUCTS/SOLUTIONS/SERVICES OFFERED
- TABLE 203 CLEAN ENERGY FUELS: DEALS
- TABLE 204 CLEAN ENERGY FUELS: EXPANSIONS
- TABLE 205 GOTEBORG ENERGI: COMPANY OVERVIEW
- TABLE 206 GOTEBORG ENERGI: PRODUCTS/SOLUTIONS/SERVICES OFFERED
- TABLE 207 GOTEBORG ENERGI: EXPANSIONS
- TABLE 208 ENVITEC BIOGAS AG: COMPANY OVERVIEW
- TABLE 209 RAIZEN: COMPANY OVERVIEW
- TABLE 210 VANGUARD RENEWABLES: COMPANY OVERVIEW
- TABLE 211 ANAERGIA: COMPANY OVERVIEW
- TABLE 212 WAGA ENERGY: COMPANY OVERVIEW
- TABLE 213 WELTEC BIPOWER GMBH: COMPANY OVERVIEW
- TABLE 214 ETW ENERGIETECHNIK GMBH: COMPANY OVERVIEW
- TABLE 215 GENECO: COMPANY OVERVIEW
- TABLE 216 PLANET BIOGAS GROUP: COMPANY OVERVIEW
- TABLE 217 EQTEC PLC AND GROUP: COMPANY OVERVIEW
- TABLE 218 LIST OF PRIMARY INTERVIEW PARTICIPANTS
- TABLE 219 DATA OBTAINED FROM PRIMARY SOURCES
List of Figures
- FIGURE 1 BIOMETHANE MARKET SEGMENTATION AND REGIONAL SCOPE
- FIGURE 2 BIOMETHANE MARKET HIGHLIGHTS AND KEY INSIGHTS
- FIGURE 3 GLOBAL BIOMETHANE MARKET, 2025-2030 (USD MILLION)
- FIGURE 4 MAJOR STRATEGIES ADOPTED BY KEY PLAYERS IN BIOMETHANE MARKET, 2022-2025
- FIGURE 5 DISRUPTIONS IMPACTING GROWTH OF CIRCUIT BREAKER MARKET
- FIGURE 6 HIGH-GROWTH SEGMENTS IN BIOMETHANE MARKET, 2025-2030
- FIGURE 7 ASIA PACIFIC TO REGISTER HIGHEST GROWTH DURING FORECAST PERIOD
- FIGURE 8 STRONG POLICY SUPPORT FOR DECARBONIZATION AND WASTE-TO-ENERGY SOLUTIONS ACCELERATES GLOBAL BIOMETHANE MARKET GROWTH
- FIGURE 9 ASIA PACIFIC TO REGISTER HIGHEST CAGR IN BIOMETHANE MARKET FROM 2025 TO 2030
- FIGURE 10 AGRICULTURE RESIDUE AND ANIMAL MANURE SEGMENT TO ACCOUNT FOR LARGEST MARKET SHARE IN 2030
- FIGURE 11 ANAEROBIC DIGESTION & FERMENTATION SEGMENT TO CAPTURE LARGEST MARKET SHARE IN 2030
- FIGURE 12 TRANSPORTATION SEGMENT TO HOLD LARGEST MARKET SHARE IN 2030
- FIGURE 13 POWER GENERATION SEGMENT AND GERMANY HELD LARGEST SHARE OF BIOMETHANE MARKET IN EUROPE IN 2024
- FIGURE 14 BIOMETHANE MARKET: DRIVERS, RESTRAINTS, OPPORTUNITIES, AND CHALLENGES
- FIGURE 15 BIOMETHANE PRODUCTION IN EUROPE (BCM), 2015-2024
- FIGURE 16 UPGRADING TECHNOLOGIES FOR BIOMETHANE PRODUCTION IN EUROPE, 2024
- FIGURE 17 PORTER'S FIVE FORCES ANALYSIS
- FIGURE 18 BIOMETHANE MARKET: SUPPLY CHAIN ANALYSIS
- FIGURE 19 BIOMETHANE MARKET: ECOSYSTEM ANALYSIS
- FIGURE 20 EXPORT SCENARIO FOR HS CODE 271111-COMPLIANT PRODUCTS, BY COUNTRY, 2020-2024
- FIGURE 21 IMPORT SCENARIO FOR HS CODE 271111-COMPLIANT PRODUCTS, BY COUNTRY, 2020-2024
- FIGURE 22 AVERAGE SELLING PRICE TREND OF BIOMETHANE, BY REGION, 2020-2024 (USD/CUBIC METER)
- FIGURE 23 BIOMETHANE MARKET: TRENDS/DISRUPTIONS IMPACTING CUSTOMER BUSINESS
- FIGURE 24 INVESTMENT AND FUNDING SCENARIO, 2024
- FIGURE 25 TWO-STAGE MEMBRANE SEPARATION PROCESS FOR BIOMETHANE UPGRADING
- FIGURE 26 CRYOGENIC SEPARATION PROCESS FOR BIOMETHANE UPGRADING
- FIGURE 27 BIOMETHANE MARKET: PATENTS GRANTED AND APPLIED, 2016-2025
- FIGURE 28 FUTURE APPLICATIONS IN BIOMETHANE MARKET
- FIGURE 29 BIOMETHANE MARKET: DECISION-MAKING FACTORS
- FIGURE 30 INFLUENCE OF STAKEHOLDERS ON BUYING PROCESS, BY END USER
- FIGURE 31 KEY BUYING CRITERIA, BY END-USE APPLICATION
- FIGURE 32 BIOMETHANE DISTRIBUTION THROUGH PIPELINE INJECTION
- FIGURE 33 BIOMETHANE DISTRIBUTION AS COMPRESSED NATURAL GAS
- FIGURE 34 BIOMETHANE DISTRIBUTION AS LIQUIFIED NATURAL GAS
- FIGURE 35 BIOMETHANE MARKET, BY FEEDSTOCK, 2024
- FIGURE 36 BIOMETHANE MARKET, BY PRODUCTION PROCESS, 2024
- FIGURE 37 BIOMETHANE MARKET, BY END-USE APPLICATION, 2024
- FIGURE 38 ASIA PACIFIC TO RECORD HIGHEST CAGR DURING FORECAST PERIOD
- FIGURE 39 BIOMETHANE MARKET SHARE, BY REGION, 2025
- FIGURE 40 EUROPE: BIOMETHANE MARKET SNAPSHOT
- FIGURE 41 ASIA PACIFIC: BIOMETHANE MARKET SNAPSHOT
- FIGURE 42 BIOMETHANE MARKET: SEGMENTAL REVENUE ANALYSIS OF KEY PLAYERS, 2020-2024
- FIGURE 43 MARKET SHARE ANALYSIS OF COMPANIES OFFERING BIOMETHANE, 2024
- FIGURE 44 COMPANY VALUATION
- FIGURE 45 FINANCIAL METRICS
- FIGURE 46 BIOMETHANE MARKET: BRAND COMPARISON
- FIGURE 47 BIOMETHANE MARKET: COMPANY EVALUATION MATRIX (KEY PLAYERS), 2024
- FIGURE 48 BIOMETHANE MARKET: COMPANY FOOTPRINT
- FIGURE 49 BIOMETHANE MARKET: COMPANY EVALUATION MATRIX (STARTUPS/SMES), 2024
- FIGURE 50 SHELL: COMPANY SNAPSHOT
- FIGURE 51 GASUM LTD: COMPANY SNAPSHOT
- FIGURE 52 AIR LIQUIDE: COMPANY SNAPSHOT
- FIGURE 53 BP P.L.C.: COMPANY SNAPSHOT
- FIGURE 54 VERBIO SE: COMPANY SNAPSHOT
- FIGURE 55 TOTALENERGIES: COMPANY SNAPSHOT
- FIGURE 56 OPAL FUELS: COMPANY SNAPSHOT
- FIGURE 57 CHEVRON CORPORATION: COMPANY SNAPSHOT
- FIGURE 58 E.ON SE: COMPANY SNAPSHOT
- FIGURE 59 ENGIE: COMPANY SNAPSHOT
- FIGURE 60 VEOLIA: COMPANY SNAPSHOT
- FIGURE 61 KINDER MORGAN: COMPANY SNAPSHOT
- FIGURE 62 AMERESCO: COMPANY SNAPSHOT
- FIGURE 63 CLEAN ENERGY FUELS: COMPANY SNAPSHOT
- FIGURE 64 GOTEBORG ENERGI: COMPANY SNAPSHOT
- FIGURE 65 BIOMETHANE MARKET: RESEARCH DESIGN
- FIGURE 66 KEY DATA FROM SECONDARY SOURCES
- FIGURE 67 INSIGHTS FROM INDUSTRY EXPERTS
- FIGURE 68 BREAKDOWN OF PRIMARIES: BY COMPANY TYPE, DESIGNATION, AND REGION
- FIGURE 69 BIOMETHANE MARKET: BOTTOM-UP APPROACH
- FIGURE 70 BIOMETHANE MARKET: TOP-DOWN APPROACH
- FIGURE 71 KEY METRICS CONSIDERED TO ANALYZE DEMAND FOR BIOMETHANE
- FIGURE 72 KEY METRICS CONSIDERED TO ASSESS SUPPLY OF BIOMETHANE
- FIGURE 73 BIOMETHANE MARKET: SUPPLY-SIDE ANALYSIS
- FIGURE 74 INDUSTRY CONCENTRATION, 2024
- FIGURE 75 BIOMETHANE MARKET: DATA TRIANGULATION
- FIGURE 76 BIOMETHANE MARKET: RESEARCH LIMITATIONS
- FIGURE 77 BIOMETHANE MARKET: INSIGHTS FROM INDUSTRY EXPERTS
 生物甲烷市场规模、份额和成长分析(按原料、生产方法、应用、最终用途产业和地区划分)-2026-2033年产业预测
 生物甲烷市场规模、占有率、成长及全球产业分析:依类型、应用和地区的洞察与预测(2026-2034年)
 2026年全球生物甲烷市场报告
 全球沼气和生物甲烷市场:预测(至2032年)-按原料、技术、应用、最终用户和地区分類的分析
 生物甲烷市场-全球产业规模、份额、趋势、竞争机会及预测,依原料类型、生产方法、应用、地区及竞争格局划分,2020-2030年预测
 生物甲烷市场规模、份额、趋势分析报告(按来源、最终用途、地区、细分市场预测,2025-2030 年)
 生物甲烷市场、规模、占有率、趋势、行业分析报告(依生产技术、应用、原材料和地区)-2025-2034年市场预测生物甲烷市场:全球产业分析、市场规模、占有率、成长、趋势和未来预测(2025-2032 年)2030 年生物甲烷市场预测:按原料、生产方法、应用、最终用户和地区进行的全球分析
 全球生物甲烷市场