


 |
市场调查报告书
商品编码
1430570
根瘤菌:市场占有率分析、产业趋势/统计、成长预测(2024-2029)Rhizobium - Market Share Analysis, Industry Trends & Statistics, Growth Forecasts (2024 - 2029) |
||||||
价格
※ 本网页内容可能与最新版本有所差异。详细情况请与我们联繫。
简介目录
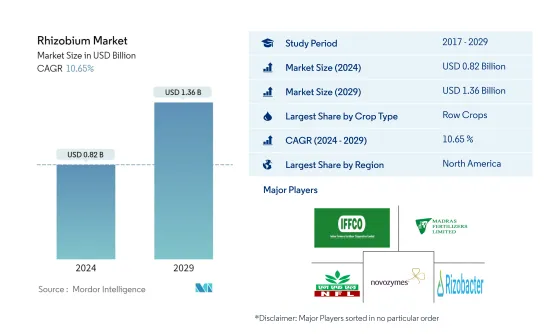
根瘤菌市场规模预计到2024年为8.2亿美元,预计到2029年将达到13.6亿美元,在预测期内(2024-2029年)复合年增长率为10.65%。
主要亮点
- 田间作物是最大的作物类型。根瘤菌与豆科植物根部的相互作用形成了一个高度调控的过程,将大气中的氮转化为可吸收的植物养分。
- 连作作物是生长最快的作物。大麦、玉米、小麦、油菜籽、黑麦、向日葵、大豆和稻米在世界各地种植。北美和欧洲地区的连续作物消费主导市场。
- 北美是最大的地区。美国和加拿大连作作物有机种植的增加导致该地区根瘤菌生物肥料的使用增加。
- 美国是最大的国家。该国生产玉米、大豆、稻米、小麦和紫花苜蓿,田间作物有机种植面积不断扩大,2017年至2022年增加27.4%。
根瘤菌市场趋势
田间作物是最大的作物类型
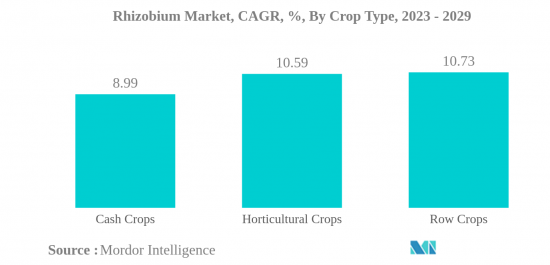
- 根瘤菌和豆科植物根部之间的特异性相互作用形成了一种高度控制的过程,称为调节,将大气中的氮转化为可吸收的植物养分。这种能力是田间作物生产中使用细菌接种剂的基础。 2022年,菌根真菌市场以连作作物为主,约占市场金额的69.7%。世界上最重要的连续作物是大麦、玉米、小麦、油菜籽、黑麦、向日葵、大豆和稻米。
- 到 2022 年,园艺作物中基于根瘤菌的生物肥料市场预计将达到 1.372 亿美元,使用量为 4,900 吨。根瘤菌定殖在番茄和辣椒的根部,促进生产各阶段的生长,提高幼苗和果实的产量和品质。它也用于番茄、辣椒和其他园艺水果的温室栽培。
- 咖啡、茶叶、可可、棉花、甘蔗、油菜籽、向日葵和烟草是全世界种植的主要经济作物。 2022年,经济作物占根瘤菌生物肥料市场价值6,870万美元。北美主导经济作物市场,2022 年销售额约 5,220 万美元。
- 根瘤菌接种可以为植物提供所需的氮,同时减少无机氮肥的需求。有效的根瘤菌接种可提供高达产量所需总氮的 50-70%。根瘤菌也会产生维生素、胺基酸、铁载体、生长素和固氮作用。
- 由于上述特点以及根瘤菌肥料应用的增加,预计市场在预测期内将会成长。
北美是最大的地区
- 根瘤菌与植物有共生关係,是生活在豆科植物根瘤中最重要的固氮细菌。根瘤菌是世界上消费量第二大的生物肥料,到2022年将占25.4%的份额。
- 据估计,根瘤菌的微生物活性每年在各种豆类作物中每公顷固定 40 至 250 公斤氮。欧盟 (EU) 计划透过扩大豆类作物种植面积,转向永续植物蛋白生产。
- 2022年,北美主导全球根瘤菌市场,市场占有率为52.7%。北美根瘤菌生物肥料市场以连作作物为主,2022年约占市场金额的62.4%。连作作物占主导地位,因为根瘤菌与连作作物中的作物共存。由于该地区连作作物的高种植,预计市场价值将在预测期内增加,复合年增长率为 13.0%。
- 非普通作物非常需要额外散布以提高作物产量潜力。使用生物固氮细菌可以增加谷物、水果和蔬菜等非反刍作物的产量。根瘤菌生物肥料市场以栽培作物为主,由于田间作物种植面积较大,2022年约占市场金额的69.8%。众所周知,将根瘤菌生物肥料应用于水果和蔬菜作物可以增加养分利用率并产生必要的植物激素。
根瘤菌产业概述
根瘤菌市场较为分散,前五名企业占28.14%。该市场的主要企业包括印度农民肥料合作社有限公司、马德拉斯肥料有限公司、国家肥料有限公司、Novozymes 和 Rizobacter。 (按字母顺序)
其他福利:
- Excel 格式的市场预测 (ME) 表
- 3 个月的分析师支持
目录
第一章执行摘要和主要发现
第二章 检举要约
第三章简介
- 研究假设和市场定义
- 调查范围
- 调查方法
第四章 产业主要趋势
- 有机种植面积
- 人均有机产品支出
- 法律规范
- 价值炼和通路分析
第五章市场区隔
- 作物类型
- 经济作物
- 园艺作物
- 栽培作物
- 地区
- 非洲
- 按国家/地区
- 埃及
- 奈及利亚
- 南非
- 其他非洲
- 亚太地区
- 按国家/地区
- 澳洲
- 中国
- 印度
- 印尼
- 日本
- 菲律宾
- 泰国
- 越南
- 其他亚太地区
- 欧洲
- 按国家/地区
- 法国
- 德国
- 义大利
- 荷兰
- 俄罗斯
- 西班牙
- 土耳其
- 英国
- 其他欧洲国家
- 中东
- 按国家/地区
- 伊朗
- 沙乌地阿拉伯
- 其他中东地区
- 北美洲
- 按国家/地区
- 加拿大
- 墨西哥
- 美国
- 其他北美地区
- 南美洲
- 按国家/地区
- 阿根廷
- 巴西
- 南美洲其他地区
- 非洲
第六章 竞争形势
- 主要策略趋势
- 市场占有率分析
- 公司形势
- 公司简介
- Indian Farmers Fertiliser Cooperative Limited
- Indogulf BioAg LLC(Biotech Division of Indogulf Company)
- IPL Biologicals Limited
- Lallemand Inc.
- Madras Fertilizers Limited
- National Fertilizers Limited
- Novozymes
- Rizobacter
- T Stanes and Company Limited
- Vittia Group
第七章 执行长的关键策略问题 执行长的关键策略问题
第8章附录
- 世界概况
- 概述
- 五力分析框架
- 世界价值链分析
- 市场动态(DRO)
- 资讯来源和参考文献
- 图表列表
- 重要见解
- 资料包
- 词彙表
简介目录
Product Code: 64662
The Rhizobium Market size is estimated at USD 0.82 billion in 2024, and is expected to reach USD 1.36 billion by 2029, growing at a CAGR of 10.65% during the forecast period (2024-2029).
Key Highlights
- Row Crops is the Largest Crop Type. The interaction between rhizobia and legume roots results in the formation of a highly regulated process converts atmospheric nitrogen into an assimilable plant nutrient.
- Row Crops is the Fastest-growing Crop Type. Barley, maize, wheat, rapeseed, rye, sunflower, soybean, and rice crops formed globally. North America and Europe regions row crop's consumption dominating the market.
- North America is the Largest Region. The increased organic cultivation of row crops in the United states and Canada resulted in an increase in the use of rhizobia-based biofertilizers in the region.
- United States is the Largest Country. Corn, soybeans, rice, wheat, and alfalfa are produced in the country and the organic area under cultivation of field crops has expanded, increased by 27.4% from 2017 to 2022.
Rhizobium Market Trends
Row Crops is the largest Crop Type
- The specific interaction between rhizobia and legume roots results in the formation of a highly regulated process termed modulation, which converts atmospheric nitrogen into an assimilable plant nutrient. This ability provides the basis for the use of bacterial inoculants in field crop production. Row crops dominated the mycorrhiza market in 2022, accounting for around 69.7% of market value. Globally, the most important row crops are barley, maize, wheat, rapeseed, rye, sunflower, soybean, and rice.
- The market for rhizobium-based biofertilizers in horticultural crops is expected to be worth USD 137.2 million, with 4.9 thousand metric tons used in 2022. Rhizobium strains colonize the roots of tomato and pepper plants to encourage growth at various stages of production, increasing seedling and fruit yield and quality. It is also utilized in greenhouse culture, such as tomato and capsicum farming, as well as other horticultural fruit growing.
- Coffee, tea, cocoa, cotton, sugarcane, rapeseed, sunflower, and tobacco are some of the major cash crops grown globally. Cash crops accounted for USD 68.7 million in the market value of rhizobium-based biofertilizers in 2022. North America dominated the market for cash crops and accounted for about USD 52.2 million in 2022.
- Rhizobium inoculation can provide plant nitrogen requirements while decreasing the demand for inorganic nitrogen fertilizer. Effective rhizobium inoculation can deliver up to 50-70% of the total nitrogen required to boost yields. Rhizobium also generates vitamins, amino acids, siderophores, auxins, and nitrogen fixation.
- Owing to the above-mentioned characteristics and the increase in the application of rhizobium-based fertilizers, the market is anticipated to grow during the forecast period.
North America is the largest Region
- Rhizobium is the most important nitrogen-fixing bacterium that exists in a symbiotic relationship with plants and lives in the root nodules of leguminous plants. Rhizobium is the second most consumed among biofertilizers globally and accounted for a share of 25.4% in the year 2022.
- It has been estimated that 40-250 kg of nitrogen per hectare per year is fixed by different legume crops by the microbial activities of rhizobium. The European Union is planning to make the transition toward sustainable plant protein production through the expansion of the area under leguminous crop cultivation.
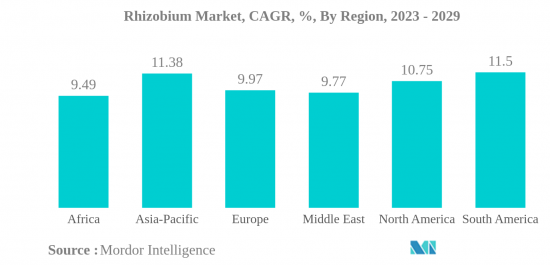
- North America dominated the global rhizobium market with a market share of 52.7% in 2022. Row crops dominate the rhizobium biofertilizer market in North America, and they accounted for about 62.4% of the market value in 2022. The dominance of row crops is due to rhizobium's symbiotic association with leguminous crops, which come under row crops. Due to the large cultivation of row crops in the region, their market value is anticipated to increase, registering a CAGR of 13.0% during the forecast period.
- The requirement for additional application of nitrogen in non-leguminous crops is high in order to enhance the yield potential of the crops. The usage of biological nitrogen-fixing bacteria can increase the production of non-leguminous crops like cereals, fruits, and vegetables. Row crops dominate the rhizobium biofertilizer market and accounted for about 69.8% of the market value in 2022, owing to the large area under the cultivation of field crops. The application of rhizobium biofertilizers in fruit and vegetable crops is known to increase nutrient availability and produce required plant hormones.
Rhizobium Industry Overview
The Rhizobium Market is fragmented, with the top five companies occupying 28.14%. The major players in this market are Indian Farmers Fertiliser Cooperative Limited, Madras Fertilizers Limited, National Fertilizers Limited, Novozymes and Rizobacter (sorted alphabetically).
Additional Benefits:
- The market estimate (ME) sheet in Excel format
- 3 months of analyst support
TABLE OF CONTENTS
1 EXECUTIVE SUMMARY & KEY FINDINGS
2 REPORT OFFERS
3 INTRODUCTION
- 3.1 Study Assumptions & Market Definition
- 3.2 Scope of the Study
- 3.3 Research Methodology
4 KEY INDUSTRY TRENDS
- 4.1 Area Under Organic Cultivation
- 4.2 Per Capita Spending On Organic Products
- 4.3 Regulatory Framework
- 4.4 Value Chain & Distribution Channel Analysis
5 MARKET SEGMENTATION
- 5.1 Crop Type
- 5.1.1 Cash Crops
- 5.1.2 Horticultural Crops
- 5.1.3 Row Crops
- 5.2 Region
- 5.2.1 Africa
- 5.2.1.1 By Country
- 5.2.1.1.1 Egypt
- 5.2.1.1.2 Nigeria
- 5.2.1.1.3 South Africa
- 5.2.1.1.4 Rest of Africa
- 5.2.2 Asia-Pacific
- 5.2.2.1 By Country
- 5.2.2.1.1 Australia
- 5.2.2.1.2 China
- 5.2.2.1.3 India
- 5.2.2.1.4 Indonesia
- 5.2.2.1.5 Japan
- 5.2.2.1.6 Philippines
- 5.2.2.1.7 Thailand
- 5.2.2.1.8 Vietnam
- 5.2.2.1.9 Rest of Asia-Pacific
- 5.2.3 Europe
- 5.2.3.1 By Country
- 5.2.3.1.1 France
- 5.2.3.1.2 Germany
- 5.2.3.1.3 Italy
- 5.2.3.1.4 Netherlands
- 5.2.3.1.5 Russia
- 5.2.3.1.6 Spain
- 5.2.3.1.7 Turkey
- 5.2.3.1.8 United Kingdom
- 5.2.3.1.9 Rest of Europe
- 5.2.4 Middle East
- 5.2.4.1 By Country
- 5.2.4.1.1 Iran
- 5.2.4.1.2 Saudi Arabia
- 5.2.4.1.3 Rest of Middle East
- 5.2.5 North America
- 5.2.5.1 By Country
- 5.2.5.1.1 Canada
- 5.2.5.1.2 Mexico
- 5.2.5.1.3 United States
- 5.2.5.1.4 Rest of North America
- 5.2.6 South America
- 5.2.6.1 By Country
- 5.2.6.1.1 Argentina
- 5.2.6.1.2 Brazil
- 5.2.6.1.3 Rest of South America
- 5.2.1 Africa
6 COMPETITIVE LANDSCAPE
- 6.1 Key Strategic Moves
- 6.2 Market Share Analysis
- 6.3 Company Landscape
- 6.4 Company Profiles
- 6.4.1 Indian Farmers Fertiliser Cooperative Limited
- 6.4.2 Indogulf BioAg LLC (Biotech Division of Indogulf Company)
- 6.4.3 IPL Biologicals Limited
- 6.4.4 Lallemand Inc.
- 6.4.5 Madras Fertilizers Limited
- 6.4.6 National Fertilizers Limited
- 6.4.7 Novozymes
- 6.4.8 Rizobacter
- 6.4.9 T Stanes and Company Limited
- 6.4.10 Vittia Group
7 KEY STRATEGIC QUESTIONS FOR AGRICULTURAL BIOLOGICALS CEOS
8 APPENDIX
- 8.1 Global Overview
- 8.1.1 Overview
- 8.1.2 Porter's Five Forces Framework
- 8.1.3 Global Value Chain Analysis
- 8.1.4 Market Dynamics (DROs)
- 8.2 Sources & References
- 8.3 List of Tables & Figures
- 8.4 Primary Insights
- 8.5 Data Pack
- 8.6 Glossary of Terms
02-2729-4219
+886-2-2729-4219
 2024-2032 年生物肥料市场报告(按类型、作物、微生物、施用方式和地区)
 生物肥料市场-2024年至2029年预测
 2024 年生物肥料全球市场报告
 生物有机肥料 - 市场占有率分析、产业趋势与统计、成长预测(2024 - 2029)
 生物肥料:市场占有率分析、产业趋势与统计、成长预测(2024-2029)
 全球根瘤菌市场 - 2023-2030
 2024 年根瘤菌肥料全球市场报告
 全球生物肥料市场 - 2023-2030
 生物肥料市场 - 2018-2028 年全球产业规模、份额、趋势、机会和预测,按类型、形式、作物类型、按应用、微生物类型、地区和竞争细分
 生物肥料市场:2023-2028年全球行业趋势、份额、规模、增长、机会和预测
▼