


 |
市场调查报告书
商品编码
1438366
硅砂 - 市场占有率分析、产业趋势与统计、成长预测(2024 - 2029)Silica Sand - Market Share Analysis, Industry Trends & Statistics, Growth Forecasts (2024 - 2029) |
||||||
※ 本网页内容可能与最新版本有所差异。详细情况请与我们联繫。
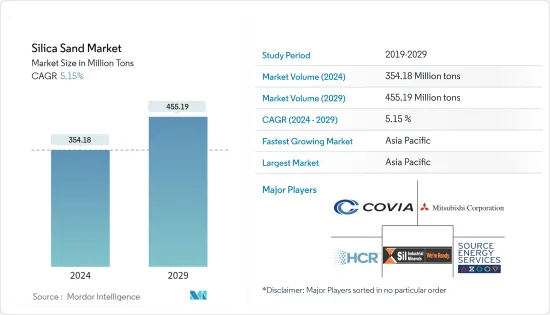
预计2024年硅砂市场规模为35,418万吨,预估至2029年将达4,5519万吨,在预测期内(2024-2029年)CAGR为5.15%。
由于 COVID-19,市场受到负面影响。受疫情影响,全球多个国家进入封锁状态,以遏止病毒传播。众多公司和工厂的关闭扰乱了全球供应网络,损害了全球生产、交货计划和产品销售。目前,市场已从 COVID-19 大流行中恢復过来,并以显着的速度成长。
主要亮点
- 从中期来看,推动市场成长的主要因素是铸造业需求的成长和玻璃产业需求的成长。
- 另一方面,替代品的可用性以及对硅砂开采对环境影响的担忧可能会限制市场成长。
- 不断增长的水处理行业可能会成为未来几年市场的机会。
- 亚太地区占据了最高的市场份额,该地区很可能在预测期内主导市场。
硅砂市场趋势
石油和天然气产业将主导市场
- 在石油工业中,硅砂被称为压裂砂。二氧化硅的硬度在这里很重要。由于其化学纯度,它可以抵抗腐蚀性环境。其颗粒沉积物可最大限度地减少地层钻屑,当泵入深井时,有助于提高石油流速。
- 硅砂,也称为“压裂砂”,来自于其在水力压裂(“水力压裂”)中的应用,这是石油和天然气公司用来从非常规低渗透油藏生产天然气、天然气液体和石油的完井方法例如页岩。
- 硅砂在压裂页岩以从岩石孔隙中释放天然气、石油和天然气液体的过程中至关重要。当高压水流迫使小穿孔变成更大的裂缝时,压裂砂会使这些裂缝保持开放,以继续释放化石燃料。当使用白沙(或任何其他类型的天然或合成物质)来支撑这些裂缝时,它被称为支撑剂。
- 当水泵关闭时,裂缝必须保持开启状态,这样提取天然气和石油的孔隙就不会收缩。这就是为什么支撑剂必须尽可能耐用且抗压碎。支撑剂能承受裂缝巨大压力的时间越长。可以提取更多的石油,从而最大限度地提高油井的效率。
- 据国际能源总署称,到 2026 年,全球石油消费量预计将达到 1.041 亿桶/日。这将比目前的水平增加 4.4 兆桶/日。此外,国际能源总署预计,到 2023 年,全球石油需求将增加 1.9 mb/d,达到创纪录的 101.7 mb/d,几乎是中国解除新冠限制后增幅的一半。
- 到2025年,全球石油需求预计将成长5.7 mb/d(百万桶/日),其中中国和印度约占成长的一半。同时,全球石油产能预计将成长5.9 mb/d。随着 OPEC 新增 1.4 mb/d 的原油和天然气液体产能,非 OPEC(石油输出国组织)的供应可能会增加 4.5 mb/d,这表明石油和天然气行业研究市场的需求增加。
- 2022年北美原油和液体燃料总产量为2781万桶/日,而2021年为2644万桶/日。根据美国能源资讯署(EIA)的数据,2023年1月美国原油产量达到12,462千桶,而2022年12月的年产量为12,115千桶。美国是全球石油勘探领先的国家之一。非常规原油储量,显示该国所研究的市场存在巨大机会。
- 因此,由于上述几点,石油和天然气行业可能会主导市场,从而预计将在预测期内增加硅砂的需求。
亚太地区将主导市场
- 预计亚太地区将主导所研究的市场,中国和印度等主要经济体将引领该地区的成长。
- 石油天然气产业是中国硅砂最大的应用产业之一。过去二十年来,中国不断投资扩大炼油能力,以适应不断成长的经济。而且,长期以来,中国各类原油的炼製能力不断扩大。根据能源研究所预测,到2025年底,中国炼油产能可能达到2,000万桶,将引发未来几年对硅砂的需求。
- 此外,2022年1-2月,中国原油产量3,347万吨,年增约4.6%。根据中国国家统计局统计,原油日产量近57.6万吨。
- 玻璃製造业在中国正以最快的速度成长,同时玻璃在建筑和汽车等多个产业的应用也越来越广泛。根据中国国家统计局统计,2023年4月,中国生产钢化玻璃约4,307万平方公尺。此外,2022年,强化玻璃总产量近5.8亿平方公尺。
- 截至2022年7月,联合国估计印度目前人口超过14亿人。快速的城市化和不断增长的人口将在未来几年增加石油需求。据印度品牌公平基金会 (IBEF) 称,到 2045 年,印度的日产量可能会达到 1,100 万桶。到 2029-30 年,柴油需求预计将翻一番,达到 163 公吨。该国是世界第三大石油进口国,每年炼油量约2.49亿吨,相当于每天500万桶。未来五年,其炼油能力预计将攀升至每年2.98亿吨。
- 此外,印度玻璃工业的成长主要是由建筑业推动的。由于住宅建筑专案对平板玻璃的需求不断增长,建筑和基础设施行业在印度平板玻璃市场中占有最高的市场份额。此外,这家位于印度的製造商正在大幅扩大其生产能力和产品组合。例如:
- 2022 年3 月,法国浮法玻璃製造商圣戈班投资50 亿印度卢比(6,763 万美元),在印度钦奈西斯里佩鲁姆布杜尔的世界玻璃园区建设了一座新的浮法玻璃工厂和一条综合窗户生产线。
- 上述因素显示亚太地区硅砂市场强劲的成长潜力。
硅砂产业概况
全球硅砂市场本质上是整合的。市场上一些主要的公司(排名不分先后)包括 Hi-Crush Inc.、Covia Holdings LLC、Source Energy Services、Mitsubishi Corporation 和 Sil Industrial Minerals 等。
额外的好处:
- Excel 格式的市场估算 (ME) 表
- 3 个月的分析师支持
目录
第 1 章:简介
- 研究假设
- 研究范围
第 2 章:研究方法
第 3 章:执行摘要
第 4 章:市场动态
- 司机
- 铸造业的需求不断增长
- 玻璃产业不断增长的需求
- 限制
- 替代品的可用性
- 非法采砂
- 对硅砂开采环境影响的担忧
- 产业价值链分析
- 波特五力
- 供应商的议价能力
- 消费者的议价能力
- 新进入者的威胁
- 替代产品和服务的威胁
- 竞争程度
第 5 章:市场区隔(市场规模按数量计算)
- 最终用户产业
- 玻璃製造
- 铸造厂
- 化学品生产
- 建造
- 油漆和涂料
- 陶瓷及耐火材料
- 滤
- 油和气
- 其他最终用户产业
- 地理
- 亚太
- 中国
- 印度
- 日本
- 韩国
- 亚太其他地区
- 北美洲
- 美国
- 加拿大
- 墨西哥
- 欧洲
- 德国
- 英国
- 义大利
- 法国
- 欧洲其他地区
- 南美洲
- 巴西
- 阿根廷
- 南美洲其他地区
- 中东和非洲
- 沙乌地阿拉伯
- 南非
- 中东和非洲其他地区
- 亚太
第 6 章:竞争格局
- 併购、合资、合作与协议
- 市占率(%)**/排名分析
- 领先企业采取的策略
- 公司简介
- Badger Mining Corporation
- Chongqing Changjiang River Moulding Material Group Co. Ltd
- Covia Holdings LLC
- Euroquarz GmbH
- Hi-Crush Inc.
- JFE Mineral & Alloy Company Ltd
- Mitsubishi Corporation
- PUM GROUP
- Sibelco
- Sil Industrial Minerals
- Source Energy Services
- Superior Silica Sands
- Tochu Corporation
- US Silica
第 7 章:市场机会与未来趋势
- 不断发展的水处理产业
- 其他机会
The Silica Sand Market size is estimated at 354.18 Million tons in 2024, and is expected to reach 455.19 Million tons by 2029, growing at a CAGR of 5.15% during the forecast period (2024-2029).
The market was negatively impacted due to COVID-19. Owing to the pandemic, several countries worldwide went into lockdown to curb the spread of the virus. The shutdown of numerous companies and factories has disrupted worldwide supply networks and harmed global production, delivery schedules, and product sales. Currently, the market has recovered from the COVID-19 pandemic and increasing at a significant rate.
Key Highlights
- Over the medium term, the major factors driving the market growth are the increasing demand from the foundry industry and the growing demand from the glass industry.
- On the flip side, the availability of substitutes and concerns over the environmental impacts of silica sand mining is likely to restrain the market growth.
- The growing water treatment industry is likely to act as an opportunity for the market in the coming years.
- Asia-Pacific accounted for the highest market share, and the region is likely to dominate the market during the forecast period.
Silica Sand Market Trends
Oil and Gas Industry to Dominate the Market
- In the oil industry, silica sand is referred to as frac sand. The hardness of silica is important here. Because of its chemical purity, it can attack corrosive environments. Its granules deposit maximizes formation cuttings, and when pumped down in deep wells, it helps improve the oil flow rate.
- Silica sand, also known as "frac sand," comes from its use in hydraulic fracturing ("fracking"), a completion method used by oil and gas companies to produce natural gas, natural gas liquids, and oil from unconventional, low permeability reservoirs such as shale.
- Silica sand is essential in the process of fracturing shale to release natural gas, oil, and natural gas liquids from pores in the rock. When the high-pressure water stream forces the small perforations to become larger fractures, fracking sand keeps these fractures open to continue releasing fossil fuels. When white sand (or any other type of natural or synthetic substance) is used to prop open these fractures, it is referred to as a proppant.
- When the water pumps are turned off, the fractures must be kept open so the pores from which natural gas and oil are extracted do not deflate. That is why a proppant must be as durable and crush-resistant as possible. The longer the proppant can withstand the enormous pressure of the fractures. The more petroleum can be extracted, maximizing the well's efficiency.
- According to the International Energy Agency, global oil consumption is expected to reach 104.1 million barrels per day by 2026. This would be a 4.4 mb/d increase over current levels. Furthermore, the International Energy Agency projects that global oil demand will increase by 1.9 mb/d in 2023 to a record 101.7 mb/d, nearly half of the increase from China when its Covid limitations were lifted.
- The global oil demand is expected to rise by 5.7 mb/d (million barrels per day), with China and India accounting for about half of the growth by 2025. At the same time, the world's oil production capacity is expected to rise by 5.9 mb/d. Non-OPEC (Organization of the Petroleum Exporting Countries) supply is likely to increase by 4.5 mb/d as OPEC builds another 1.4 mb/d of crude and natural gas liquids capacity, indicating increased demand for the studied market in the oil and gas industry.
- The total production of crude oil and liquid fuels in North America in 2022 was 27.81 million barrels per day, while in 2021 was 26.44 million barrels per day. According to the US Energy Information Administration (EIA), crude oil production in the United States reached 12,462 thousand barrels in January 2023, compared to 12,115 thousand barrels annually in December 2022. The United States is one of the leading countries globally in the exploration of unconventional crude oil reserves, indicating a massive opportunity for the studied market in the country.
- Thus, due to the abovementioned points, the oil and gas industry is likely to dominate the market, which, in turn, is expected to enhance the demand for silica sand during the forecast period.
Asia-Pacific Region to Dominate Market
- The Asian-Pacific region is expected to dominate the studied market, with major economies like China and India leading the growth across the region.
- The oil and gas sector is one of the largest application industries for silica sand in China. China has invested to scale up its refining capacity over the past two decades to its growing economy. Moreover, for a long-term period, China has continuously expanded its refining capacity for all types of crudes. According to Institute for Energy Research, China is likely to register 20 million barrels of refining capacity at the end of 2025, which will trigger the demand for silica sand in the upcoming years.
- Moreover, the crude oil output of China has registered 33.47 million tons in the first two months of 2022, about 4.6% up from the same period of the previous year. According to the National Bureau of Statistics China, the daily output of crude oil is nearly 576,000 tons.
- The glass manufacturing industry is growing at the fastest rate in China, coupled with the growing adoption of glass in several industries, including construction and automotive. According to the National Bureau of Statistics of China, China produced approximately 43.07 million square meters of reinforced glass in April 2023. Additionally, in 2022, the total production of reinforced glass accounted for nearly 580 million square meters.
- As of July 2022, the United Nations has estimated the current population of India over 1.4 billion. Rapid urbanization and expanding population will raise oil demand in the upcoming years. According to India Brand Equity Foundation (IBEF), India will likely register 11 million barrels daily by 2045. Diesel demand is projected to be doubled to 163 MT by 2029-30. The country is the world's third-biggest oil importer and has a refining capacity of about 249 million tons annually, equivalent to 5 million barrels per day. Its refining capacity is expected to climb to 298 million tons annually over the next five years.
- Furthermore, the Indian glass industry's growth has been driven primarily by the construction sector. The construction and infrastructure industry holds the highest market share in the Indian flat glass market due to the growing demand for flat glass in residential building projects. Additionally, the manufacturer based in India is significantly expanding their production capacities and product portfolio. For instance:
- In March 2022, Saint-Gobain, a French manufacturer of float glass, invested INR 500 crore (USD 67.63 million) in a new float glass facility and an integrated window line at its World Glass Campus in Sriperumbudur, west of Chennai, India.
- The aforementioned factors indicate strong growth potential for the silica sand market in the Asian-Pacific region.
Silica Sand Industry Overview
The global silica sand market is consolidated in nature. Some of the major companies in the market (not in any particular order) include Hi-Crush Inc., Covia Holdings LLC, Source Energy Services, Mitsubishi Corporation, and Sil Industrial Minerals, among others.
Additional Benefits:
- The market estimate (ME) sheet in Excel format
- 3 months of analyst support
TABLE OF CONTENTS
1 INTRODUCTION
- 1.1 Study Assumptions
- 1.2 Scope of the Study
2 RESEARCH METHODOLOGY
3 EXECUTIVE SUMMARY
4 MARKET DYNAMICS
- 4.1 Drivers
- 4.1.1 Increasing Demand from the Foundry Industry
- 4.1.2 Growing Demand from the Glass Industry
- 4.2 Restraints
- 4.2.1 Availability of Substitutes
- 4.2.2 Illegal Mining of Sand
- 4.2.3 Concerns over Environmental Impacts of Silica Sand Mining
- 4.3 Industry Value Chain Analysis
- 4.4 Porter Five Forces
- 4.4.1 Bargaining Power of Suppliers
- 4.4.2 Bargaining Power of Consumers
- 4.4.3 Threat of New Entrants
- 4.4.4 Threat of Substitute Products and Services
- 4.4.5 Degree of Competition
5 MARKET SEGMENTATION (Market Size in Volume)
- 5.1 End-user Industry
- 5.1.1 Glass Manufacturing
- 5.1.2 Foundry
- 5.1.3 Chemical Production
- 5.1.4 Construction
- 5.1.5 Paints and Coatings
- 5.1.6 Ceramics and Refractories
- 5.1.7 Filtration
- 5.1.8 Oil and Gas
- 5.1.9 Other End-user Industries
- 5.2 Geography
- 5.2.1 Asia-Pacific
- 5.2.1.1 China
- 5.2.1.2 India
- 5.2.1.3 Japan
- 5.2.1.4 South Korea
- 5.2.1.5 Rest of Asia-Pacific
- 5.2.2 North America
- 5.2.2.1 United States
- 5.2.2.2 Canada
- 5.2.2.3 Mexico
- 5.2.3 Europe
- 5.2.3.1 Germany
- 5.2.3.2 United Kingdom
- 5.2.3.3 Italy
- 5.2.3.4 France
- 5.2.3.5 Rest of Europe
- 5.2.4 South America
- 5.2.4.1 Brazil
- 5.2.4.2 Argentina
- 5.2.4.3 Rest of South America
- 5.2.5 Middle East and Africa
- 5.2.5.1 Saudi Arabia
- 5.2.5.2 South Africa
- 5.2.5.3 Rest of Middle East and Africa
- 5.2.1 Asia-Pacific
6 COMPETITIVE LANDSCAPE
- 6.1 Mergers and Acquisitions, Joint Ventures, Collaborations, and Agreements
- 6.2 Market Share(%)**/Ranking Analysis
- 6.3 Strategies Adopted by Leading Players
- 6.4 Company Profiles
- 6.4.1 Badger Mining Corporation
- 6.4.2 Chongqing Changjiang River Moulding Material Group Co. Ltd
- 6.4.3 Covia Holdings LLC
- 6.4.4 Euroquarz GmbH
- 6.4.5 Hi-Crush Inc.
- 6.4.6 JFE Mineral & Alloy Company Ltd
- 6.4.7 Mitsubishi Corporation
- 6.4.8 PUM GROUP
- 6.4.9 Sibelco
- 6.4.10 Sil Industrial Minerals
- 6.4.11 Source Energy Services
- 6.4.12 Superior Silica Sands
- 6.4.13 Tochu Corporation
- 6.4.14 U.S. Silica
7 MARKET OPPORTUNITIES AND FUTURE TRENDS
- 7.1 Growing Water Treatment Industry
- 7.2 Other Opportunities
 硅砂市场-全球产业规模、份额、趋势、机会及预测(按等级、应用、区域及竞争细分,2020-2030 年)
 全球清洗硅砂市场
 全球硅砂市场:预测(2025-2030)
 2025年全球硅砂市场报告
 清洗硅砂市场规模、份额、成长分析(按粒度、铁含量、应用和地区)- 产业预测,2025 年至 2032 年
 日本硅砂市场报告(依最终用途(玻璃工业、铸造、水力压裂、过滤、磨料等)及地区)2025-2033
 2032 年清洗硅砂市场预测:按类型、等级、分销管道、应用和地区进行的全球分析
 清洗硅砂市场:按类型、铁含量、形态和应用 - 2025-2030 年全球预测
 亚太硅砂市场:市场占有率分析、产业趋势与成长预测(2025-2030 年)北美硅砂:市场占有率分析、产业趋势与成长预测(2025-2030 年)