


 |
市场调查报告书
商品编码
1522875
CNG LPG汽车:市场占有率分析、产业趋势/统计、成长预测(2024-2029)CNG LPG Vehicle - Market Share Analysis, Industry Trends & Statistics, Growth Forecasts (2024 - 2029) |
||||||
※ 本网页内容可能与最新版本有所差异。详细情况请与我们联繫。
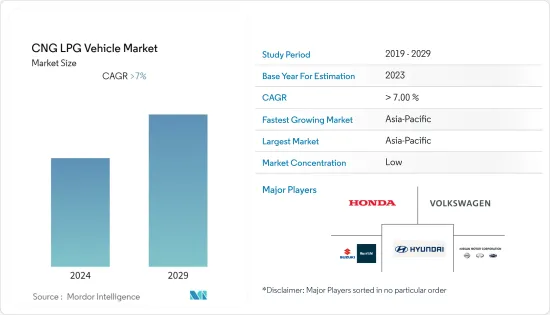
CNG LPG汽车市场规模预计到2024年为67.3亿美元,预计到2029年将达到101.3亿美元,在预测期内(2024-2029年)复合年增长率为7%,预计将会增长。
由于环境问题日益严重、燃料价格上涨以及能源多样化的增加,CNG 和 LPG 汽车的全球市场正在扩大。近年来,CNG 和 LPG 汽车技术取得了重大改进,包括燃料储存、引擎效率和安全功能。这些进步使 CNG 和 LPG 汽车在性能和可靠性方面更具竞争力。
由于压缩天然气和液化石油气比汽油和柴油便宜,营运成本降低是主要推动因素。这方面对于商用车和高里程车辆尤其有吸引力。世界各地都在加强废气排放法规,并且比传统燃料排放的污染物更少的压缩天然气和液化石油气汽车的采用正在加速。
随着世界转向永续能源,压缩天然气和液化石油气汽车可能会保持其相关性,特别是在电动车基础设施落后的地区。汽车技术和燃料基础设施的持续改进也可能增加压缩天然气和液化石油气汽车的市场吸引力。
亚太地区是全球最大的汽车市场。儘管全球最大的汽车市场中国市场成长缓慢,但预计该地区将在预测期内引领压缩天然气和液化石油气汽车市场的成长。
因此,由于上述因素的综合作用,预计未来几年市场将显着成长。
CNG LPG汽车市场趋势
商用车推动 CNG 和 LPG 汽车需求
CNG 和 LPG 通常比传统汽油或柴油便宜。对于商用车业者来说,燃料成本占营运费用的很大一部分。 CNG 和 LPG 的成本较低,可以在车辆的整个使用寿命期间节省大量成本,使这些选择在经济上具有吸引力。与波动的石油市场相比,CNG和LPG价格整体稳定。这种稳定性使公司能够更好地预测和管理营运成本,这对商业营运至关重要。
全球日益严格的排放气体法规也是主要推动力。 CNG 和 LPG 汽车比柴油和汽油汽车排放更少的污染物,如氮氧化物 (NOx)、颗粒物 (PM) 和二氧化碳 (CO2)。 CNG和LPG汽车更符合环境标准,特别是在空气品质问题严重的都市区。
随着 CNG 和 LPG 加气站的扩建,这些燃料变得越来越容易取得。此类基础设施的发展通常是政府措施或私人组织与政府机构之间伙伴关係的结果。现代 CNG 和 LPG 汽车在性能、可靠性和燃油效率方面显着提高。因此,与传统燃油动力汽车的竞争日益加剧。
在天然气和液化石油气因国内生产而容易取得且价格低廉的地区,自然有利用这些资源的动力。世界上许多城市都设立了低排放气体区,不符合特定排放标准的车辆将被禁止通行或必须支付费用。 CNG 和 LPG 汽车通常符合这些标准,使其成为在都市区运营的公司的首选。
然而,天然气汽车提供的成本优势以及鼓励采用替代燃料汽车的政府支持政策正在推动全球 CNG/LPG 汽车市场的发展。例如
- 2022 年 11 月,印度新德里每公斤 CNG 的价格为 78.61 印度卢比,而汽油为每公升 96.72 印度卢比(1.16 美元),柴油为每公升 96.67 印度卢比(1.16 美元)(94 美分)。由于压缩天然气和汽油/柴油之间的巨大定价差异,以及压缩天然气汽车比汽油/柴油汽车更省油,过去几年印度压缩天然气汽车的销量几乎翻了一番。
因此,预计所有上述因素将在未来五年共同推动全球 CNG/LPG 汽车市场的发展。
预计亚太地区将成为预测期内最大的市场
在印度成长的推动下,亚太地区预计将成为全球最大的压缩天然气和液化石油气汽车市场。
亚太地区的城市是全球污染最严重的地区之一。 CNG 和 LPG 汽车比柴油和汽油汽车排放的污染物更少,这使其成为改善城市空气品质的有吸引力的选择。因此,许多国家都在关注排放法规的全球趋势。 CNG 和 LPG 汽车被认为是加强这些环境法规的实际步骤。
此外,全部区域的监管政策正在强化这一趋势。严格的排放控制政策,例如印度的巴拉特第六阶段排放标准,正在推动清洁燃料汽车(包括压缩天然气和液化石油气)的采用。此外,中国和印度等国家製定了促进替代燃料汽车的具体政策,将压缩天然气和液化石油气汽车纳入更广泛的碳减排策略。
技术进步大大提高了压缩天然气和液化石油气汽车的吸引力。车辆技术的改进不仅提高了性能和可靠性,还提高了效率。这些车辆的续航里程和加油时间得到了显着改善。补充这些技术进步的是加气基础设施的扩展,这对于压缩天然气和液化石油气汽车的生存至关重要。这种扩张,特别是在印度和中国,有助于使这些燃料更容易用于个人和商业用途。亚太地区市场动态的特点是汽车保有量大幅成长,这进一步增加了对压缩天然气和液化石油气汽车的需求。
由于天然气价格较低和采用更严格的排放法规,欧洲和北美预计将成为亚太地区之后的第二大市场。
CNG LPG汽车产业概况
CNG/LPG 汽车市场高度分散,由多个全球和本地参与者主导。主要企业包括现代、铃木、日产、大众和工业。大公司正在透过推出新产品和组建合资企业来巩固其市场地位。例如,
- 2022 年 8 月,大众集团商用车部门 Traton SE 旗下品牌斯堪尼亚向南非豪登省的 BridCam 经销商交付了全国第一辆纯专用卡车。
- 2022年1月,依维柯客车与象牙海岸共和国SOTRA合作,开始在当地组装配备CNG引擎的依维柯Daily Minibus。
- 2022年1月,Eicher(VECV)展出了4.9吨和5.9吨卡车的CNG车型。这些是 VECV 提供的最轻负载容量的卡车,但随着 CNG 站的占地面积预计在未来几年会增加,VECV 计划推出更高负载容量的CNG 卡车。
其他福利:
- Excel 格式的市场预测 (ME) 表
- 3 个月的分析师支持
目录
第一章简介
- 研究成果
- 研究场所
- 调查范围
第二章调查方法
第三章执行摘要
第四章市场动态
- 市场概况
- 市场驱动因素
- 对清洁能源的需求不断增长推动市场
- 市场限制因素
- 不断上升的安全疑虑正在限制市场
- 价值链/供应链分析
- 产业吸引力-波特五力分析
- 新进入者的威胁
- 买家/消费者的议价能力
- 供应商的议价能力
- 替代品的威胁
- 竞争公司之间敌对关係的强度
第五章市场区隔
- 按燃料类型
- 压缩天然气 (CNG)
- 液化石油气(LPG)
- 按车型分类
- 客车
- 商用车
- 按销售管道
- OEM
- 改造
- 按地区
- 北美洲
- 美国
- 加拿大
- 北美其他地区
- 欧洲
- 德国
- 英国
- 法国
- 俄罗斯
- 西班牙
- 其他欧洲国家
- 亚太地区
- 印度
- 中国
- 日本
- 韩国
- 其他亚太地区
- 世界其他地区
- 南美洲
- 中东/非洲
- 北美洲
第六章 竞争状况
- 供应商市场占有率
- 併购
- 公司简介
- Hyundai Motor Company
- Suzuki Motor Corporation
- Nissan Motor Co. Ltd
- Volkswagen AG
- Honda Motor Company
- IVECO SpA
- AB VOLVO
- Ford Motor Company
- Tata Motors Limited
- Traton SE
第七章 市场机会及未来趋势
第8章 定制
- 市场数量(个)
The CNG LPG Vehicle Market size is estimated at USD 6.73 billion in 2024, and is expected to reach USD 10.13 billion by 2029, growing at a CAGR of 7% during the forecast period (2024-2029).
The global market for CNG and LPG vehicles has been growing, driven by increasing environmental concerns, rising fuel prices, and the push for energy diversification. In recent years, significant improvements have been made in CNG and LPG vehicle technologies, including fuel storage, engine efficiency, and safety features. These advancements have made CNG and LPG vehicles more competitive in terms of performance and reliability.
Lower operational costs due to cheaper CNG and LPG compared to petrol and diesel are significant drivers. This aspect is particularly appealing for commercial and high-mileage vehicles. Stricter emission regulations worldwide are boosting the adoption of CNG and LPG vehicles, as they emit fewer pollutants compared to conventional fuels.
With the global shift toward sustainable energy, CNG and LPG vehicles are likely to maintain their relevance, especially in regions where electric vehicle infrastructure is lagging. Continuous improvements in vehicle technology and fuel infrastructure may also enhance the market appeal of CNG and LPG vehicles.
Asia-Pacific is the largest market for automobiles in the world. The region, despite the sluggish growth in the Chinese market, the largest automobile market in the world, is expected to lead the growth in the CNG and LPG vehicles market during the forecast period.
Thus, the confluence of the aforementioned factors is expected to produce significant growth in the market in the coming years.
CNG LPG Vehicle Market Trends
Commercial Vehicles Fueling the Demand for CNG and LPG Vehicle
CNG and LPG are often cheaper than traditional petrol and diesel fuels. For commercial vehicle operators, fuel cost is a significant portion of operating expenses. The lower cost of CNG and LPG can translate into substantial savings over the lifetime of the vehicle, making these options financially attractive. Compared to the more volatile oil market, CNG and LPG prices are generally more stable. This stability allows businesses to better forecast and manage their operating costs, which is crucial for commercial operations.
Increasingly stringent emission regulations worldwide are a significant driver. CNG and LPG vehicles emit fewer pollutants such as nitrogen oxides (NOx), particulate matter (PM), and carbon dioxide (CO2) compared to diesel and petrol vehicles. In urban areas, especially where air quality is a major concern, CNG and LPG vehicles are more compliant with environmental standards.
The expansion of CNG and LPG fueling stations has made these fuels more accessible. This infrastructure development is often a result of either government initiatives or partnerships between private entities and government bodies. Modern CNG and LPG vehicles have seen significant improvements in terms of performance, reliability, and fuel efficiency. This makes them more competitive with traditional fuel vehicles.
In regions where natural gas or LPG is readily available and less expensive due to domestic production, there is a natural inclination to utilize these resources. Many cities worldwide are introducing low-emission zones where vehicles that do not meet certain emission standards are either banned or subject to a fee. CNG and LPG vehicles often meet these standards, making them a viable option for businesses operating within urban areas.
However, the cost advantage offered by natural gas vehicles and supportive government policies to encourage the adoption of alternative fuel-powered vehicles is driving the global CNG and LPG vehicle market. For instance,
- In November 2022, 1 kg of CNG was priced at INR 78.61 (94 cents) compared to petrol, which cost INR 96.72 (USD 1.16) per liter, and diesel, which was priced at INR 96.67 (USD 1.16) per liter in New Delhi, India. This substantial difference in CNG and petrol/diesel pricing and the higher mileage of CNG vehicles than petrol/diesel vehicles has almost doubled the sales of CNG vehicles in India over the past few years.
Thus, the combination of all the above factors is anticipated to propel the market for CNG and LPG vehicles worldwide over the next five years.
Asia-Pacific Region is Expected to be the Largest Market During the Forecast Period
Asia-Pacific is forecasted to be the largest market for CNG and LPG vehicles in the world, led by the growth in India.
Cities in Asia-Pacific are among the most polluted globally. CNG and LPG vehicles emit fewer pollutants compared to diesel and petrol vehicles, making them attractive options for improving urban air quality. Therefore, many countries are aligned with global trends in emission standards. CNG and LPG vehicles are seen as practical steps toward meeting these stricter environmental regulations.
Moreover, regulatory policies across the region reinforce this trend. Stringent emission control policies, such as India's Bharat Stage VI emission standards, have expedited the adoption of cleaner fuel vehicles, including CNG and LPG. Furthermore, countries like China and India have specific policies promoting alternative fuel vehicles, situating CNG and LPG vehicles within broader carbon reduction strategies.
Technological advancements significantly contribute to the attractiveness of CNG and LPG vehicles. Improvements in vehicle technology have not only enhanced performance and reliability but also increased efficiency. The range and refueling times of these vehicles have seen marked improvements. Complementing these technological strides is the expansion of refueling infrastructure, which is critical for the practicality of CNG and LPG vehicles. This expansion, notably in India and China, has been instrumental in making these fuels more accessible for both personal and commercial use. The market dynamics of the Asia-Pacific region are characterized by a vast and growing vehicle population that further fuels the demand for CNG and LPG vehicles.
Following Asia-Pacific, Europe and North America are predicted to be the next biggest markets due to lower prices of natural gas and the adoption of stringent emission norms.
CNG LPG Vehicle Industry Overview
The CNG and LPG vehicle market is highly fragmented and dominated by several global and local players. Some of the major players are Hyundai Motor Company, Suzuki Motor Corporation, Nissan Motor Co. Ltd, Volkswagen AG, and Honda Motor Company. The major companies are launching new products and forming joint ventures to cement their market position. For instance,
- In August 2022, Scania, a brand of Traton SE, the Volkswagen Group commercial vehicle division, delivered the country's first dedicated natural gas truck to BridCam Distributors in Gauteng, South Africa.
- In January 2022, Iveco Bus partnered with SOTRA in Ivory Coast, Africa, to start the local assembly of CNG-powered Iveco Daily Minibus.
- In January 2022, Eicher (VECV) showcased CNG variants of its 4.9 and 5.9-metric-ton trucks, typically used in last-mile delivery operations by fleet owners. While these are the lightest payload trucks VECV offers, the automaker plans to bring in CNG trucks with higher payloads as the footprint of CNG stations is likely to increase in the coming years.
Additional Benefits:
- The market estimate (ME) sheet in Excel format
- 3 months of analyst support
TABLE OF CONTENTS
1 INTRODUCTION
- 1.1 Study Deliverables
- 1.2 Study Assumptions
- 1.3 Scope of the Study
2 RESEARCH METHODOLOGY
3 EXECUTIVE SUMMARY
4 MARKET DYNAMICS
- 4.1 Market Overview
- 4.2 Market Drivers
- 4.2.1 Increase in Demand for Clean Energy Driving the Market
- 4.3 Market Restraints
- 4.3.1 Rising Safety Concerns is Antcipated to Restrain the Market
- 4.4 Value Chain/Supply Chain Analysis
- 4.5 Industry Attractiveness - Porter's Five Forces Analysis
- 4.5.1 Threat of New Entrants
- 4.5.2 Bargaining Power of Buyers/Consumers
- 4.5.3 Bargaining Power of Suppliers
- 4.5.4 Threat of Substitute Products
- 4.5.5 Intensity of Competitive Rivalry
5 MARKET SEGMENTATION
- 5.1 By Fuel Type
- 5.1.1 Compressed Natural Gas (CNG)
- 5.1.2 Liquefied Petroleum Gas (LPG)
- 5.2 By Vehicle Type
- 5.2.1 Passenger Cars
- 5.2.2 Commercial Vehicles
- 5.3 By Sales Channel
- 5.3.1 OEM
- 5.3.2 Retrofitting
- 5.4 By Geography
- 5.4.1 North America
- 5.4.1.1 United States
- 5.4.1.2 Canada
- 5.4.1.3 Rest of North America
- 5.4.2 Europe
- 5.4.2.1 Germany
- 5.4.2.2 United Kingdom
- 5.4.2.3 France
- 5.4.2.4 Russia
- 5.4.2.5 Spain
- 5.4.2.6 Rest of Europe
- 5.4.3 Asia-Pacific
- 5.4.3.1 India
- 5.4.3.2 China
- 5.4.3.3 Japan
- 5.4.3.4 South Korea
- 5.4.3.5 Rest of Asia-Pacific
- 5.4.4 Rest of the World
- 5.4.4.1 South America
- 5.4.4.2 Middle East and Africa
- 5.4.1 North America
6 COMPETITIVE LANDSCAPE
- 6.1 Vendor Market Share
- 6.2 Mergers & Acquisitions
- 6.3 Company Profiles
- 6.3.1 Hyundai Motor Company
- 6.3.2 Suzuki Motor Corporation
- 6.3.3 Nissan Motor Co. Ltd
- 6.3.4 Volkswagen AG
- 6.3.5 Honda Motor Company
- 6.3.6 IVECO SpA
- 6.3.7 AB VOLVO
- 6.3.8 Ford Motor Company
- 6.3.9 Tata Motors Limited
- 6.3.10 Traton SE
7 MARKET OPPORTUNITIES AND FUTURE TRENDS
8 CUSTOMIZATION
- 8.1 Market Volume In Units
 CNG坦克的全球市场(~2035年):汽缸坦克各类型,各汽缸复合材料类型,各汽缸车辆类型,各类型企业,各地区,产业趋势,预测
 全球 CNG 和 LPG 汽车市场
 全球 CNG 储槽市场研究报告 - 产业分析、规模、份额、成长、趋势及 2025 年至 2033 年预测
 2025年全球CNG和LPG汽车市场报告CNG 和 LPG 汽车市场机会、成长动力、产业趋势分析及 2025 - 2034 年预测
 印度 CNG 汽车市场:市场占有率分析、行业趋势和统计数据、成长预测(2025-2030 年)非洲的 CNG 和 LPG 车辆:市场占有率分析、行业趋势和成长预测(2025-2030 年)
 CNG 摩托车市场按产品类型、引擎类型、控制系统、引擎容量、燃料箱容量和最终用户划分 - 2025-2030 年全球预测
 全球 CNG 储罐市场按车辆类型、储罐类型、材料类型、应用和地区划分 - 预测至 2029 年压缩气体市场规模、份额、趋势分析报告(按产品、最终用途、分销管道、地区、细分市场预测),2025 年至 2030 年