


 |
市场调查报告书
商品编码
1631569
美国火力发电 -市场占有率分析、产业趋势/统计、成长预测(2025-2030)US Thermal Power - Market Share Analysis, Industry Trends & Statistics, Growth Forecasts (2025 - 2030) |
||||||
※ 本网页内容可能与最新版本有所差异。详细情况请与我们联繫。
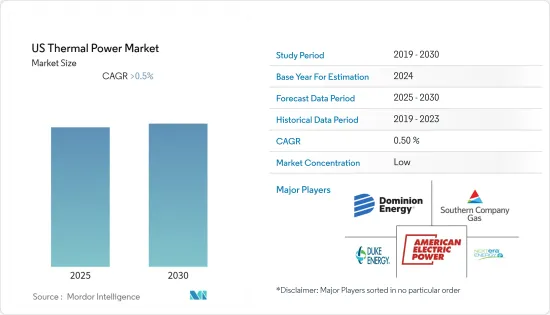
预计美国火力发电市场在预测期内的复合年增长率将超过 0.5%。
由于电力需求减少,COVID-19 爆发对市场产生了负面影响。目前市场已恢復至疫情前的水准。
美国火力发电市场预计将受到过去十年天然气价格下跌的推动。此外,私人公司和一些州政府增加对火力发电厂的投资预计也将在预测期内推动美国火力发电市场。
然而,可再生能源价格的下降提供了经济上可行的清洁替代能源,预计这将抑制市场成长。
提高发电工程的效率和减少有害排放可能会在未来开闢新的市场。
美国火力发电市场趋势
天然气预计将主导市场
- 天然气是最清洁的燃料之一,可以经济地以工业规模发电。在美国,燃气发电已经开始取代燃煤发电,并预计在未来几十年内完全取代。儘管再生能源投资预计将大幅成长,但燃气发电提供的灵活性预计仍将受到需求。
- 天然气发电厂的最大推动力之一是,当风能和太阳能等可再生能源不可靠时,天然气发电厂可用作备用电源。天然气发电厂可以快速开始运行,提高电网的可靠性。
- 到2021年,天然气预计将成为美国最大的发电来源。全国天然气发电量1,693.8兆瓦时,占总发电量的38.4%。
- 美国页岩油气产量大幅增加,大幅降低美国对全球能源供应链的依赖。天然气价格下降进一步支撑了天然气发电市场的成长。
因此,鑑于上述几点,天然气产业很可能在预测期内主导市场成长。
火力发电投资增加可望带动市场
- 在美国,建立火力发电厂的路径因州而异。例如,加州以天然气为主,但该州正在鼓励电力公司以自然能源和其他能源取代天然气发电厂。其他州,如中西部地区,正在采取更多以天然气为基础的方法来满足其能源需求。
- 2021年,煤炭、天然气、石油等能源来源约占全国发电总量的63%。随着时间的推移,特别是近年来,国家发电能源来源的组成发生了变化。
- 儘管燃煤发电量的份额逐渐下降,但由于燃气电厂的增加,预计预测期内该国整体火力发电量将增加。
- 2022 年 7 月,密西根州西南部一座天然气发电厂开始运作。该计划耗资11亿美元,由Kiewit公司建造,采用通用电气公司的设备。
- 因此,鑑于以上几点,火力发电投资的增加预计将在预测期内带动美国火力发电市场。
美国火力发电产业概况
美国火力发电市场适度细分。该市场的主要企业(排名不分先后)包括 NextEra Energy, Inc.、Dominion Energy, Inc.、Duke Energy Corporation、Southern Company 和 American Electric Power Company, Inc.。
其他好处
- Excel 格式的市场预测 (ME) 表
- 3 个月分析师支持
目录
第一章简介
- 调查范围
- 市场定义
- 研究场所
第二章调查方法
第三章执行摘要
第四章市场概况
- 介绍
- 火力发电结构(2022年)
- 火力发电容量(GW)(2028年)
- 火力发电量(太瓦时)(2022年)
- 美国运作中的火力发电厂数量(2022年)
- 2022年新增实际火力发电能力、取消及现有火力发电能力变化情形
- 到 2022 年基于石化燃料的公用事业规模发电机的容量係数(百分比)
- 最新趋势和发展
- 政府法规和措施
- 市场动态
- 促进因素
- 抑制因素
- 供应链分析
- PESTLE分析
第五章 依供应来源分類的市场细分
- 煤炭
- 天然气
- 油
第六章 竞争状况
- 併购、合资、联盟、协议
- 主要企业策略
- Companies Profiles
- NextEra Energy Inc.
- Dominion Energy Inc.
- Duke Energy Corporation
- Southern Company
- American Electric Power Company Inc.
- Exelon Corporation
- Xcel Energy Inc
- Public Service Enterprise Group Inc.
第七章 市场潜力及未来趋势
The US Thermal Power Market is expected to register a CAGR of greater than 0.5% during the forecast period.
The market was negatively impacted by the outbreak of COVID-19 due to a decrease in electricity demand. The market has currently rebounded to pre-pandemic levels.
The United States thermal power market is expected to be driven by things like the price of natural gas going down over the past 10 years. Also, the increasing investments in thermal power plants from private firms and several state governments are expected to drive the United States thermal power market during the forecast period.
However, reducing the price of renewable energy has provided an economically viable cleaner alternative, which is expected to restrain the market's growth.
The improvements in efficiency and decreases in harmful emissions from thermal power projects are likely to open up new markets in the future.
US Thermal Power Market Trends
Natural Gas Expected to Dominate the Market
- Natural gas is among the cleanest fuels and can provide electricity at an industrial scale on an economically sound basis. Gas-fired power generation has already started to displace coal capacity in the country and is expected to replace it entirely in the coming decades. Although investments in renewables are expected to grow significantly, the flexibility afforded by gas-fired power generation is expected to continue to be in demand.
- Among the most significant drivers of the natural gas thermal power plants is their use as backup power for unreliability in renewable sources like wind and solar. Natural gas plants can start running on short notice, which can increase the utility grid's reliability.
- In 2021, natural gas was projected to be the largest source of electricity generation in the United States. The electricity generation from natural gas in the country was 1693.8 terawatt-hours, which accounted for 38.4% of the total electricity generated in the country.
- The country has seen a significant increase in shale oil and gas production, drastically reducing the United States' dependence on global energy supply chains. Reductions in natural gas prices have further aided the growth of the natural gas thermal power market.
Therefore, owing to the above points, the natural gas segment is likely to dominate market growth during the forecast period.
Increasing Investments in Thermal Power Expected to Drive the Market
- In the United States, different states are following different paths to establish thermal power plants. For example, the state of California is dominated by natural gas, but the state is pushing its utilities to replace natural gas power plants with renewables and other resources. Other states, like those in the Midwest, are following a more natural gas-based approach for their energy needs.
- In 2021, sources such as coal, natural gas, and petroleum accounted for around 63% of the country's total electricity generation mix. The mix of energy sources for the country's electricity generation changed over time, especially in recent years.
- Although the share of coal-fired power generation capacity is gradually decreasing, the increasing number of gas-fired power plants is expected to boost the country's overall thermal power generation capacity during the forecast period.
- In July 2022, a natural gas-fired power plant entered service in southwest Michigan. The cost of the project was USD 1.1 billion, and it was built by Kiewit Corporation and features equipment from General Electric.
- Therefore, owing to the above points, increasing thermal power investments are expected to drive the United States thermal power market during the forecast period.
US Thermal Power Industry Overview
The United States thermal power market is moderately fragmented. Some of the key players in this market (in no particular order) include NextEra Energy, Inc.; Dominion Energy, Inc.; Duke Energy Corporation; Southern Company; and American Electric Power Company, Inc.
Additional Benefits:
- The market estimate (ME) sheet in Excel format
- 3 months of analyst support
TABLE OF CONTENTS
1 INTRODUCTION
- 1.1 Scope of the Study
- 1.2 Market Definition
- 1.3 Study Assumptions
2 RESEARCH METHODOLOGY
3 EXECUTIVE SUMMARY
4 MARKET OVERVIEW
- 4.1 Introduction
- 4.2 Thermal Power Generation Mix, 2022
- 4.3 Thermal Power Installed Capacity and Forecast in GW, until 2028
- 4.4 Thermal Power Generation in TWh, till 2022
- 4.5 Number of Thermal Power Plants Operating in the United States, till 2022
- 4.6 Utility-Scale Capacity Additions, Retirements, and Changes to Existing Thermal Power Generation Capacity, 2022
- 4.7 Capacity Factors for Utility-Scale Generators Primarily Using Fossil Fuels, in %, till 2022
- 4.8 Recent Trends and Developments
- 4.9 Government Policies and Regulations
- 4.10 Market Dynamics
- 4.10.1 Drivers
- 4.10.2 Restraints
- 4.11 Supply Chain Analysis
- 4.12 PESTLE Analysis
5 MARKET SEGEMENTATION - BY SOURCE
- 5.1 Coal
- 5.2 Natural Gas
- 5.3 Petroleum
6 COMPETITIVE LANDSCAPE
- 6.1 Mergers and Acquisitions, Joint Ventures, Collaborations, and Agreements
- 6.2 Strategies Adopted by Leading Players
- 6.3 Companies Profiles
- 6.3.1 NextEra Energy Inc.
- 6.3.2 Dominion Energy Inc.
- 6.3.3 Duke Energy Corporation
- 6.3.4 Southern Company
- 6.3.5 American Electric Power Company Inc.
- 6.3.6 Exelon Corporation
- 6.3.7 Xcel Energy Inc
- 6.3.8 Public Service Enterprise Group Inc.
