


 |
市场调查报告书
商品编码
1635524
北美抽水蓄能能源:市场占有率分析、产业趋势与成长预测(2025-2030)North America Pumped Hydro Storage - Market Share Analysis, Industry Trends & Statistics, Growth Forecasts (2025 - 2030) |
||||||
价格
※ 本网页内容可能与最新版本有所差异。详细情况请与我们联繫。
简介目录
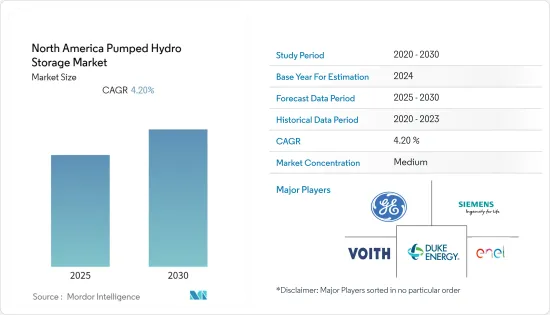
北美抽水蓄能能源市场预计在预测期内复合年增长率为4.2%。
2020 年市场受到 COVID-19 大流行的负面影响。目前市场处于大流行前的水平。
主要亮点
- 从长远来看,可变再生能源来源的整合和确保电网稳定性等各种因素预计将在预测期内推动抽水蓄能水力发电(PHS)市场的发展。
- 另一方面,PHS计划的环境和社会影响以及来自其他能源储存技术的日益激烈的竞争预计将在预测期内限制市场研究。
- 美国和加拿大目前正在开发多种新型PSH技术,未来预计将增加PSH技术在能源储存的开发和采用,同时降低成本和环境影响,因此,市场将出现一些机会。
- 由于全国发电工程的增加,美国预计将主导市场。
北美抽水蓄能发电市场趋势
闭合迴路市场预计将主导市场
- 在闭合迴路系统中,建造抽水蓄能电站并人工建造一个或两个水库,并且没有自然水流入任一水库。储存大量能量的唯一方法是将一大片水体放置在靠近第二个水体的地方,但尽可能高。在某些地方,这种情况自然发生。在某些地方,一个或两个水体都是人工创造的。抽水蓄能係统的能量密度较低,导致水库之间的高差和流量较大。
- 闭合迴路抽水蓄能具有高度灵活性、可靠性和高功率。闭合迴路抽水蓄能係统比开放回路抽水蓄能係统对环境的影响较小,因为它们不与现有河流系统连接。此外,它可以安装在需要电网支援的地方,因此无需安装在现有河流附近。
- 截至2021年,美国抽水蓄能发电容量已达到约2,191.2万千瓦,较近年有所成长。根据美国能源局太平洋西北国家实验室 (PNNL) 科学家 2021 年发布的一项研究,近年来闭合迴路系统的初步许可和许可申请数量大幅增加。
- 此外,2022年6月,美国能源局水力发电技术办公室调查并宣布,全国有数千个地点适合闭合迴路抽水蓄能发电。美国闭合迴路蓄能能源资源评估是一项旨在确定闭合迴路PSH站点的大规模研究,对于开发商和相关人员来说是重要的参考。该研究以 30 公尺分辨率进行了空间测绘,并确定了近 15,000 个未来可以最有效地部署这种 PSH 技术的位置。
- 鑑于上述几点和近期趋势,预计闭合迴路将在预测期内占据市场主导地位。
美国主导市场
- 美国是该地区最大的水力发电用户,也是抽水蓄能等现代化水力发电能源储存系统的重要用户。政府正在努力增加该国的水力发电能力。
- 抽水蓄能水力发电系统通常将水抽入上水库所使用的电力多于利用所储存的水发电的电力。 2021年,美国抽水蓄能夏季净发电量排名前五的州为加州、维吉尼亚、南卡罗来纳州、密西根州和乔治亚。
- 2022年5月,联邦能源管理委员会报告称,批准了27个抽水发电工程,总设备容量约为1,890万千瓦。其中运作中24个,总设备容量约16.5GW。此外,自 2014 年初以来,FERC 已向三个拟议的抽水发电工程颁发了许可证。其余的抽水蓄能电站是联邦政府拥有的设施,例如田纳西河谷管理局的浣熊山电站,还有一些由美国陆军工兵团营运。
- 此外,2022 年 10 月,美国能源局水电技术办公室倡议,鼓励电力开发商和其他机构透过弹性电力系统水力发电和水创新 (HydroWIRES) 提升水力发电在电网中的作用倡议宣布为感兴趣的相关人员提供获得技术援助的机会。此技术援助机会旨在为开发商和相关人员提供专业知识和能力,以解决抽水发电工程开发中的评估障碍。
- 鑑于上述情况,预计美国将在预测期内主导抽水蓄能能源市场。
北美抽水蓄能能源产业概况
北美抽水蓄能能源市场适度细分。该市场的主要企业包括(排名不分先后)通用电气公司、西门子股份公司、Enel SpA、杜克能源公司和 Voith GmbH &Co.KGaA。
其他好处
- Excel 格式的市场预测 (ME) 表
- 3 个月分析师支持
目录
第一章简介
- 调查范围
- 市场定义
- 研究场所
第 2 章执行摘要
第三章调查方法
第四章市场概况
- 介绍
- 至2027年市场规模及需求预测(单位:十亿美元)
- 北美抽水蓄能发电容量(GW)及预测至2027年
- 北美水力发电装置容量及预测(GW 基数,2027 年)
- 北美水力发电量(太瓦时,2013-2021)
- 最新趋势和发展
- 政府法规和措施
- 市场动态
- 促进因素
- 抑制因素
- 供应链分析
- 波特五力分析
- 供应商的议价能力
- 消费者议价能力
- 新进入者的威胁
- 替代品的威胁
- 竞争公司之间敌对关係的强度
第五章市场区隔
- 按类型
- 开放回路
- 闭合迴路
- 按地区
- 美国
- 加拿大
- 墨西哥
第六章 竞争状况
- 併购、合资、联盟、协议
- 主要企业策略
- 公司简介
- General Electric Company
- Siemens AG
- Enel SpA
- Duke Energy Corporation
- Voith GmbH & Co. KGaA
第七章 市场机会及未来趋势
简介目录
Product Code: 93041
The North America Pumped Hydro Storage Market is expected to register a CAGR of 4.2% during the forecast period.
The market was negatively impacted by the COVID-19 pandemic in 2020. Presently, the market has reached pre-pandemic levels.
Key Highlights
- Over the long term, various factors, such as the integration of variable renewable energy sources and ensuring grid stability, are expected to drive the pumped hydro storage (PHS) market during the forecast period.
- On the other hand, the environmental and social impacts of PHS projects, coupled with increasing competition from other energy storage technologies, are expected to restrain the market studied during the forecast period.
- Nevertheless, several novel PSH technologies are currently under development in the United States and Canada, which are expected to increase the development and deployment of PSH technology for energy storage while reducing costs and environmental impacts in the future, thus creating several opportunities for the market during the forecast period.
- The United States is expected to dominate the market due to growing pumped hydro storage projects across the country.
North America Pumped Hydro Storage Market Trends
Closed-loop Segment Expected to Dominate the Market
- In closed-loop systems, pumped hydro storage plants are created, in which one/both the reservoirs are artificially built, and no natural inflows of water are involved with either reservoir. The only way to store a substantial amount of energy is by locating a large body of water near the second body of water but as high above as possible. In some places, this happens naturally. In others, one or both water bodies are artificial. The moderately low energy density of pumped storage systems entails either large differences in height or large flows between reservoirs.
- Closed-loop pumped hydro storage offers high flexibility, reliability, and high-power output. Since the closed-loop pumped-hydro systems are not connected to existing river systems, their impact on the environment is less compared to open-loop pumped hydro storage systems. Moreover, they can be located where support to the grid is required and therefore do not need to be positioned near an existing river.
- As of 2021, the pumped hydro storage capacity of the United States reached around 21.912 GW, which is growing compared with recent years. According to a study published by scientists from the US Department of Energy's Pacific Northwest National Laboratory (PNNL) in 2021, the number of preliminary permits and licensing applications for closed-loop systems has considerably increased in recent years.
- Furthermore, in June 2022, the US Department of Energy's Water Power Technologies Office researched and stated that thousands of locations across the country are suitable for closed-loop pumped storage hydropower. The closed-loop pumped storage hydropower resource assessment for the United States is a large-scale study to identify closed-loop PSH sites and an important reference for developers and stakeholders. The study used spatial mapping at 30-meter resolution and identified nearly 15,000 sites where this PSH technology can be best deployed in the future.
- Owing to the above points and recent developments, the closed loop segment is expected to dominate the market during the forecast period.
United States to Dominate the Market
- The United States is the largest user of hydropower in the region and a considerable user of modern water energy storage systems like pumped hydro storage. The government is pushing to increase the installed hydro capacity of the country.
- Pumped-storage hydroelectric systems generally use more electricity to pump water to upper water storage reservoirs than they produce with stored water. In 2021, the top five states in the United States with respect to pumped-storage hydroelectricity net summer generation capacity were California, Virginia, South Carolina, Michigan, and Georgia.
- Going forward, in May 2022, the Federal Energy Regulatory Commission reported 27 licensed pumped storage projects with a total installed capacity of nearly 18.9 GW. Of these, 24 are in operation with a total capacity of about 16.5 GW. Furtherly, FERC has issued licenses for three proposed pumped storage projects since the beginning of 2014. The remaining pumped storage plants are federally owned facilities, like the Tennessee Valley Authority's Raccoon Mountain plant, and several operated by the US Army Corps of Engineers.
- Furthermore, in October 2022, the US Department of Energy's Water Power Technologies Office announced an opportunity for power developers and other stakeholders to receive technical assistance to advance hydropower's role on the electric grid through the Hydropower and Water Innovation for a Resilient Electricity System (HydroWIRES) initiative. The technical assistance opportunity aims to provide the developers and stakeholders with national lab expertise and capabilities to address valuation hurdles in pumped hydro storage project development.
- Owing to the above points, the United States is expected to dominate the pumped hydro storage market during the forecast period.
North America Pumped Hydro Storage Industry Overview
The North American pumped hydro storage market is moderately fragmented. Some of the key players in the market (in no particular order) include General Electric Company, Siemens AG, Enel SpA, Duke Energy Corporation, and Voith GmbH & Co. KGaA, among others.
Additional Benefits:
- The market estimate (ME) sheet in Excel format
- 3 months of analyst support
TABLE OF CONTENTS
1 INTRODUCTION
- 1.1 Scope of the Study
- 1.2 Market Definition
- 1.3 Study Assumptions
2 EXECUTIVE SUMMARY
3 RESEARCH METHODOLOGY
4 MARKET OVERVIEW
- 4.1 Introduction
- 4.2 Market Size and Demand Forecast in USD billion, till 2027
- 4.3 North America Pumped Hydro Installed Capacity and Forecast in GW, till 2027
- 4.4 North America Hydro Power Installed Capacity and Forecast in GW, till 2027
- 4.5 North America Hydroelectricity Generation in TWh, 2013-2021
- 4.6 Recent Trends and Developments
- 4.7 Government Policies and Regulations
- 4.8 Market Dynamics
- 4.8.1 Drivers
- 4.8.2 Restraints
- 4.9 Supply Chain Analysis
- 4.10 Porter's Five Forces Analysis
- 4.10.1 Bargaining Power of Suppliers
- 4.10.2 Bargaining Power of Consumers
- 4.10.3 Threat of New Entrants
- 4.10.4 Threat of Substitute Products and Services
- 4.10.5 Intensity of Competitive Rivalry
5 MARKET SEGMENTATION
- 5.1 By Type
- 5.1.1 Open-loop
- 5.1.2 Closed-loop
- 5.2 By Geography
- 5.2.1 United States
- 5.2.2 Canada
- 5.2.3 Mexico
6 COMPETITIVE LANDSCAPE
- 6.1 Mergers and Acquisitions, Joint Ventures, Collaborations, and Agreements
- 6.2 Strategies Adopted by Leading Players
- 6.3 Company Profiles
- 6.3.1 General Electric Company
- 6.3.2 Siemens AG
- 6.3.3 Enel SpA
- 6.3.4 Duke Energy Corporation
- 6.3.5 Voith GmbH & Co. KGaA
7 MARKET OPPORTUNITIES AND FUTURE TRENDS
02-2729-4219
+886-2-2729-4219
 抽水蓄能水力发电市场:2026-2032 年全球市场预测,计划开发阶段、容量范围、最终用户、技术类型和应用划分。
 2026年全球抽水蓄能市场报告
 抽水蓄能市场-全球产业规模、份额、趋势、机会及预测(依系统、应用、区域及竞争格局划分,2021-2031年)大型能源储存系统市场(按储能技术、容量范围、持续时间、所有权类型、配置、应用和最终用户划分)-2026年至2032年全球预测
 抽水蓄能水电市场规模、份额及成长分析(按类型、储能容量、抽水蓄能机组容量、计划类型、最终用户及地区划分)-2026-2033年产业预测
 抽水蓄能水力发电市场预测至2032年:按类型、容量、应用、最终用户和地区分類的全球分析
 抽水蓄能发电市场(按类型和地区划分)
 抽水蓄能发电:市场占有率分析、产业趋势与统计、成长预测(2025-2030 年)亚太地区抽水蓄能:市场占有率分析、产业趋势与成长预测(2025-2030 年)南美洲抽水蓄能储能:市场占有率分析、产业趋势与成长预测(2025-2030)
▼