


 |
市场调查报告书
商品编码
1636163
合规排碳权:市场占有率分析、产业趋势、成长预测(2025-2030)Compliance Carbon Credit - Market Share Analysis, Industry Trends & Statistics, Growth Forecasts (2025 - 2030) |
||||||
※ 本网页内容可能与最新版本有所差异。详细情况请与我们联繫。
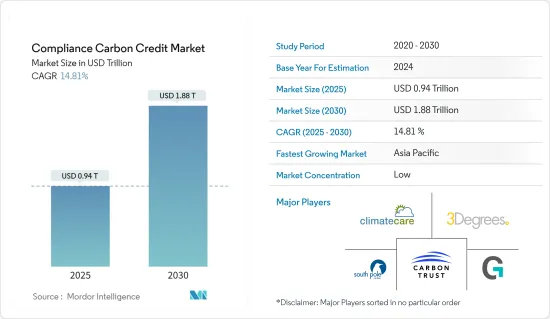
合规排碳权市场规模预计到 2025 年将达到 9,400 亿美元,到 2030 年将达到 1.88 兆美元,预测期内(2025-2030 年)复合年增长率为 14.81%。
合规性排碳权市场在限制温室气体排放的法律规范下运作,例如排放交易体系(ETS)和总量管制与交易体系。其主要功能是为工业、发电厂和运输部门等受排放法规约束的营业单位提供一种机制,透过购买排碳权来履行其合规义务。
由于不同国家和地区引入了排放权交易体系和法律规范,监管情况也各不相同。主要合规市场包括欧盟排放交易体系 (EU ETS)、加州的总量管制与交易计画、区域温室气体倡议 (RGGI) 以及中国、韩国和纽西兰的各种国家计画。
合规排碳权来自各种排放计划,包括可再生能源装置(例如风能、太阳能)、能源效率措施、林业和土地利用计划(例如造林、重新造林)以及工业流程改善。
合规排碳权市场趋势
英国脱欧后英国排放交易体系为碳定价定下了基调
- 2020年脱欧后,英国以碳定价机制UK-ETS取代了对EU-ETS的参与。此举允许英国建立排放交易体系并制定独立于欧盟的碳定价政策。
- 自2021年1月推出以来,英国排放交易计画(UK-ETS)中交易的排放排放(UKA)价格经历了大幅波动。据行业专家称,价格于2022年8月19日触及每吨97.75英镑的高位,显示强劲的需求和监管因素正在推动价格走高。然而,2023年5月31日,价格跌至每吨51.04英镑,为2022年1月之前记录的最低价格。影响价格下跌的因素可能有多种,包括市场状况的变化、监管调整以及供需动态的变化。
- 2022 年,UK-ETS 产生了总计 4.3 英镑的可观收益。该收益代表了碳价格对英国受监管营业单位的财务影响,包括工业设施、发电厂和排放交易计划涵盖的其他部门。碳排放收益反映了这些营业单位的合规成本,并有助于政府为气候相关措施和投资提供资金。
可再生能源发电的投资和创新将推动排碳权的产生
- 许多能源公司正在投资风能、水力发电和太阳能等可再生能源,以减少碳排放。这种向清洁能源发电的转变创造了从可再生能源计划中产生合规排碳权的机会。
- 例如,2024 年 2 月,智利在欧洲寻求太阳能、风能和绿氢技术投资者,以使铜矿和其他依赖石化燃料的产业脱碳。在欧盟-智利贸易和投资协定重新谈判期间,代表102家公共和私人公司的氢能协会H2Chile主席Marcos Kurka前往欧洲介绍了政府的能源战略。
- 此外,产业专家认为,区块链技术可以透过与MRV(数位监控、报告和检验)系统整合来增强碳市场中排碳权的检验。 MRV 系统从卫星影像、物联网感测器和监控系统等各种来源收集资料。数位 MRV资料经过哈希处理并上传到区块链以检验排碳权。智慧合约透过确保排碳权仅发放给符合特定标准的计划来自动化检验流程。使用去中心化的Oracle,可以将链下资讯来源添加到检验过程中,从而实现即时排碳权检验。
合规排碳权产业概览
各种认证机构和标准机构根据预先定义的标准和方法对排放计划进行认证并发放碳信用。认证机构之间可能存在竞争,以吸引寻求认证服务的计划开发商,认证费用、时间表和声誉的差异会影响认证机构的选择。排碳权价格和市场动态可能会随着时间的推移以及不同市场之间的大幅波动,导致定价、流动性和市场行为的分散。这种波动使市场参与企业难以有效预测和驾驭市场状况。 Carbon Trust、Climate Care、3Degrees 等公司正在参与碳信用市场。
其他好处:
- Excel 格式的市场预测 (ME) 表
- 3 个月的分析师支持
目录
第一章简介
- 研究成果
- 研究场所
- 调查范围
第二章调查方法
第三章执行摘要
第四章市场洞察
- 目前的市场状况
- 科技趋势
- 产业价值链分析
- 政府法规和倡议
第五章市场动态
- 促进因素
- 强化法规政策
- 加大企业永续性努力
- 抑制因素
- 市场复杂性和不确定性
- 机会
- 创新和技术进步
- 产业吸引力-波特五力分析
- 供应商的议价能力
- 消费者/买方议价能力
- 新进入者的威胁
- 替代品的威胁
- 竞争公司之间敌对关係的强度
第六章 市场细分
- 按信用类型
- 可再生能源计划
- 林业和土地利用
- 能源效率
- 工业流程改进
- 按行业分类
- 能源部门
- 交通运输部门
- 工业部门
- 农业/林业
- 按地区
- 北美洲
- 美国
- 加拿大
- 欧洲
- 英国
- 德国
- 法国
- 其他欧洲国家
- 亚太地区
- 中国
- 日本
- 印度
- 韩国
- 其他亚太地区
- 中东/非洲
- 拉丁美洲
- 北美洲
第七章 竞争格局
- 公司简介
- Carbon Trust
- ClimateCare
- 3Degrees
- South Pole
- Gold Standard
- Natural Capital Partners
- Shell New Energies
- Sustainable Travel International
- Forest Carbon
- Atmosfair
- 其他公司
第八章 市场机会及未来趋势
第九章 附录
The Compliance Carbon Credit Market size is estimated at USD 0.94 trillion in 2025, and is expected to reach USD 1.88 trillion by 2030, at a CAGR of 14.81% during the forecast period (2025-2030).
The compliance carbon credit market operates under regulatory frameworks that limit greenhouse gas emissions, such as emissions trading schemes (ETS) or cap-and-trade systems. Its primary function is to provide a mechanism for entities subject to emissions regulations, such as industries, power plants, and transportation sectors, to meet compliance obligations by purchasing carbon credits.
Compliance carbon markets operate within a diverse regulatory landscape, with different jurisdictions implementing emissions trading schemes and regulatory frameworks. Major compliance markets include the European Union Emissions Trading System (EU ETS), the California Cap-and-Trade Program, the Regional Greenhouse Gas Initiative (RGGI), and various national schemes in China, South Korea, and New Zealand.
Compliance carbon credits are generated from various emission reduction projects, including renewable energy installations (e.g., wind, solar), energy efficiency initiatives, forestry and land-use projects (e.g., afforestation, reforestation), and industrial process improvements.
Compliance Carbon Credit Market Trends
Charting the Course of Carbon Pricing: UK-ETS Post-Brexit
- After leaving the European Union in 2020, the United Kingdom implemented its carbon pricing mechanism, the UK-ETS, which replaced its participation in the EU-ETS. This transition allowed the United Kingdom to establish its emissions trading system and set its carbon pricing policies independent of the European Union.
- The price of emissions allowances (UKAs) traded on the United Kingdom's Emissions Trading System (UK-ETS) has experienced notable fluctuations since its inception in January 2021. According to industry experts, the price reached a high of GBP 97.75 per metric ton on August 19, 2022, indicating strong demand or regulatory factors driving the price. However, by May 31, 2023, the price dropped to GBP 51.04 per metric ton, marking the lowest price before January 2022. Various factors, including changes in market conditions, regulatory adjustments, or shifts in supply and demand dynamics, could have influenced this decline in price.
- In 2022, the UK-ETS generated significant revenue, totaling GBP 4.3. This revenue represents the financial impact of carbon pricing on regulated entities within the United Kingdom, including industrial facilities, power plants, and other sectors covered by the emissions trading system. The revenue generated from carbon allowances reflects the cost of compliance for these entities and contributes to government funds dedicated to climate-related initiatives and investments.
Renewable Energy Investments and Technological Innovations Driving Carbon Credit Generation
- Many energy companies invest in renewable power sources, including wind, hydroelectric, and solar power, to reduce their carbon footprint. This shift toward cleaner energy production creates opportunities for generating compliance carbon credits from renewable energy projects.
- For instance, in February 2024, Chile embarked on a European hunt for investors in solar, wind, and green hydrogen technologies to decarbonize copper mines and other industries reliant on fossil fuels. During renegotiations of the EU Chile Trade and Investment Agreement, Marcos Kulka, president of H2Chile, a hydrogen association representing 102 publicly and privately owned companies, went to Europe to present his government's energy strategy.
- Further, Industry experts believe blockchain technology can enhance carbon credit validation in the carbon market by integrating with MRV (Digital Monitoring, Reporting, and Verification) systems. MRV systems collect data from various sources, including satellite images, IoT sensors, and monitoring systems. The digital MRV data is hashed and uploaded to the blockchain to verify carbon credits. Smart contracts automate the verification process by ensuring carbon credits are issued only to projects that fulfill specific criteria. Using decentralized oracles, off-chain information feeds can be added to the validation process, allowing for real-time carbon credit validation.
Compliance Carbon Credit Industry Overview
Various certification bodies and standards organizations certify emission reduction projects and issue carbon credits based on predefined criteria and methodologies. Competition may exist among certification bodies to attract project developers seeking certification services, with differences in certification fees, timelines, and reputation influencing their choice of certifier. Carbon credit prices and market dynamics can vary significantly over time and across different markets, leading to pricing, liquidity, and market behavior fragmentation. This variability can make it challenging for market participants to predict and navigate market conditions effectively. Some of the compliant carbon credit market players are Carbon Trust, ClimateCare, and 3Degrees.
Additional Benefits:
- The market estimate (ME) sheet in Excel format
- 3 months of analyst support
TABLE OF CONTENTS
1 INTRODUCTION
- 1.1 Study Deliverables
- 1.2 Study Assumptions
- 1.3 Scope of the Study
2 RESEARCH METHODOLOGY
3 EXECUTIVE SUMMARY
4 MARKET INSIGHTS
- 4.1 Current Market Scenario
- 4.2 Technological Trends
- 4.3 Industry Value Chain Analysis
- 4.4 Government Regulations and Initiatives
5 MARKET DYNAMICS
- 5.1 Drivers
- 5.1.1 Regulatory Mandates and Policies
- 5.1.2 Growing Corporate Sustainability Initiatives
- 5.2 Restraints
- 5.2.1 Market Complexity and Uncertainty
- 5.3 Opportunities
- 5.3.1 Innovation and Technology Advancements
- 5.4 Industry Attractiveness - Porter's Five Forces Analysis
- 5.4.1 Bargaining Power of Suppliers
- 5.4.2 Bargaining Power of Consumers / Buyers
- 5.4.3 Threat of New Entrants
- 5.4.4 Threat of Substitute Products
- 5.4.5 Intensity of Competitive Rivalry
6 MARKET SEGMENTATION
- 6.1 By Type of Credits
- 6.1.1 Renewable Energy Projects
- 6.1.2 Forestry and Land Use
- 6.1.3 Energy Efficiency
- 6.1.4 Industrial Process Improvements
- 6.2 By Sector
- 6.2.1 Energy Sector
- 6.2.2 Transportation
- 6.2.3 Industrial Sector
- 6.2.4 Agriculture and Forestry
- 6.3 By Geography
- 6.3.1 North America
- 6.3.1.1 United States
- 6.3.1.2 Canada
- 6.3.2 Europe
- 6.3.2.1 United Kingdom
- 6.3.2.2 Germany
- 6.3.2.3 France
- 6.3.2.4 Rest of Europe
- 6.3.3 Asia-Pacific
- 6.3.3.1 China
- 6.3.3.2 Japan
- 6.3.3.3 India
- 6.3.3.4 South Korea
- 6.3.3.5 Rest of Asia-Pacific
- 6.3.4 Middle East and Africa
- 6.3.5 Latin America
- 6.3.1 North America
7 COMPETITIVE LANDSCAPE
- 7.1 Overview (Market Concentration and Major Players)
- 7.2 Company Profiles
- 7.2.1 Carbon Trust
- 7.2.2 ClimateCare
- 7.2.3 3Degrees
- 7.2.4 South Pole
- 7.2.5 Gold Standard
- 7.2.6 Natural Capital Partners
- 7.2.7 Shell New Energies
- 7.2.8 Sustainable Travel International
- 7.2.9 Forest Carbon
- 7.2.10 Atmosfair*
- 7.3 Other Companies
8 MARKET OPPORTUNITIES AND FUTURE TRENDS
9 APPENDIX
 2025年云端渲染碳抵销全球市场报告
 自愿性碳市场预测至2032年:按类型、计划类型、排碳权类型、买方类型、最终用户、行业垂直领域和地区分類的全球分析2025年全球智慧电商结帐碳抵销市场报告2025年碳金融服务(CFS)全球市场报告全球农林业碳补偿市场预测(至 2032 年):按类型、碳补偿类型、计划规模、认证标准、技术、最终用户和地区进行分析
 碳补偿/信用市场 - 全球和区域分析:按碳类型、计划类型、最终用户和区域进行的分析和预测(2025-2034 年)
 全球合规碳信用市场
 全球碳交易市场研究报告-产业分析、规模、份额、成长、趋势及2025年至2033年预测
 碳补偿市场规模、份额、成长分析(按类型、计划类型、最终用户和地区)- 产业预测(2025 年至 2032 年)全球碳补偿市场