


 |
市场调查报告书
商品编码
1644818
欧洲报关:市场占有率分析、产业趋势与成长预测(2025-2030 年)Europe Customs Brokerage - Market Share Analysis, Industry Trends & Statistics, Growth Forecasts (2025 - 2030) |
||||||
※ 本网页内容可能与最新版本有所差异。详细情况请与我们联繫。
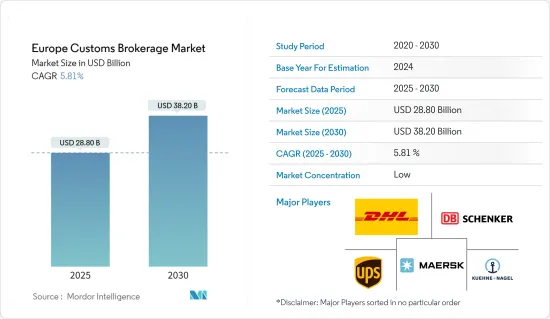
2025 年欧洲报关市场规模预计为 288 亿美元,预计到 2030 年将达到 382 亿美元,预测期内(2025-2030 年)的复合年增长率为 5.81%。
关键亮点
- 2023年第三季度,欧盟商品进出口额与2023年第一季相比分别下降4.6%(年比)和1.2%(年比)。欧盟商品出口连续第三个季度下降,进口连续第四个季度下降。
- 欧盟贸易顺差仍约180亿欧元(197.5亿美元),高于2021年第三季的69亿欧元(75.7亿美元)顺差。
- 2023 年第三季其他製成品进口额与去年同期相比下降了 66 亿欧元(72.4 亿美元),其次是机械和车辆进口额与去年同期相比下降了 66 亿欧元(72.4 亿美元),其次是机械和车辆进口额 62 亿欧元(68 亿美元)和能源进口额 47 亿欧元(51.6 亿美元)。
- 机械与车辆类出口下降 69 亿欧元(75.7 亿美元),其他製成品类出口下降 27 亿欧元(29.6 亿美元)。同时,能源和化学品分别增加了 34 亿欧元(37.3 亿美元)和 32 亿欧元(35.1 亿美元)。
- 能源产业的亏损自 2022 年第三季以来一直呈下降趋势,当时创下 -1,938 亿欧元(2,126.5 亿美元)的历史最低水准。这背后的主要因素是2023年第三季能源价格的下跌,导致亏损下降。
欧洲报关市场趋势
德国推动市场成长
- 德国是欧洲最大经济体、世界第四大经济体,也是世界第三大生产国。
- 经日历年和季节性调整后,2022 年 9 月德国商品出口额为 1,265 亿欧元(1,386.3 亿美元),商品进口额为 1,100 亿欧元(1,205.5 亿美元)。
- 2022 年 9 月贸易顺差为 165 亿欧元,而 2022 年 8 月顺差为 177 亿欧元(194 亿美元),2022 年 9 月顺差为 50 亿欧元(54.8 亿美元)。
- 2023年9月,德国对欧盟成员国的出口额为698亿欧元,从欧盟成员国的进口额为587亿欧元(641.9亿美元)。经季节性已调整的和日历年调整后,对欧盟国家的出口与2023年8月相比下降2.1%,进口下降2.6%。
- 2023年9月,对欧元区国家的出口为488亿欧元(534.8亿美元)(下降2.4%),从欧元区国家的进口为389亿欧元(426.3亿美元)(下降3.4%)。同时,欧盟内部出口额为 209 亿欧元(229 亿美元)(下降 1.3%),而从欧元区以外进口额为 198 亿欧元(217 亿美元)(下降 0.2%)。
- 2022 年 9 月,对欧盟以外第三国的商品出口额为 567 亿欧元(621.4 亿美元),经日历和季节性调整后的进口额为 513 亿欧元(562.2 亿美元)。与 2022 年 8 月相比,第三国出口下降 28 亿欧元(30.7 亿美元),进口下降 6 亿欧元(6.6 亿美元)。
- 德国出口的大部分产品销往美国。经过季节性和日历年调整后,对美国的商品出口与2022年8月相比下降了40亿欧元(43.8亿美元),而对美国的出口则下降至128亿欧元(135.7亿美元)。对华商品出口下降 73 亿欧元(80 亿美元),至 77 亿欧元(84.4 亿美元)。同时,对英国的出口增加了 23 亿欧元(23 亿美元),达到 67 亿欧元(73.4 亿美元)。
- 2023 年 9 月,中华人民共和国占进口额的大部分,金额130 亿欧元(142.5 亿美元)。经日历和季节性调整后,销售额较上月下降 7 亿欧元(7.7 亿美元)。美国增加了 5 亿欧元(5.5 亿美元),达到 77 亿欧元(84.4 亿美元)。
- 英国增加了 52 亿欧元(57 亿美元),达到 32 亿欧元(35.1 亿美元)。同时,2023 年 9 月,从俄罗斯联邦的进口减少了 112 亿欧元(122.7 亿美元),而上个月则减少了 114 亿欧元(124.9 亿美元)。对俄罗斯的出口较上月下降了 417 亿欧元(457 亿美元)。同时,自俄罗斯的进口额比上季增加了75亿欧元(82.2亿美元),但季减了894亿欧元(979.7亿美元)。
远洋运输占据市场主导地位
- 航运长期以来一直是欧洲经济成长和繁荣的主要动力。海上运输促进了欧洲各国之间的贸易和联繫。能源、粮食和商品供应受到保障,海运是欧盟内部和外部进出口的主要方式。
- 海上运输占欧盟对外货运贸易的近90%,短程海运占欧盟内部贸易吨公里数的三分之一。良好的海上运输服务对于欧洲岛屿和周边海域的生活品质至关重要。
- 每年有超过4亿乘客经过欧洲港口。总体而言,航运业为欧洲经济提供了就业和收入。
- 2022年欧洲港口的货物吞吐量将为35亿吨,略高于2021年(与前一年同期比较-0.8%)。 2020 年可能因疫情以及欧盟和全球的限製而大幅下降,2022 年的水准略低于 2018 年。
- 欧洲港口货运活动自2014年以来呈现正面趋势,标誌着2009年经济危机后略有復苏。与 2020 年同期相比,2021 年第一季出现下降,随后 2021 年后三个季度和 2022 年前两个季度出现显着增长。然而,2022 年最后两季的活动有所下降,第三季年减 -0.1%,第四季下降 -2.2%。
- 在海运方面,荷兰将在2022年维持欧洲最大海运国的地位,其他七个欧洲最大港口分别是鹿特丹(荷兰)、安特卫普(布鲁日)、汉堡(汉堡)、阿姆斯特丹(阿姆斯特丹-慕尼黑)、阿尔赫西拉斯(Harpo[2])和马赛(马赛)。
- 以海运货运量占人口比例来看,欧盟成员国范围从 2022 年荷兰的 33.3 TfC 到波兰(罗马尼亚)的 3.2 TfC 以及欧盟平均水准的 7.8 TfC。不过,在 2022 年向欧盟统计局报告海事资料的国家中,欧洲自由贸易联盟成员国挪威的比例最高(39.4 TfC)。
欧洲报关产业概况
欧洲报关市场依其性质分为多个部分。市场上报关行众多,竞争激烈。市场的主要企业包括 DHL Logistics、马士基物流、Kuehne and Nagel Logistics、联合包裹服务公司和 DB Schenker。
这些公司建立了良好的声誉并拥有广泛的客户和合作伙伴网络。他们通常也拥有丰富的欧洲国家清关程序经验,因此是企业的可靠选择。
其他福利
- Excel 格式的市场预测 (ME) 表
- 3 个月的分析师支持
目录
第 1 章 简介
- 研究假设和市场定义
- 市场覆盖
第二章调查方法
第三章执行摘要
第四章 市场洞察
- 当前市场状况
- 政府措施和法规
- 供应链/价值链分析
- 货物运输中的通关中介功能概述
- 海关定价概览
- 了解终端用户产业的海关服务
- COVID-19 对市场的影响
第五章 市场动态
- 驱动程式
- 国际贸易成长
- 复杂的海关法规
- 限制因素
- 监管挑战
- 地缘政治不确定性
- 机会
- 电子商务繁荣
- 技术进步
- 产业吸引力-波特五力分析
- 供应商的议价能力
- 消费者议价能力
- 新进入者的威胁
- 竞争威胁
- 竞争对手之间的竞争
第六章 市场细分
- 按交通方式
- 海上
- 空运
- 跨境陆路运输
- 按地区
- 德国
- 英国
- 法国
- 荷兰
- 义大利
- 欧洲其他地区
第七章 竞争格局
- 市场集中度概览
- 公司简介
- DHL Group Logistics
- DB Schenker
- Kuehne and Nagel
- Maersk Logistics
- United Parcel Services
- FedEx
- Rhenus Logistics
- Gerlach Customs
- APL Logistics
- Gaston Schul Logistics*
第 8 章:市场的未来
第 9 章 附录
- 总体经济指标
- 资本流动洞察
- 进出口统计
The Europe Customs Brokerage Market size is estimated at USD 28.80 billion in 2025, and is expected to reach USD 38.20 billion by 2030, at a CAGR of 5.81% during the forecast period (2025-2030).
Key Highlights
- The volume of EU goods exports and imports decreased in Q3 2023, with a decrease of 4.6% (YoY) and 1.2% (RuY), respectively, compared to Q1 2023. The volume of EU exports in goods decreased for a third consecutive quarter, while imports decreased for a fourth consecutive quarter.
- The surplus in the EU's trade balance remained at around EUR 18 billion (USD 19.75 billion), with a surplus of EUR 6.9 billion (USD 7.57 billion)recorded in Q3 2021.
- Other manufactured goods imports decreased by EUR 6.6 billion (USD 7.24 billion) in the Q3 of 2023 compared to the Q2 of 2023, followed by machinery and vehicles at EUR 6.2 billion(USD 6.80 billion) and energy at EUR 4.7 billion(USD 5.16 billion).
- Exports decreased in the machinery and vehicles group by EUR 6.9 billion (USD 7.57 billion) and in the other manufactured goods group by EUR 2.7 billion(USD 2.96 billion). At the same time, energy and chemicals increased by EUR 3.4 billion (USD 3.73 billion) and EUR 3.2 billion(USD 3.51 billion), respectively.
- In the energy sector, the trade deficit has been on a declining trend since Q3 of 2022, when it reached a record low of -EUR 193.8 billion (USD 212.65 billion). The main reason for this was falling energy prices in Q3 of 2023, which contributed to the decrease in the trade deficit.
Europe Customs Brokerage Market Trends
Germany Driving the Growth of the Market
- In addition to having the biggest economy in Europe and the fourth-largest economy in the world, Germany is the third-largest producer in the world.
- After adjusting for calendar and seasonality, the volume of goods exported by Germany totaled EUR 126,5 billion (USD 138.63 billion), and the volume of goods imported totaled EUR 110,0 billion (USD 120.55 billion) in September 2022.
- The trade balance recorded a surplus of EUR 16,5 billion in September 2022 compared with a surplus of EUR 17,7 billion (USD 19.40 billion) recorded in August 2022 and EUR 5,0 billion (USD 5.48 billion) recorded in September 2022.
- Germany exported goods to the EU Member States in September 2023 worth EUR 69.8 billion while importing goods from these countries worth EUR 58.7 billion (USD 64.19 billion). Calendar and seasonally adjusted, exports to EU countries decreased by 2.1%, while imports decreased by 2.6% compared to August 2023.
- In September 2023, the value of goods exported to euro-zone countries totaled EUR 48.8 billion (USD 53.48 billion) (-2.4%), while the value of goods imported from euro-area countries totaled EUR 38.9 billion (USD 42.63 billion) (-3.4%). On the other hand, goods to the EU were exported worth EUR 20.9 billion (USD 22.90 billion) (-1.3%), while the value of imports from non-euro-zone countries was EUR 19.8 billion (USD 21.70 billion) (-0.2%).
- The volume of goods exported to third countries outside the European Union (EU) totaled EUR 56.7 billion (USD 62.14 billion in September 2022, while imports totaled EUR 51.3 billion (USD 56.22 billion), both calendar- and seasonally-adjusted. Compared to August 2022, third-country exports decreased by EUR 2,8 billion (USD 3.07 billion), while imports decreased by EUR 0,6 billion (USD 0.66 billion).
- The majority of German exports were made to the United States. After adjusting for seasonal and calendar adjustments, the value of goods exports to the US decreased by EUR 4,0 billion (USD 4.38 billion) compared to August 2022, with exports to the US dropping to EUR 12.8 billion (USD 13.57 billion). The volume of goods exports to China decreased by EUR 7.3 billion (USD 8 billion) to EUR 7.7 billion (USD 8.44 billion). In contrast, exports to the UK increased by EUR 2.3 billion (USD 2.3 billion) to EUR 6.7 billion (USD 7.34 billion).
- In September 2023, the People's Republic of China accounted for the majority of imports, with goods valued at EUR 13,0 billion (USD 14.25 billion). After calendar and seasonal adjustments, this represents a decrease of EUR 0.7 billion (USD 0.77 billion) compared to the previous month. The United States increased imports by EUR 0.5 billion (USD 0.55 billion) to EUR 7.7 billion (USD 8.44 billion).
- The United Kingdom increased imports by EUR 5.2 billion (USD 5.70 Billion) to EUR 3,2 billion (USD 3.51 billion) in the same month. On the other hand, imports from the Russian Federation decreased by EUR 11.2 billion (USD 12.27 billion) in September 2023, compared to a decrease of EUR 11.4 billion (USD 12.49 billion) in the month before. Compared to the month before, exports to Russia decreased by EUR 41.7 billion (USD 45.70 billion). At the same time, imports from Russia increased by EUR 7.5 billion (USD 8.22 billion) from the month before and decreased by EUR 89.4 billion (USD 97.97 billion) compared to the month before.
Sea Transport Dominates the Market
- Shipping has long been a key driver of economic growth and prosperity for Europe. Maritime Transport facilitates trade and links between all European countries. Energy, food, and commodity supply are safeguarded, and maritime transport is the main means of import and export into the EU and beyond.
- Seaborne accounts for almost 90% of external freight trade in the EU, and short sea shipping accounts for one-third of EU exchanges in ton-kilometres. Good maritime transport services are essential for the quality of life in Europe's islands and peripheral maritime regions.
- Over 400 million passengers arrive and leave at European ports each year. In general, maritime industries provide employment and income to the European economy.
- EU ports handled 3,5 billion tonnes of goods in 2022, which is slightly higher than in 2021 (-0.8% YoY). After a significant drop in 2020, which is most likely due to the pandemic and restrictions imposed across the EU and globally, the levels in 2022 are slightly lower than in 2018.
- EU port freight activity showed a positive trend since 2014, suggesting a slight recovery after the 2009 economic crisis. After a drop in the first quarter of 2021 when compared to the same quarter in 2020, there was a clear increase in the last three quarters of 2021 and the first two quarters of 2022. However, there was a decrease in activity in the final two quarters of 2022, with a drop in activity (-0.1% YoY in the 3rd quarter and (-2.2%) in the 4th quarter.
- In terms of maritime freight transport, the Netherlands maintained its position as the largest country in Europe for maritime freight transport in 2022, with the other seven largest ports in Europe being Rotterdam (Netherlands), Antwerp (Bruges), Hamburg (Hamburg), Amsterdam (Amsterdam-Munich), Algeciralas (Harpo[2]) and Marseille (Marseille).
- In terms of seaborne cargo-to-capita ratios, EU Member States ranged from 33.3 TfC in the Netherlands in 2022 to 3.2 TfC in Poland (Romania) and the EU average of 7.8 TfC in 2022. However, Norway, an EFTA country, had the highest ratio (39.4 TfC) of maritime data reporting countries to Eurostat in 2022.
Europe Customs Brokerage Industry Overview
The market for customs brokerage in Europe is fragmented in nature. With a large number of customs brokers operating in the market, the competition is high. The major players in the market include DHL Logistics, Maersk Logistics, Kuehne and Nagel Logistics, United Parcel Services, DB Schenker, etc.
The companies have built a strong reputation and have a wide network of clients and partners. They often have extensive experience in handling customs procedures across different European countries, making them a reliable choice for businesses.
Additional Benefits:
- The market estimate (ME) sheet in Excel format
- 3 months of analyst support
TABLE OF CONTENTS
1 INTRODUCTION
- 1.1 Study Assumptions and Market Definition
- 1.2 Scope of the Market
2 RESEARCH METHODOLOGY
3 EXECUTIVE SUMMARY
4 MARKET INSIGHTS
- 4.1 Current Market Scenario
- 4.2 Government Initiatives and Regulations
- 4.3 Supply Chain/Value Chain Analysis
- 4.4 Brief on Customs Brokerage as a Freight Forwarding Function
- 4.5 Overview of Customs Pricing
- 4.6 Insights on Customs Brokerage Services by End-user Industry
- 4.7 Impact of COVID-19 on the Market
5 MARKET DYNAMICS
- 5.1 Drivers
- 5.1.1 Increasing international trade
- 5.1.2 Complex custom regulations
- 5.2 Restraints
- 5.2.1 Regulatory Challenges
- 5.2.2 Geopolitical Uncertainity
- 5.3 Opportunities
- 5.3.1 E-commerce Boom
- 5.3.2 Technological Advancements
- 5.4 Industry Attractiveness - Porter's Five Forces Analysis
- 5.4.1 Bargaining Power of Suppliers
- 5.4.2 Bargaining Power of Consumers
- 5.4.3 Threat of New Entrants
- 5.4.4 Threat of Subsititutes
- 5.4.5 Intensity of Competitive Rivalry
6 MARKET SEGMENTATION
- 6.1 By Mode Of Transport
- 6.1.1 Sea
- 6.1.2 Air
- 6.1.3 Cross-Border Land Transport
- 6.2 By Geography
- 6.2.1 Germany
- 6.2.2 United Kingdom
- 6.2.3 France
- 6.2.4 Netherlands
- 6.2.5 Italy
- 6.2.6 Rest of Europe
7 COMPETITIVE LANDSCAPE
- 7.1 Market Concentration Overview
- 7.2 Company Profiles
- 7.2.1 DHL Group Logistics
- 7.2.2 DB Schenker
- 7.2.3 Kuehne and Nagel
- 7.2.4 Maersk Logistics
- 7.2.5 United Parcel Services
- 7.2.6 FedEx
- 7.2.7 Rhenus Logistics
- 7.2.8 Gerlach Customs
- 7.2.9 APL Logistics
- 7.2.10 Gaston Schul Logistics*
8 FUTURE OF THE MARKET
9 APPENDIX
- 9.1 Macroeconomic Indicators
- 9.2 Insights on capital flow
- 9.3 Exports and Import Statistics


