


 |
市场调查报告书
商品编码
1683121
亚太地区酸味剂市场占有率分析、产业趋势与统计、成长预测(2025-2030 年)Asia-Pacific Feed Acidifiers - Market Share Analysis, Industry Trends & Statistics, Growth Forecasts (2025 - 2030) |
||||||
价格
※ 本网页内容可能与最新版本有所差异。详细情况请与我们联繫。
简介目录
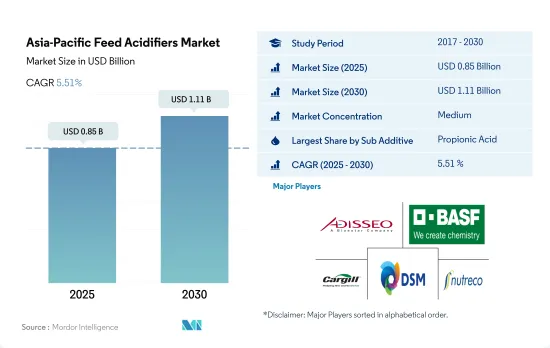
亚太地区饲料酸味剂市场规模预计在 2025 年达到 8.5 亿美元,预计到 2030 年将达到 11.1 亿美元,预测期内(2025-2030 年)的复合年增长率为 5.51%。
- 2022 年亚太饲料添加剂市场的酸化剂部分占 7.0% 的市场占有率。这组添加剂在动物营养中备受重视,因为它们可以改善饲料性能并减少病原菌和有毒代谢物的吸收。在饲料酸味剂中,丙酸因其在改善营养吸收和减少病原微生物方面的作用,将在2022年占据2.38亿美元的显着市场价值,在2017年至2022年期间在亚太地区增长47.8%。
- 家禽是该地区最大的动物类型细分市场,占 2022 年亚太地区饲料酸味剂市场占有率的49.9%。由于家禽饲料中酸味剂的使用量很大,可以促进生长、增加新陈代谢和饲料摄入量,并具有抵抗有害病原体的能力,因此预计该部分在预测期内的复合年增长率将达到 6.1%。
- 预计预测期内印尼的乳酸成长率将达到 6.5%,因为 2017 年至 2022 年间饲料产量将增加 21.5%。当添加到配方饲料中时,乳酸有助于改善肠道健康、消化率和营养利用率。
- 2022 年,中国在酸化剂市场中占据 44.2% 的最大市场占有率,这归因于 2017-2022 年期间家禽数量增加了 1.6%。
- 基于上述因素以及饲料酸味剂在动物营养中的重要性,预测期内亚太地区饲料酸味剂市场复合年增长率预计将达到 5.5%。
- 亚太地区的饲料酸味剂市场呈现显着成长,其中中国、印度和日本占据最大的市场占有率。 2022年,这些国家总合占据该地区59.3%的市场占有率。其中,中国市场规模预计2022年将达到3.218亿美元,2029年将达到4.681亿美元。中国较高的占比得益于其饲养的牲畜数量庞大,到2022年,中国将占亚太地区家禽存栏量的39.7%。
- 亚太地区饲料酸味剂市场最大的动物种类是家禽,占2022年市场占有率的50%,其次是猪,占31%,反刍动物占9.7%。家禽和猪的市场占有率高是由于其大规模商业化养殖和食品工业对肉和蛋的高需求。预计预测期内家禽产量将成长最快。母鸡、虾子和鱼的成长速度较快,预计在预测期内的复合年增长率分别为 6.6%、6.4% 和 6.2%。
- 该地区消费最多的饲料酸味剂是丙酸和富马酸,市场占有率分别为 32.7% 和 26.8%。这与家禽和水产养殖饲料的高渗透率和高利用率有关。
- 在预计预测期内,日本和印尼将成为亚太饲料酸味剂市场成长最快的市场,复合年增长率均为 6.3%,这得益于两国饲料产量的增加。由于酸化剂的使用量增加,预计预测期内亚太地区饲料酸味剂市场将以 5.5% 的复合年增长率成长。
亚太饲料酸味剂市场趋势
亚太地区开发中国家的可支配收入不断增加、政府对家禽业的支持计画以及中国作为最大的鸡蛋生产国,共同推动了该地区家禽养殖数量的增加。
- 亚太地区占全球农业部门的大部分,其中家禽是最大的部分,占 2022 年全球家禽产量的 42.4%。鸡肉消费受到印度和越南等新兴国家日益增长的受欢迎程度、快速的都市化和可支配收入的提高的推动,2021 年鸡肉消费人口与 2017 年相比增长了 37.3%。
- 2021年,中国、印尼和印度占据该地区鸡肉市场的主要份额,分别占39.7%、25.3%和5.7%的市场占有率。家禽产品需求的成长是由于鸡蛋和肉类的需求增加,以及政府支持家禽业的计画。例如,印度畜牧业和酪农部推出了一项资本基金计划,以支持家禽企业并教育农民提高收成质量,预计这将促进市场成长。
- 中国是全球最大的鸡蛋生产国,占全球鸡蛋消费量和产量的40%以上。该国拥有超过 9 亿隻蛋鸡,最大的蛋鸡养殖中心每年孵化出 6,000 万隻鸡雏,蛋鸡养殖业取得了显着成长。
- 由于消费者对鸡肉的需求不断增加,该地区的肉鸡产量正在迅速增长。例如,在菲律宾,2021 年的鸡肉产量与 2017 年相比增加了 2.2%。由于消费者对鸡肉偏好的改变和鸡肉产业的快速发展,该地区的鸡肉产量预计将增加,这可能会增加对饲料添加剂的需求。
水产养殖技术的改进、饲料厂的扩建以及印度政府的措施正在促进水产养殖饲料产量的提高。
- 亚太地区是全球水产饲料生产市场的主要企业,鱼和虾是主要生产商品。 2021年该地区水产饲料产量为3,760万吨,占全部区域饲料总产量的8.7%。为了满足日益增长的需求,该地区的一些国家正致力于透过技术进步和增加饲料使用来扩大和加强水产养殖生产。
- 例如,印度增加了对渔业部的预算拨款,以提高产量。鱼类在水产养殖饲料中占很大比重,且由于农地转变为养殖池、水产养殖技术的改进以及生产的集约化,预计2022年将达到3110万吨,比2017年增长66%。 2022年,虾饲料产量将占该地区水产饲料产量的4.2%,预计在预测期内将迅速增长,因为该地区的一些国家已开始透过一系列政府措施实施自给自足的水产养殖系统,以增加经过认证的永续水产品产量。
- 中国占据亚太水产饲料市场的主导地位,随着产能更高的饲料厂的兴起,到 2022 年将占 51.2% 的市场占有率。例如,英联农业在中国开设了第九家饲料厂,年产能达24万吨。预计预测期内,水产养殖产量增加、水产养殖规模扩大和饲料消费增加等因素将推动该地区水产饲料产量的成长。
亚太饲料酸味剂产业概况
亚太地区饲料酸味剂市场呈现中度整合态势,前五大公司占42.36%的市占率。该市场的主要企业有: Adisseo、 BASF SE、嘉吉公司、DSM Nutritional Products AG 和 SHV (Nutreco NV)(按字母顺序排列)。
其他福利
- Excel 格式的市场预测 (ME) 表
- 3 个月的分析师支持
目录
第 1 章执行摘要和主要发现
第二章 报告要约
第 3 章 简介
- 研究假设和市场定义
- 研究范围
- 调查方法
第四章 产业主要趋势
- 动物数量
- 家禽
- 反刍动物
- 猪
- 饲料生产
- 水产养殖
- 家禽
- 反刍动物
- 养猪业
- 法律规范
- 澳洲
- 中国
- 印度
- 印尼
- 日本
- 菲律宾
- 韩国
- 泰国
- 越南
- 价值链与通路分析
第五章 市场区隔
- 依二次添加剂
- 富马酸
- 乳酸
- 丙酸
- 其他酸味剂
- 按动物
- 水产养殖
- 按亚动物
- 鱼
- 虾
- 其他水产养殖品种
- 家禽
- 亚动物
- 肉鸡
- 图层
- 其他鸟类
- 反刍动物
- 亚动物
- 肉牛
- 乳牛
- 其他反刍动物
- 猪
- 其他动物
- 水产养殖
- 按国家
- 澳洲
- 中国
- 印度
- 印尼
- 日本
- 菲律宾
- 韩国
- 泰国
- 越南
- 其他亚太地区
第六章 竞争格局
- 主要策略趋势
- 市场占有率分析
- 业务状况
- 公司简介包括全球概况、市场层级概况、主要业务部门、财务状况、员工人数、关键资讯、市场排名、市场占有率、产品和服务以及最新发展分析。
- Adisseo
- BASF SE
- Brenntag SE
- Cargill Inc.
- DSM Nutritional Products AG
- EW Nutrition
- Kemin Industries
- MIAVIT Stefan Niemeyer GmbH
- SHV(Nutreco NV)
- Yara International ASA
第七章:执行长的关键策略问题
第 8 章 附录
- 世界概况
- 概述
- 五力分析框架
- 全球价值链分析
- 全球市场规模和 DRO
- 资讯来源和进一步阅读
- 图表清单
- 关键见解
- 资料包
- 词彙表
简介目录
Product Code: 50893
The Asia-Pacific Feed Acidifiers Market size is estimated at 0.85 billion USD in 2025, and is expected to reach 1.11 billion USD by 2030, growing at a CAGR of 5.51% during the forecast period (2025-2030).
- The acidifiers segment of the Asia-Pacific feed additives market held a 7.0% market share in 2022. This group of additives is highly valued in animal nutrition as it improves feed performance and reduces the uptake of pathogenic organisms and toxic metabolites. Among the feed acidifiers, propionic acid held a significant market value of USD 238.0 million in 2022, which grew by 47.8% between 2017 and 2022 in the Asia-Pacific region due to its role in improving nutrient absorption and reducing pathogenic microbes.
- Poultry birds were the largest animal type segment in the region, with 49.9% of the market share value in the Asia-Pacific feed acidifiers market in 2022. This segment is projected to record a CAGR of 6.1% during the forecast period due to the higher usage of feed acidifiers in poultry birds, which promote growth, boost metabolism and feed intake, and provide resistance to harmful pathogens.
- Indonesia is expected to register the fastest growth rate of 6.5% during the forecast period, with respect to lactic acid, due to a 21.5% increase in feed production between 2017 and 2022. Lactic acid helps improve gastrointestinal tract health, digestibility, and nutrient utilization when added to compound feed.
- China held the largest market share of 44.2% with respect to the acidifiers market in 2022 due to the increased headcount of poultry by 1.6% in the country between 2017 and 2022.
- Based on the above-mentioned factors and the importance of feed acidifiers in animal nutrition, the Asia-Pacific feed acidifiers market is anticipated to record a CAGR of 5.5% during the forecast period.
- The Asia-Pacific witnessed significant growth in the feed acidifiers market, with China, India, and Japan being the top countries in terms of market share. In 2022, these countries collectively accounted for 59.3% of the market share in the region. China, particularly, had a market value of USD 321.8 million in 2022, which is expected to reach USD 468.1 million in 2029. The country's high share can be attributed to its large livestock population, with China accounting for 39.7% of the Asia-Pacific's poultry population in 2022.
- Poultry birds were the largest animal types in the Asia-Pacific feed acidifiers market, with a 50% market share in 2022, followed by swine and ruminants at 31% and 9.7%, respectively. The higher market share for poultry birds and swine was due to their higher commercial cultivation and demand for meat and eggs in the food industry. Poultry birds are anticipated to witness the fastest growth during the forecast period. Layers, shrimp, and fish are growing at a faster pace, anticipated to register a CAGR of 6.6%, 6.4%, and 6.2%, respectively, during the forecast period.
- Propionic and fumaric acid were the most consumed feed acidifier types in the region, with 32.7% and 26.8% market share, respectively. This was associated with their higher penetration rates and higher utilization of feed for poultry and aquaculture species.
- During the forecast period, Japan and Indonesia are expected to be the fastest-growing segments in the Asia-Pacific feed acidifiers market, with a CAGR of 6.3% each, due to increased feed production in both countries. The Asia-Pacific feed acidifiers market is expected to grow at a CAGR of 5.5% during the forecast period, driven by an increase in the usage of acidifiers.
Asia-Pacific Feed Acidifiers Market Trends
The growing disposable income in developing countries of Asia-Pacific and government support schemes for poultry industry, and China is largest producer of eggs are helping in growth of poultry population in the region
- Asia-Pacific dominated the global agricultural sector, with poultry being the largest segment, accounting for 42.4% of global poultry production in 2022. Poultry consumption is driven by a rise in popularity, rapid urbanization, and growing disposable incomes in developing countries such as India and Vietnam, which recorded a 37.3% increase in poultry population in 2021 compared to 2017.
- In 2021, China, Indonesia, and India held a significant share of the poultry market in the region, with a market share of 39.7%, 25.3%, and 5.7%, respectively. This growth in demand for poultry products can be attributed to the increased demand for eggs and meat and government schemes that support the poultry industry. For instance, the Department of Animal Husbandry & Dairy in India is introducing capital fund schemes to support poultry businesses, educating farmers on improving their yield quality, which is expected to boost the market's growth.
- China is the largest producer of eggs in the world, with consumption and production accounting for over 40% of global production. With over 900 million stock-laying hens and the country's largest layer poultry farming center hatching 60 million chicks per year, the country's layer farming recorded significant growth.
- Broiler production in the region is rapidly growing due to the increased consumer demand for chicken meat. The Philippines, for instance, recorded a 2.2% increase in chicken meat production in 2021 compared to 2017. The region's poultry production is expected to increase, driven by a shift in consumer preferences toward poultry meat and the rapid development of the poultry industry, which in turn may boost the demand for feed additives.
Improvement in fish farming technologies, expansion in number of feed mills and Indian government initiatives are helping in increasing the aquaculture feed production
- Asia-Pacific is a major player in the global aquaculture feed production market, with fish and shrimp being the primary products. In 2021, the region produced 37.6 million metric tons of aquaculture feed, which accounted for 8.7% of the region's total feed production. Several countries in the region are focusing on expanding their aquaculture production and intensification through technological advancements and increased use of feed to meet the growing demand.
- For instance, India increased its budget allocation to the Department of Fisheries to boost production. Fish holds a significant share of aquaculture feed, accounting for 31.1 million metric tons in 2022, an increase from 66% compared to 2017 due to the conversion of agricultural land to aquaculture ponds, the improvement of fish farming technologies, and the intensification of production. Shrimp feed production accounted for 4.2% of the aquafeed production in the region in 2022, and it is expected to increase rapidly during the forecast period as some countries in the region started implementing a self-sufficient aquaculture system through a number of government initiatives to increase the production of certified sustainable seafood.
- China dominates the aquafeed market in Asia-Pacific, accounting for 51.2% of the market share in 2022 due to an increase in the number of feed mills with higher capacities. For instance, AB Agri opened its ninth feed mill in China, a plant with an annual capacity of 240,000 tons. Factors such as an increase in aquaculture production, expansion of aqua farming, and rise in consumption of feed are expected to drive the growth of aquafeed production in the region during the forecast period.
Asia-Pacific Feed Acidifiers Industry Overview
The Asia-Pacific Feed Acidifiers Market is moderately consolidated, with the top five companies occupying 42.36%. The major players in this market are Adisseo, BASF SE, Cargill Inc., DSM Nutritional Products AG and SHV (Nutreco NV) (sorted alphabetically).
Additional Benefits:
- The market estimate (ME) sheet in Excel format
- 3 months of analyst support
TABLE OF CONTENTS
1 EXECUTIVE SUMMARY & KEY FINDINGS
2 REPORT OFFERS
3 INTRODUCTION
- 3.1 Study Assumptions & Market Definition
- 3.2 Scope of the Study
- 3.3 Research Methodology
4 KEY INDUSTRY TRENDS
- 4.1 Animal Headcount
- 4.1.1 Poultry
- 4.1.2 Ruminants
- 4.1.3 Swine
- 4.2 Feed Production
- 4.2.1 Aquaculture
- 4.2.2 Poultry
- 4.2.3 Ruminants
- 4.2.4 Swine
- 4.3 Regulatory Framework
- 4.3.1 Australia
- 4.3.2 China
- 4.3.3 India
- 4.3.4 Indonesia
- 4.3.5 Japan
- 4.3.6 Philippines
- 4.3.7 South Korea
- 4.3.8 Thailand
- 4.3.9 Vietnam
- 4.4 Value Chain & Distribution Channel Analysis
5 MARKET SEGMENTATION (includes market size in Value in USD and Volume, Forecasts up to 2030 and analysis of growth prospects)
- 5.1 Sub Additive
- 5.1.1 Fumaric Acid
- 5.1.2 Lactic Acid
- 5.1.3 Propionic Acid
- 5.1.4 Other Acidifiers
- 5.2 Animal
- 5.2.1 Aquaculture
- 5.2.1.1 By Sub Animal
- 5.2.1.1.1 Fish
- 5.2.1.1.2 Shrimp
- 5.2.1.1.3 Other Aquaculture Species
- 5.2.2 Poultry
- 5.2.2.1 By Sub Animal
- 5.2.2.1.1 Broiler
- 5.2.2.1.2 Layer
- 5.2.2.1.3 Other Poultry Birds
- 5.2.3 Ruminants
- 5.2.3.1 By Sub Animal
- 5.2.3.1.1 Beef Cattle
- 5.2.3.1.2 Dairy Cattle
- 5.2.3.1.3 Other Ruminants
- 5.2.4 Swine
- 5.2.5 Other Animals
- 5.2.1 Aquaculture
- 5.3 Country
- 5.3.1 Australia
- 5.3.2 China
- 5.3.3 India
- 5.3.4 Indonesia
- 5.3.5 Japan
- 5.3.6 Philippines
- 5.3.7 South Korea
- 5.3.8 Thailand
- 5.3.9 Vietnam
- 5.3.10 Rest of Asia-Pacific
6 COMPETITIVE LANDSCAPE
- 6.1 Key Strategic Moves
- 6.2 Market Share Analysis
- 6.3 Company Landscape
- 6.4 Company Profiles (includes Global Level Overview, Market Level Overview, Core Business Segments, Financials, Headcount, Key Information, Market Rank, Market Share, Products and Services, and Analysis of Recent Developments).
- 6.4.1 Adisseo
- 6.4.2 BASF SE
- 6.4.3 Brenntag SE
- 6.4.4 Cargill Inc.
- 6.4.5 DSM Nutritional Products AG
- 6.4.6 EW Nutrition
- 6.4.7 Kemin Industries
- 6.4.8 MIAVIT Stefan Niemeyer GmbH
- 6.4.9 SHV (Nutreco NV)
- 6.4.10 Yara International ASA
7 KEY STRATEGIC QUESTIONS FOR FEED ADDITIVE CEOS
8 APPENDIX
- 8.1 Global Overview
- 8.1.1 Overview
- 8.1.2 Porter's Five Forces Framework
- 8.1.3 Global Value Chain Analysis
- 8.1.4 Global Market Size and DROs
- 8.2 Sources & References
- 8.3 List of Tables & Figures
- 8.4 Primary Insights
- 8.5 Data Pack
- 8.6 Glossary of Terms
02-2729-4219
+886-2-2729-4219
 饲料酸添加剂市场:按类型、畜种、剂型、应用和分销管道划分-2026-2032年全球市场预测
 2026年全球饲料酸化剂市场报告
 饲料酸化剂市场规模、份额和成长分析(按类型、剂型、化合物、畜种和地区划分)-2026-2033年产业预测
 饲料酸化剂市场-全球产业规模、份额、趋势、机会和预测,按添加剂(富马酸、乳酸、丙酸)、动物(水产养殖、家禽、反刍动物、猪)、地区和竞争细分,2020-2030 年预测
 北美饲料酸味剂:市场占有率分析、行业趋势和成长预测(2025-2030 年)欧洲饲料酸味剂:市场占有率分析、行业趋势和统计数据、成长预测(2025-2030 年)饲料酸味剂:市场占有率分析、产业趋势与统计、成长预测(2025-2030 年)
 饲料酸味剂市场:未来预测(2025-2030)