


 |
市场调查报告书
商品编码
1685815
饲料酸味剂:市场占有率分析、产业趋势与统计、成长预测(2025-2030 年)Feed Acidifiers - Market Share Analysis, Industry Trends & Statistics, Growth Forecasts (2025 - 2030) |
||||||
价格
※ 本网页内容可能与最新版本有所差异。详细情况请与我们联繫。
简介目录
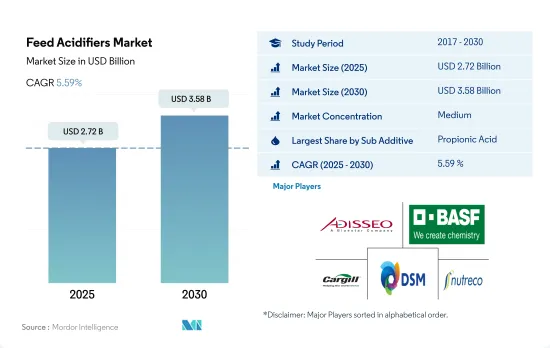
饲料酸味剂市场规模预计在 2025 年为 27.2 亿美元,预计到 2030 年将达到 35.8 亿美元,预测期内(2025-2030 年)的复合年增长率为 5.59%。
- 饲料酸味剂是动物饲料的重要组成部分,可促进生长和代谢,增加饲料摄取量,抵抗有害病原体,同时减少对抗生素的依赖。 2022年,饲料酸味剂将占全球饲料添加剂市场的7%,成为全球最重要的饲料添加剂之一。
- 亚太地区是饲料酸味剂最大的区域市场,2022 年占市场份额的 31.3%。北美和欧洲紧随其后,市场占有率分别为 26.1% 和 23%。亚太地区所占份额较高是由于添加剂的普遍存在和动物数量庞大。美国是鸡肉和牛肉等多种肉类的最大生产国和出口国之一,这使得北美成为最大的饲料生产国之一。该地区广泛采用饲料酸味剂作为抗生素的替代品来生产高品质饲料。
- 丙酸是最广泛使用的饲料酸味剂,占 2022 年全球饲料酸味剂市场的最大份额,价值 8 亿美元。这是因为它具有抗菌特性,能够以低浓度抑制霉菌和某些细菌的生长。以金额为准,其次是富马酸和乳酸。
- 预计其他饲料酸味剂领域将以类似的速度成长,预测期内复合年增长率为 5.6%,这主要归因于酸化剂能够增加牲畜饲料摄取量和牲畜生产力。
- 人们对饲料添加剂的有效利用的认识不断提高、商业性农业的趋势日益上升以及酸化剂充当抗生素的能力预计将推动全球饲料酸化剂市场在预测期内以 5.6% 的复合年增长率增长。
- 全球饲料酸味剂市场预计将成为全球主要饲料添加剂市场之一,到 2022 年将占全球饲料添加剂市场的 7%。饲料酸味剂作为抗生素的替代品,透过促进动物生长和新陈代谢,提高对细菌等有害病原体的抵抗力,已经变得越来越重要。
- 乳酸因其易于获取而占据 2022 年全球饲料酸味剂市场金额的最大份额,为 34.4%。然而,丙酸预计将成为成长最快的市场,预测期内复合年增长率为 5.7%。
- 2022 年,亚太地区是全球最大的饲料酸味剂市场地区,市值达 7.282 亿美元。该地区较高的市场占有率归因于高渗透率和2022年约5亿吨的饲料产量。
- 美国成为全球饲料酸味剂市场最大的国家,2022 年占 18.3% 的市场占有率,金额约 4 亿美元。这一市场地位主要归功于大规模商业性畜牧养殖和国家注重在畜牧养殖场引进新生产方法。预计日本和墨西哥在预测期内将实现成长,由于这些国家的投资增加,复合年增长率将达到 6.3%。
- 全球人口的成长、饲料产量的增加以及对酸味剂作为抗生素替代品的认识的不断提高,预计将推动饲料酸味剂市场的发展,预计预测期内的复合年增长率为 5.6%。
饲料酸味剂市场的全球趋势
市场对动物性蛋白质和鸡蛋等家禽产品的需求不断增长,加上对家禽业的投资不断增加,导致家禽数量不断增加。
- 近年来,吃鸡人口大幅增加,主要原因是日常饮食中对鸡肉和鸡蛋的需求不断增加。在美国,猪肉等其他肉类价格的上涨推动了人们转向鸡肉製品的转变。 2017年至2021年间,欧洲鸡蛋消费量也将成长4.6%,到2021年达到6,135吨。
- 亚太地区是最大的家禽生产地区,预计 2022 年产量将比 2017 年增加 6.6%。鸡肉产量增加的原因是,非洲猪瘟爆发后对动物性蛋白质的需求增加,导致猪肉供应减少。中国占世界鸡肉产量的40%,饲养蛋鸡超过9亿隻,其最大的蛋鸡养殖中心每年可孵化出6000万隻鸡雏。
- 预测期内(2023-2029 年),中东地区的鸡肉产量也预计将成长。沙乌地阿拉伯的 Almarai 等公司正在大力投资该产业,斥资 11.2 亿美元建立新农场以扩大生产。
- 预计家禽产品需求的上升和家禽业投资的增加将推动饲料产量的成长。预计这将在预测期内推动全球市场对饲料添加剂的需求。随着这些发展,家禽业将在未来几年内实现显着成长。
随着消费者对水产品的需求不断增加,亚太地区和南美洲的政府也采取倡议,增加养殖鱼类的饲料产量。
- 水产养殖业的成长导致饲料需求激增,进而推动了配合饲料产量的成长。 2022年,复合饲料产量与前一年同期比较%,而鱼饲料产量在2017年至2022年间增加了46.3%。鱼饲料消费量的增加是由于需要维持和改善水产品的性能并提高生产力以满足日益增长的海鲜需求。
- 由于亚太地区鱼类消费量和产量高,鱼饲料在 2022 年占饲料酸味剂市场的 73.2%。继鱼之后,虾子和其他海洋物种最为普遍,其中欧洲国家和美国从其他地区大量进口虾子。为了满足日益增长的水产品需求,各国均致力于扩大水产养殖产量。例如,印度已将渔业部的预算拨款从 2020 年的 1.141 亿美元增加到 2021 年的 1.688 亿美元,以提高产量,预计这将导致预测期内饲料需求增加。
- 由于水产养殖业的扩张,南美洲的饲料产量也在增加,到 2022 年将达到 510 万吨,比 2017 年增加 46.4%。该地区是主要的水产品消费区之一,水产品需求的增加推动了水产养殖产量的成长。
- 随着水产养殖业不断增长以满足日益增长的需求,该行业的发展及其扩张重点预计将推动饲料产量的增长。预计预测期内水生生物饲料产量的增加将有助于水产养殖业的成长。
饲料酸味剂产业概况
饲料酸味剂市场呈现中度整合态势,前五大公司合计占有41.05%的市占率。市场的主要企业是:安迪苏、BASFSE、嘉吉公司、帝斯曼营养产品股份公司和 SHV(Nutreco NV)(按字母顺序排列)。
其他福利
- Excel 格式的市场预测 (ME) 表
- 3 个月的分析师支持
目录
第 1 章执行摘要和主要发现
第二章 报告要约
第 3 章 简介
- 研究假设和市场定义
- 研究范围
- 调查方法
第四章 产业主要趋势
- 动物数量
- 家禽
- 反刍动物
- 猪
- 饲料生产
- 水产养殖
- 家禽
- 反刍动物
- 养猪业
- 法律规范
- 澳洲
- 巴西
- 加拿大
- 中国
- 法国
- 德国
- 印度
- 印尼
- 义大利
- 日本
- 墨西哥
- 荷兰
- 菲律宾
- 俄罗斯
- 南非
- 韩国
- 西班牙
- 泰国
- 土耳其
- 英国
- 美国
- 越南
- 价值链与通路分析
第五章 市场区隔
- 副添加剂
- 富马酸
- 乳酸
- 丙酸
- 其他酸味剂
- 动物
- 水产养殖
- 亚动物
- 鱼
- 虾
- 其他养殖物种
- 家禽
- 按亚动物
- 肉鸡
- 图层
- 其他鸟类
- 反刍动物
- 按亚动物
- 肉牛
- 乳牛
- 其他反刍动物
- 猪
- 其他动物
- 水产养殖
- 地区
- 非洲
- 按国家
- 埃及
- 肯亚
- 南非
- 非洲其他地区
- 亚太地区
- 按国家
- 澳洲
- 中国
- 印度
- 印尼
- 日本
- 菲律宾
- 韩国
- 泰国
- 越南
- 其他亚太地区
- 欧洲
- 按国家
- 法国
- 德国
- 义大利
- 荷兰
- 俄罗斯
- 西班牙
- 土耳其
- 英国
- 其他欧洲国家
- 中东
- 按国家
- 伊朗
- 沙乌地阿拉伯
- 其他中东地区
- 北美洲
- 按国家
- 加拿大
- 墨西哥
- 美国
- 北美其他地区
- 南美洲
- 按国家
- 阿根廷
- 巴西
- 智利
- 南美洲其他地区
- 非洲
第六章 竞争格局
- 重大策略倡议
- 市场占有率分析
- 业务状况
- 公司简介.
- Adisseo
- Alltech, Inc.
- BASF SE
- Borregaard AS
- Cargill Inc.
- DSM Nutritional Products AG
- Impextraco NV
- Kemin Industries
- SHV(Nutreco NV)
- Yara International ASA
第七章:执行长的关键策略问题
第 8 章 附录
- 世界概况
- 概述
- 五力分析框架
- 全球价值链分析
- 全球市场规模和 DRO
- 资讯来源和进一步阅读
- 图表清单
- 关键见解
- 资料包
- 词彙表
简介目录
Product Code: 47984
The Feed Acidifiers Market size is estimated at 2.72 billion USD in 2025, and is expected to reach 3.58 billion USD by 2030, growing at a CAGR of 5.59% during the forecast period (2025-2030).
- Feed acidifiers are an important component of animal feed, promoting growth and metabolism, increasing feed intake, and protecting against harmful pathogens while reducing the reliance on antibiotics. In 2022, feed acidifiers represented 7% of the global feed additives market, making them one of the most significant types of feed additives worldwide.
- Asia-Pacific was the largest regional market for feed acidifiers, accounting for 31.3% of the market in 2022. North America and Europe followed closely, with market shares of 26.1% and 23%, respectively. The higher share of Asia-Pacific was attributed to the higher penetration rates of additives and a greater animal population. The United States is one of the largest producers and exporters of different meats, such as poultry and beef meat, which has helped North America become one of the largest feed manufacturers. The adoption of feed acidifiers is high in the region as an alternative to antibiotics for producing high-quality feed.
- Propionic acid was the most widely used feed acidifier, accounting for the largest share of the global feed acidifiers market in 2022, valued at USD 0.8 billion. This was due to its antimicrobial properties and ability to inhibit the growth of mold and some bacteria at low concentrations. Its share was followed by fumaric acid and lactic acid in terms of value.
- The other feed acidifiers segment is expected to grow at a similar rate with a CAGR of 5.6% during the forecast period, primarily due to the acidifiers' ability to increase animal feed intake and the productivity of animals.
- The increasing awareness of the beneficial usage of feed additives, the growing trend of commercial farming, and the ability of acidifiers to function as antibiotics are expected to drive the global feed acidifiers market with a CAGR of 5.6% during the forecast period.
- The global feed acidifiers market emerged as one of the significant feed additive markets worldwide, accounting for 7% of the global feed additives market in 2022. Feed acidifiers gained importance in promoting animal growth and metabolism and resistance to harmful pathogens such as bacteria, thereby serving as an alternative to antibiotics.
- Lactic acid had the largest market share of 34.4% in the global feed acidifiers market value in 2022, owing to its easier availability. However, propionic acid is expected to emerge as the fastest-growing market, registering a CAGR of 5.7% during the forecast period, mainly due to product innovations and growing market penetration.
- Asia-Pacific was the largest region in the world for the feed acidifiers market in 2022, accounting for a market value of USD 728.2 million. This region's higher market share can be attributed to its higher penetration rate and feed production volume, which was around 0.5 billion metric tons in 2022.
- The United States emerged as the largest country globally for the feed acidifiers market, accounting for 18.3% of the market share in 2022, which was nearly USD 0.4 billion in value. This market position is mainly due to extensive commercial animal cultivation and the country's focus on implementing new production practices in animal farms. Both Japan and Mexico are expected to grow and register a CAGR of 6.3% during the forecast period due to increasing investments in these countries.
- The global population increase, increase in feed production, and the growing awareness of acidifiers as an alternative to antibiotics are expected to drive the feed acidifiers market, registering a CAGR of 5.6% during the forecast period.
Global Feed Acidifiers Market Trends
High demand for animal protein and poultry products such as eggs with increasing investment in poultry sector is increasing poultry population
- The poultry population has significantly increased in recent years, primarily due to the growing demand for chicken meat and eggs in daily diets. The shift toward poultry products has been driven in the United States by the increasing prices of other meat, such as pig meat. The consumption of eggs in Europe also increased by 4.6% between 2017 and 2021, reaching 6,135 metric ton in 2021.
- Asia-Pacific is the largest producer of poultry birds, with production increasing by 6.6% in 2022 from 2017. The rise in poultry production was due to the growing demand for animal protein following the outbreak of African Swine Fever, which reduced the pork meat supply. China, which accounts for 40% of global poultry production, has more than 900 million stock-laying hens, and the largest layer poultry farming center can hatch 60 million chicks annually.
- The Middle East is also expected to witness growth in poultry production in the forecast period (2023-2029). Companies such as Almarai in Saudi Arabia have invested heavily in the industry, with the company having spent USD 1.12 billion on establishing new farms to expand production.
- The increasing demand for poultry products and rising investments in the poultry industry are expected to boost feed production. This, in turn, is expected to drive the demand for feed additives in the global market during the forecast period. Due to these developments, the poultry industry is poised for significant growth in the coming years.
The growing demand for seafood consumption in Asia-Pacific and South America, and government initiatives is increasing the feed production for aquaculture species
- The demand for feed is rapidly increasing due to the growth of aquaculture, which is driving the growth of compound feed production. In 2022, compound feed production increased by 13.1% from the previous year, and fish feed production increased by 46.3% between 2017 and 2022. The rise in consumption of fish feed is driven by the need to maintain and improve the performance of aquatic animals and increase productivity to meet the growing demand for seafood.
- Fish feed accounted for 73.2% of the feed acidifiers market in 2022, as fish is highly consumed and produced in the Asia-Pacific region. Fish was followed by shrimp and other aquatic species, with shrimp being highly imported by European countries and the United States from other regions. Countries are focusing on increasing aquaculture production to meet the growing demand for seafood. For instance, India increased its budget allocation to the Department of Fisheries from USD 114.1 million in 2020 to USD 168.8 million in 2021 to increase production, which is expected to boost the demand for feed during the forecast period.
- South America is also experiencing an increase in feed production, which rose by 46.4% in 2022 from 2017 to reach 5.1 million metric ton, in line with the expansion of aquaculture farming. The region is one of the major seafood-consuming regions, and the increasing demand for seafood is driving the growth of aquaculture production.
- As aquaculture continues to increase to meet the growing demand, the development of the industry and a focus on its expansion are expected to fuel the growth of feed production. This increase in feed production for aquatic species is expected to aid in the growth of the aquaculture segment during the forecast period.
Feed Acidifiers Industry Overview
The Feed Acidifiers Market is moderately consolidated, with the top five companies occupying 41.05%. The major players in this market are Adisseo, BASF SE, Cargill Inc., DSM Nutritional Products AG and SHV (Nutreco NV) (sorted alphabetically).
Additional Benefits:
- The market estimate (ME) sheet in Excel format
- 3 months of analyst support
TABLE OF CONTENTS
1 EXECUTIVE SUMMARY & KEY FINDINGS
2 REPORT OFFERS
3 INTRODUCTION
- 3.1 Study Assumptions & Market Definition
- 3.2 Scope of the Study
- 3.3 Research Methodology
4 KEY INDUSTRY TRENDS
- 4.1 Animal Headcount
- 4.1.1 Poultry
- 4.1.2 Ruminants
- 4.1.3 Swine
- 4.2 Feed Production
- 4.2.1 Aquaculture
- 4.2.2 Poultry
- 4.2.3 Ruminants
- 4.2.4 Swine
- 4.3 Regulatory Framework
- 4.3.1 Australia
- 4.3.2 Brazil
- 4.3.3 Canada
- 4.3.4 China
- 4.3.5 France
- 4.3.6 Germany
- 4.3.7 India
- 4.3.8 Indonesia
- 4.3.9 Italy
- 4.3.10 Japan
- 4.3.11 Mexico
- 4.3.12 Netherlands
- 4.3.13 Philippines
- 4.3.14 Russia
- 4.3.15 South Africa
- 4.3.16 South Korea
- 4.3.17 Spain
- 4.3.18 Thailand
- 4.3.19 Turkey
- 4.3.20 United Kingdom
- 4.3.21 United States
- 4.3.22 Vietnam
- 4.4 Value Chain & Distribution Channel Analysis
5 MARKET SEGMENTATION (includes market size in Value in USD and Volume, Forecasts up to 2030 and analysis of growth prospects)
- 5.1 Sub Additive
- 5.1.1 Fumaric Acid
- 5.1.2 Lactic Acid
- 5.1.3 Propionic Acid
- 5.1.4 Other Acidifiers
- 5.2 Animal
- 5.2.1 Aquaculture
- 5.2.1.1 By Sub Animal
- 5.2.1.1.1 Fish
- 5.2.1.1.2 Shrimp
- 5.2.1.1.3 Other Aquaculture Species
- 5.2.2 Poultry
- 5.2.2.1 By Sub Animal
- 5.2.2.1.1 Broiler
- 5.2.2.1.2 Layer
- 5.2.2.1.3 Other Poultry Birds
- 5.2.3 Ruminants
- 5.2.3.1 By Sub Animal
- 5.2.3.1.1 Beef Cattle
- 5.2.3.1.2 Dairy Cattle
- 5.2.3.1.3 Other Ruminants
- 5.2.4 Swine
- 5.2.5 Other Animals
- 5.2.1 Aquaculture
- 5.3 Region
- 5.3.1 Africa
- 5.3.1.1 By Country
- 5.3.1.1.1 Egypt
- 5.3.1.1.2 Kenya
- 5.3.1.1.3 South Africa
- 5.3.1.1.4 Rest of Africa
- 5.3.2 Asia-Pacific
- 5.3.2.1 By Country
- 5.3.2.1.1 Australia
- 5.3.2.1.2 China
- 5.3.2.1.3 India
- 5.3.2.1.4 Indonesia
- 5.3.2.1.5 Japan
- 5.3.2.1.6 Philippines
- 5.3.2.1.7 South Korea
- 5.3.2.1.8 Thailand
- 5.3.2.1.9 Vietnam
- 5.3.2.1.10 Rest of Asia-Pacific
- 5.3.3 Europe
- 5.3.3.1 By Country
- 5.3.3.1.1 France
- 5.3.3.1.2 Germany
- 5.3.3.1.3 Italy
- 5.3.3.1.4 Netherlands
- 5.3.3.1.5 Russia
- 5.3.3.1.6 Spain
- 5.3.3.1.7 Turkey
- 5.3.3.1.8 United Kingdom
- 5.3.3.1.9 Rest of Europe
- 5.3.4 Middle East
- 5.3.4.1 By Country
- 5.3.4.1.1 Iran
- 5.3.4.1.2 Saudi Arabia
- 5.3.4.1.3 Rest of Middle East
- 5.3.5 North America
- 5.3.5.1 By Country
- 5.3.5.1.1 Canada
- 5.3.5.1.2 Mexico
- 5.3.5.1.3 United States
- 5.3.5.1.4 Rest of North America
- 5.3.6 South America
- 5.3.6.1 By Country
- 5.3.6.1.1 Argentina
- 5.3.6.1.2 Brazil
- 5.3.6.1.3 Chile
- 5.3.6.1.4 Rest of South America
- 5.3.1 Africa
6 COMPETITIVE LANDSCAPE
- 6.1 Key Strategic Moves
- 6.2 Market Share Analysis
- 6.3 Company Landscape
- 6.4 Company Profiles (includes Global Level Overview, Market Level Overview, Core Business Segments, Financials, Headcount, Key Information, Market Rank, Market Share, Products and Services, and Analysis of Recent Developments).
- 6.4.1 Adisseo
- 6.4.2 Alltech, Inc.
- 6.4.3 BASF SE
- 6.4.4 Borregaard AS
- 6.4.5 Cargill Inc.
- 6.4.6 DSM Nutritional Products AG
- 6.4.7 Impextraco NV
- 6.4.8 Kemin Industries
- 6.4.9 SHV (Nutreco NV)
- 6.4.10 Yara International ASA
7 KEY STRATEGIC QUESTIONS FOR FEED ADDITIVE CEOS
8 APPENDIX
- 8.1 Global Overview
- 8.1.1 Overview
- 8.1.2 Porter's Five Forces Framework
- 8.1.3 Global Value Chain Analysis
- 8.1.4 Global Market Size and DROs
- 8.2 Sources & References
- 8.3 List of Tables & Figures
- 8.4 Primary Insights
- 8.5 Data Pack
- 8.6 Glossary of Terms
02-2729-4219
+886-2-2729-4219
 饲料酸添加剂市场:按类型、畜种、剂型、应用和分销管道划分-2026-2032年全球市场预测
 2026年全球饲料酸化剂市场报告
 饲料酸化剂市场规模、份额和成长分析(按类型、剂型、化合物、畜种和地区划分)-2026-2033年产业预测
 饲料酸化剂市场-全球产业规模、份额、趋势、机会和预测,按添加剂(富马酸、乳酸、丙酸)、动物(水产养殖、家禽、反刍动物、猪)、地区和竞争细分,2020-2030 年预测
 亚太地区酸味剂市场占有率分析、产业趋势与统计、成长预测(2025-2030 年)北美饲料酸味剂:市场占有率分析、行业趋势和成长预测(2025-2030 年)欧洲饲料酸味剂:市场占有率分析、行业趋势和统计数据、成长预测(2025-2030 年)
 饲料酸味剂市场:未来预测(2025-2030)