


 |
市场调查报告书
商品编码
1683780
美国电动自行车:市场占有率分析、行业趋势和统计、成长预测(2025-2029 年)United States E-bike - Market Share Analysis, Industry Trends & Statistics, Growth Forecasts (2025 - 2029) |
||||||
※ 本网页内容可能与最新版本有所差异。详细情况请与我们联繫。
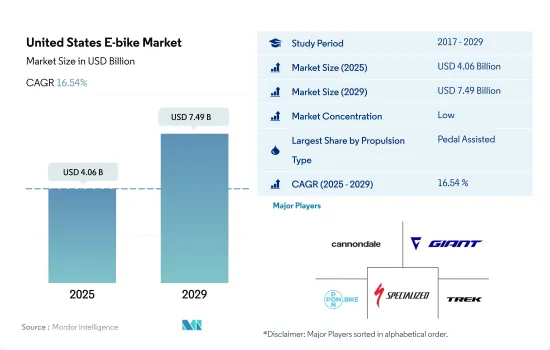
美国电动自行车市场规模预计在 2025 年为 40.6 亿美元,预计到 2029 年将达到 74.9 亿美元,预测期内(2025-2029 年)的复合年增长率为 16.54%。
推进系统细分市场概览
- 随着每年推出更有效率、更强大的电动车,电动车产业正稳步改变汽车格局。助力电动自行车和高速电动自行车在美国的各行各业中广泛应用。作为一种更清洁、更环保的交通途径,它正受到人们的关注。美国电动自行车进口量和销量的激增,促使多家电动自行车製造商筹集资金以扩大公司规模。根据轻型电动车协会统计,2021年该国进口了790万辆电动自行车,是2020年的1.8倍。
- 由于新冠疫情的影响,助力电动自行车在全国各地流行起来。消费者越来越关注自己的健康和福祉。到 2021 年,预计美国 60% 的旅行距离将少于 5 英里,电动自行车可以轻鬆满足这一需求。 COVID-19 疫情以多种方式影响了市场,最初由于製造业的封锁和停工而抑制了需求。但随着法规的放宽,对电动自行车的需求获得了显着的增长,美国经销商报告称,电动自行车的销量比上与前一年同期比较增长了 100% 以上。
- 政府对共享单车计画、自行车道和行人友善道路的投入增加,可能激发消费者对高速电动自行车和油门辅助电动自行车的兴趣。预测期内,对电动自行车城市道路基础设施的投资也有望推动电动自行车市场的发展。目前的投资、资金筹措和倡议正在帮助促进美国各地的电动自行车销售。
美国电动自行车市场的趋势
美国电动自行车的普及率一直呈现高成长,显示其日益普及且市场不断增长。
- 近年来,自行车逐渐成为美国流行的日常通勤选择。电动自行车的推出也导致近年来自行车需求量的激增。污染加剧、交通状况恶化以及燃料价格上涨正推动电动自行车在美国各地的流行。电动自行车在各个年龄层中越来越受欢迎。 50岁以上的人也对电动自行车表现出浓厚的兴趣。因此,2019年电动自行车的普及率较2018年提升了2.4%。
- 2020 年新冠疫情对美国电动自行车市场产生了正面影响。社交距离措施、人们对使用公共的担忧等因素导致消费者出行偏好发生变化,进一步推动2020年的电动自行车普及率较2019年增长2.7%。
- 电动自行车公司正在推出配备先进技术的新型车型,以吸引客户并提高在美国的销售量。此外,消费者偏好更清洁、更健康的交通方式,同时节省燃料成本,也促使电动自行车的普及率不断提高。受这些因素影响,预计2021年该国电动自行车普及率将比2020年增加3%,预测期内预计将成长12.24%。
在美国,每天出游5至15公里的人数比例稳定增加,呈现一致的通勤模式。
- 近年来,美国对自行车的需求大幅增加。儘管对自行车的需求正在增加,但与其他交通途径相比,5至15公里通勤距离的自行车使用率仍然较低。 2019年,美国只有0.6%的工人选择骑自行车作为交通途径。
- 2020 年,在新冠疫情爆发后,数百万美国人重新发现骑自行车是一种安全且社会边缘的交通途径。配备先进电池组的电动自行车续航里程可达 40-45 公里,也推动了每日出行距离为 5-15 公里的消费者的需求。由于疫情期间健身房和健身俱乐部关闭,骑自行车也成为人们首选的运动方式。
- 然而,即使在疫情结束后,许多人仍然骑自行车到5-15公里范围内的职场、办公室、企业和市场。到2022年,超过15%的人将使用自行车作为交通工具。骑自行车有益健康,是一种碳排放的交通方式,不耗费燃料,还能节省交通拥挤的时间。这些优势极大地促进了自行车的普及,并可能在预测期内进一步促进该国的市场发展。
美国电动自行车产业概况
美国电动自行车市场较为分散,前五大公司的市占率为30.99%。该市场的主要企业是:Cycling Sports Group, Inc.、Giant Manufacturing Co.、Pon Holdings BV、Specialized Bicycle Components Inc. 和 Trek Bicycle Corporation(按字母顺序排列)。
其他福利
- Excel 格式的市场预测 (ME) 表
- 3 个月的分析师支持
目录
第 1 章执行摘要和主要发现
第二章 报告要约
第 3 章 简介
- 研究假设和市场定义
- 研究范围
- 调查方法
第四章 产业主要趋势
- 自行车销量
- 人均国内生产毛额
- 通货膨胀率
- 电动自行车普及率
- 每天出游 5-15 公里的人口/通勤者百分比
- 自行车出租
- 电动自行车电池价格
- 电池化学价格表
- 超本地化配送
- 自行车道
- 徒步人数
- 电池充电容量
- 交通拥堵指数
- 法律规范
- 价值链与通路分析
第五章 市场区隔
- 推进类型
- 踏板辅助
- 高速电动自行车
- 油门辅助
- 应用程式类型
- 货运/公用设施
- 城市/城区
- 健行
- 电池类型
- 铅酸电池
- 锂离子电池
- 其他的
第六章 竞争格局
- 主要策略趋势
- 市场占有率分析
- 业务状况
- 公司简介
- Ariel Rider
- Cycling Sports Group, Inc.
- Giant Manufacturing Co.
- Pon Holdings BV
- Propella Electric Bikes
- Rad Power Bikes
- Ride Aventon Inc.
- Specialized Bicycle Components Inc.
- Trek Bicycle Corporation
- VanMoof
第七章:执行长的关键策略问题
第 8 章 附录
- 世界概况
- 概述
- 五力分析框架
- 全球价值链分析
- 市场动态(DRO)
- 资讯来源和进一步阅读
- 图片列表
- 关键见解
- 资料包
- 词彙表
The United States E-bike Market size is estimated at 4.06 billion USD in 2025, and is expected to reach 7.49 billion USD by 2029, growing at a CAGR of 16.54% during the forecast period (2025-2029).
Propulsion segment market overview
- The electric vehicle industry is steadily changing the automotive industry's landscape with the introduction of more effective and potent electric automobiles every year. Pedal-assisted and speed pedelec e-bikes are used in a wide range of industries and applications across the United States. They are seen as a cleaner and greener mode of transportation for short distances. Several e-bike producers raised funds for company expansions due to a spike in e-bike imports and sales across the country. According to the Light Electric Vehicle Association, in 2021, 7,900,00 e-bikes were imported into the country, 1.8 times more than in 2020.
- Due to the COVID-19 pandemic, pedal-assisted e-bikes have gained popularity across the country. Consumers have become more interested in their health and well-being. By 2021, 60% of trips in the United States were estimated to be less than 5 miles, which can be easily covered by an e-bike. The COVID-19 pandemic had a mixed impact on the market, with initial lockdowns and shutdowns of manufacturing units resulting in a slump in demand. However, as restrictions eased, demand for e-bikes gained significant momentum, with various dealers in the United States reporting more than a 100% increase in Y-o-Y sales.
- Increasing government investments in bike-sharing programs, bike lanes, and more pedestrian-friendly streets are likely to raise consumer interest in speed pedelec and throttle-assisted e-bikes in the future. During the forecast period, investments in city road infrastructure for e-bikes are also expected to boost the e-bike market. The current investments, funding, and initiatives are helping boost the sales of e-bikes across the country.
United States E-bike Market Trends
The US shows a consistent and strong increase in E-Bike adoption rates, indicating a growing popularity and market expansion.
- Over the past few years, bicycles have gradually become one of the popular modes of daily commuting in the United States. The introduction of e-bikes also surged the demand for bicycles in recent years. Rising pollution and traffic conditions, along with rising fuel prices, have boosted the adoption of e-bikes across the country. E-bikes are gaining popularity among a range of age groups. People between the age of 50 and above are also showing high interest in these bikes. As a result, the adoption rate for e-bikes increased by 2.4% in 2019 compared to 2018.
- The COVID-19 pandemic in 2020 had a positive impact on the US e-bike market. Factors such as social distancing measures and anxiety among people about using public transportation resulted in changing travel preferences among consumers, further boosting the adoption of e-bicycles by 2.7% in 2020 compared to 2019.
- E-bike companies are launching new models with advanced technologies to attract customers in the United States and boost their sales significantly. Consumer preferences for a cleaner and healthier ride while saving fuel costs are also contributing to the higher adoption rate of e-bicycles. Owing to such factors, the country witnessed a rise of 3% in the e-bike adoption rate in 2021 compared to 2020, which is projected to grow by 12.24% during the forecast period.
The US shows a steady increase in the population with a 5-15 km daily travel distance, indicating a consistent commuting pattern.
- Over the past few years, the United States has witnessed significant demand for bicycles. Though there is rising demand for bicycles, their use in the commute of 5-15 km is still low compared to the other modes of transportation, as the majority of people use personal automobiles for office and business commutes. Only 0.6% of the workers across the United States opted for bicycles as a mode of transport in 2019.
- In 2020, millions of Americans rediscovered bicycles as a safe, socially distant method of transportation after the COVID-19 outbreak. The introduction of e-bikes with advanced battery packs that provide an enhanced range of up to 40-45 km is also boosting the demand from consumers who have a daily travel distance of 5-15 km. During the pandemic, bicycles also became a preferred form of exercise among people due to the closure of gyms and fitness clubs.
- However, post the pandemic, many people continued using bicycles to commute to work, offices, businesses, and marketplaces within a range of 5-15 km. More than 15% of the users used bicycles as a mode of transport in 2022. Bicycles offer health benefits, carbon-free rides, no fuel costs, and time-saving in traffic congestion. These benefits are highly contributing to the rising adoption of bicycles, which may further boost the market in the country during the forecast period.
United States E-bike Industry Overview
The United States E-bike Market is fragmented, with the top five companies occupying 30.99%. The major players in this market are Cycling Sports Group, Inc., Giant Manufacturing Co., Pon Holdings B.V., Specialized Bicycle Components Inc. and Trek Bicycle Corporation (sorted alphabetically).
Additional Benefits:
- The market estimate (ME) sheet in Excel format
- 3 months of analyst support
TABLE OF CONTENTS
1 EXECUTIVE SUMMARY & KEY FINDINGS
2 REPORT OFFERS
3 INTRODUCTION
- 3.1 Study Assumptions & Market Definition
- 3.2 Scope of the Study
- 3.3 Research Methodology
4 KEY INDUSTRY TRENDS
- 4.1 Bicycle Sales
- 4.2 GDP Per Capita
- 4.3 Inflation Rate
- 4.4 Adoption Rate Of E-bikes
- 4.5 Percent Population/commuters With 5-15 Km Daily Travel Distance
- 4.6 Bicycle Rental
- 4.7 E-bike Battery Price
- 4.8 Price Chart Of Different Battery Chemistry
- 4.9 Hyper-local Delivery
- 4.10 Dedicated Bicycle Lanes
- 4.11 Number Of Trekkers
- 4.12 Battery Charging Capacity
- 4.13 Traffic Congestion Index
- 4.14 Regulatory Framework
- 4.15 Value Chain & Distribution Channel Analysis
5 MARKET SEGMENTATION (includes market size in Value in USD and Volume, Forecasts up to 2029 and analysis of growth prospects)
- 5.1 Propulsion Type
- 5.1.1 Pedal Assisted
- 5.1.2 Speed Pedelec
- 5.1.3 Throttle Assisted
- 5.2 Application Type
- 5.2.1 Cargo/Utility
- 5.2.2 City/Urban
- 5.2.3 Trekking
- 5.3 Battery Type
- 5.3.1 Lead Acid Battery
- 5.3.2 Lithium-ion Battery
- 5.3.3 Others
6 COMPETITIVE LANDSCAPE
- 6.1 Key Strategic Moves
- 6.2 Market Share Analysis
- 6.3 Company Landscape
- 6.4 Company Profiles
- 6.4.1 Ariel Rider
- 6.4.2 Cycling Sports Group, Inc.
- 6.4.3 Giant Manufacturing Co.
- 6.4.4 Pon Holdings B.V.
- 6.4.5 Propella Electric Bikes
- 6.4.6 Rad Power Bikes
- 6.4.7 Ride Aventon Inc.
- 6.4.8 Specialized Bicycle Components Inc.
- 6.4.9 Trek Bicycle Corporation
- 6.4.10 VanMoof
7 KEY STRATEGIC QUESTIONS FOR E BIKES CEOS
8 APPENDIX
- 8.1 Global Overview
- 8.1.1 Overview
- 8.1.2 Porter's Five Forces Framework
- 8.1.3 Global Value Chain Analysis
- 8.1.4 Market Dynamics (DROs)
- 8.2 Sources & References
- 8.3 List of Tables & Figures
- 8.4 Primary Insights
- 8.5 Data Pack
- 8.6 Glossary of Terms
 2026-2030年全球折迭式电动自行车市场
 专业电动自行车市场:依马达配置、电池容量、价格范围、应用和分销管道划分-2026-2032年全球预测高阶电动自行车市场:2026 年至 2032 年全球预测,按自行车类型、价格范围、应用、电池容量、通路和马达功率划分。脚踏辅助电动自行车市场:按类型、马达功率、电池容量、辅助等级、价格范围、分销管道和应用划分-全球预测,2026-2032年锂离子电池驱动自行车市场:按型号、驱动系统、电池容量、电池类型、额定输出功率和推进方式划分-全球预测,2026-2032年
 电动自行车市场规模、份额、趋势和预测:按交通方式、马达类型、电池类型、等级、设计、应用和地区划分(2026-2034 年)
 电动自行车市场分析及预测(至2035年):依类型、产品类型、技术、组件、应用、最终用户、功能、安装类型及模式划分
 电动自行车市场规模、份额和趋势分析报告:按驱动系统、电池类型、最终用途、地区和细分市场预测(2026-2033 年)
 电动自行车市场-全球产业规模、份额、趋势、机会及预测(按电池、类型、车架材料、地区和竞争格局划分,2021-2031年)小型电动自行车打气筒市场按产品类型、应用、通路通路、销售管道和电源划分-2026年至2032年全球预测