


 |
市场调查报告书
商品编码
1684070
印度干混砂浆:市场占有率分析、行业趋势和统计、成长预测(2025-2030 年)India Dry Mix Mortar - Market Share Analysis, Industry Trends & Statistics, Growth Forecasts (2025 - 2030) |
||||||
价格
※ 本网页内容可能与最新版本有所差异。详细情况请与我们联繫。
简介目录
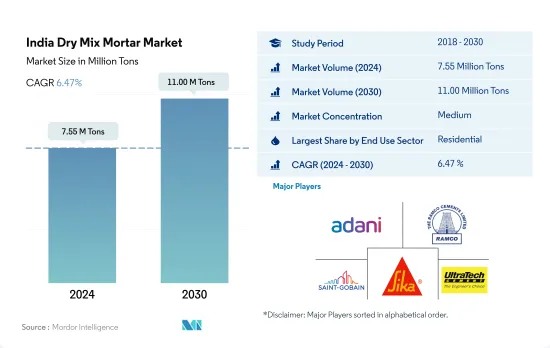
预计 2024 年印度干混砂浆市场规模为 755 万吨,到 2030 年将达到 1,100 万吨,预测期内(2024-2030 年)的复合年增长率为 6.47%。
预计到 2030 年,印度甲级办公空间将达到 12 亿平方英尺,这可能会推动未来对干混砂浆的需求。
- 2022年,印度干混砂浆消费量与前一年同期比较显着成长7.13%,主要原因是住宅和基础建设领域的需求不断增长。
- 到 2022 年,住宅领域所占份额将达到 60.9% 左右,成为印度干混砂浆的主要消费者。快速的都市化、政府措施以及国内外投资预计将刺激住宅需求,导致住宅增加。例如,印度计划在2021年至2031年期间投资7,000亿美元,用于加强城市交通和经济适用住宅等城市基础设施服务。此外,预计 2023 年至 2030 年间,该国新建住宅占地面积将增加 6.02 亿平方英尺,进一步凸显了其成长潜力。因此,预计预测期内市场复合年增长率将达到 6.56%。
- 印度商业部门预计将主导干混砂浆的消费量,预测期内复合年增长率为 7.24%。由于对购物中心、办公室和零售空间的需求不断增长,预计 2025 年至 2026 年间,该国新的商业占地面积将激增 4,670 万平方英尺。例如,印度前七大城市的甲级办公大楼市场预计到 2026 年将扩大到 10 亿平方英尺,到 2030 年将进一步扩大到 12 亿平方英尺。因此,印度商业领域的干混砂浆市场预计到 2030 年将达到 147 万吨,高于 2023 年的 90.5 万吨。
印度干混砂浆市场趋势
预计到 2030 年,印度甲级办公室市场规模将达到 12 亿平方英尺,进而推动商业建筑领域的需求。
- 2022 年,印度新的商业占地面积比 2021 年成长了 6.2%。零售业需求强劲,尤其是在前七大城市(德里国家首都辖区、班加罗尔、海得拉巴、孟买、普纳、清奈和加尔各答),购物中心面积超过 260 万平方英尺,比 2021 年增长 27%。展望 2023 年,由于外国直接投资 (FDI) 的激增推动了对新办公、零售和其他设施的需求,该行业的新占地面积预计将激增 3,800 万平方英尺。尤其是,预计2023年建筑业发展的外国直接投资流入将达到9,600万美元。
- 2020 年,印度新建商业占地面积较 2019 年下降 68.3%。下降的主要原因是政府在全国范围内实施封锁,导致正在进行的计划停止,供应链紧张,劳动力供应受到影响。然而,随着 2021 年限制措施的放鬆,出现了强劲復苏,新建占地面积激增约 5.26 亿平方英尺。此外,2021 年绿建筑倡议显着增加,约有 55% 的商业计划采用了永续性,进一步刺激了该领域的需求。
- 展望 2030 年,印度新的商业占地面积预计将达到 3.58 亿平方英尺,较 2023 年大幅成长。这一增长带来了对购物中心、办公空间和其他商业设施的需求。例如,印度前七大城市的甲级办公大楼市场到 2026 年将扩大到 10 亿平方英尺,到 2030 年将进一步扩大到 12 亿平方英尺。因此,预计该国新的商业占地面积在预测期内将实现 5.26% 的强劲成长率。
住宅需求增加和房地产行业的扩张将刺激住宅行业的需求
- 2022年,印度住宅占地面积成长9.4%,高于前一年。印度住宅需求激增,前七大城市(德里国家首都辖区、班加罗尔、海得拉巴、孟买、浦那、普纳清奈和加尔各答)总合建造约 402,000 套新房,比 2021 年增加 44%。 2023 年第一季,这些城市的住宅销售量达到 114,000 套,比上年大幅增加 99,500 多套。因此,预计 2023 年印度新建住宅占地面积将比 2022 年增加约 7,100 万平方英尺。
- 2020年,印度住宅产业遭遇挫折,新屋占地面积与前一年同期比较%。下降的原因是全国范围内的封锁、供应链中断、劳动力短缺、建筑生产率放缓以及外国投资下降。不过,印度住宅房地产市场在 2021 年有所復苏,排名前七位的城市新增住宅数量约为 163,000 套。这一激增导致 2021 年住宅领域的新建占地面积与 2020 年相比大幅增加,达到约 6.49 亿平方英尺。
- 展望未来,预计 2023 年至 2030 年间印度住宅产业的复合年增长率将达到 2.95%。这一增长得益于持续的住宅需求、不断增加的投资和有利的政府政策。特别是到2030年,预计印度40%以上的人口将居住在都市区,这将带来约2500万套额外经济适用住宅的需求。此外,到2030年,主要城市的住宅房地产市场预计将达到150万套,这将进一步推动该产业的需求。
印度干混砂浆产业概况
印度干混砂浆市场适度整合,前五大企业占49.72%的市占率。该市场的主要企业是:Adani Group、Ramco Cements、Saint-Gobain、Sika AG 和 UltraTech Cement Ltd.(按字母顺序排列)。
其他福利
- Excel 格式的市场预测 (ME) 表
- 3 个月的分析师支持
目录
第 1 章执行摘要和主要发现
第二章 报告要约
第 3 章 简介
- 研究假设和市场定义
- 研究范围
- 调查方法
第四章 产业主要趋势
- 终端使用领域趋势
- 商业的
- 业/设施
- 基础设施
- 住宅
- 重大基础设施计划(目前和已宣布)
- 法律规范
- 价值链与通路分析
第 5 章。市场区隔(包括市场规模、2030 年预测、成长前景分析)
- 最终用途领域
- 商业的
- 业/设施
- 基础设施
- 住宅
- 应用
- 混凝土保护与维修
- 水泥浆
- 绝缘和饰面系统
- 石膏
- 使成为
- 磁砖胶
- 防水泥浆
- 其他用途
第六章 竞争格局
- 主要策略趋势
- 市场占有率分析
- 业务状况
- 公司简介
- Adani Group
- Ardex Group
- LATICRETE International, Inc.
- MAPEI SpA
- MBCC Group
- Ramco Cements
- Saint-Gobain
- Sika AG
- Tri Polarcon Pvt Ltd
- UltraTech Cement Ltd.
第七章:执行长的关键策略问题
第 8 章 附录
- 世界概况
- 概述
- 五力分析框架(产业吸引力分析)
- 全球价值链分析
- 市场动态(DRO)
- 资讯来源和进一步阅读
- 图片列表
- 关键见解
- 资料包
- 词彙表
简介目录
Product Code: 50002023
The India Dry Mix Mortar Market size is estimated at 7.55 million Tons in 2024, and is expected to reach 11.00 million Tons by 2030, growing at a CAGR of 6.47% during the forecast period (2024-2030).
India's Grade A office space is expected to reach 1.2 billion square feet by 2030, and is likely to drive the demand for dry mix mortar in the future
- In 2022, India's consumption of dry mix mortar saw a notable uptick of 7.13% from the previous year, primarily driven by heightened demand in the residential and infrastructure construction sectors.
- With a share of approximately 60.9% in 2022, the residential sector emerged as the dominant consumer of dry mix mortar in India. Factors such as rapid urbanization, government initiatives, and both foreign and domestic investments are fueling the demand for housing, leading to a projected uptick in residential building construction. For instance, India is eyeing an investment of USD 700 billion between 2021 and 2031 to bolster urban infrastructure services, including urban mobility and affordable housing. Additionally, the projected increase in the country's residential new floor area by 602 million sq. ft from 2023 to 2030 further underscores the growth potential. Consequently, the market is poised to register a CAGR of 6.56% during the forecast period.
- India's commercial sector is set to outpace others in dry mix mortar consumption, with a projected CAGR of 7.24% during the forecast period. The anticipated surge in the country's commercial new floor area by 46.7 million square feet from 2025 to 2026 is driven by rising demands for shopping malls, office and retail spaces, among others. For instance, India's Grade A office market in the top seven cities is on track to expand to 1 billion square feet by 2026 and further to 1.2 billion square feet by 2030. Consequently, the dry mix mortar market for the commercial sector in India is estimated to reach 1.47 million tons in 2030, up from 905 thousand tons in 2023.
India Dry Mix Mortar Market Trends
India's Grade A office market is expected to reach 1.2 billion sq. ft by 2030 and is likely to drive the demand for the commercial construction sector
- In 2022, India's new commercial floor area saw a 6.2% volume growth compared to 2021. The retail sector, particularly in the top seven cities (Delhi NCR, Bangalore, Hyderabad, Mumbai, Pune, Chennai, and Kolkata), witnessed robust demand, adding over 2.6 million sq. ft of mall space, a 27% increase from 2021. Looking ahead to 2023, the sector's new floor area is expected to surge by 38 million sq. ft, driven by a surge in foreign direct investment (FDI) fueling the need for new offices, retail outlets, and other facilities. Notably, the FDI equity inflow for construction development in 2023 was projected to hit USD 96 million.
- In 2020, India's commercial new floor area plummeted by 68.3% in volume compared to 2019. This decline was primarily due to a nationwide lockdown imposed by the government, which disrupted ongoing projects, strained supply chains, and impacted labor availability. However, as restrictions eased in 2021, the country witnessed a significant rebound, with the new floor area surging by approximately 526 million sq. ft. Additionally, 2021 saw a notable uptick in green building initiatives, with around 55% of commercial projects embracing sustainability, further bolstering the demand for the sector.
- Looking ahead to 2030, India's commercial new floor area is projected to hit 358 million sq. ft, a significant jump from 2023. This surge drives a growing appetite for shopping malls, office spaces, and other commercial facilities. For instance, India's Grade A office market in the top seven cities is set to expand to 1 billion sq. ft by 2026 and further to 1.2 billion sq. ft by 2030. Consequently, the country's commercial new floor area is poised to witness a robust CAGR of 5.26% during the forecast period.
Rise in demand for housing units and increasing real estate sector to boost residential sector demand
- In 2022, India witnessed a 9.4% growth in residential floor area, outpacing the previous year. The demand for housing in the country surged, with the top seven cities (Delhi NCR, Bangalore, Hyderabad, Mumbai, Pune, Chennai, and Kolkata) collectively adding approximately 402,000 new units, marking a 44% increase from 2021. In Q1 2023, housing sales in these cities reached 1.14 lakh units, a staggering jump of over 99,500 units from the previous year. Consequently, it was projected that the residential new floor area in India would expand by approximately 71 million sq. ft in 2023 compared to 2022.
- In 2020, the residential sector in India faced a setback, witnessing a 6.25% decline in new floor area compared to the previous year. This decline was attributed to the nationwide lockdown, disruptions in the supply chain, labor shortages, reduced construction productivity, and a dip in foreign investments. However, in 2021, the Indian residential real estate market rebounded, adding around 163,000 new residential units across the top seven cities. This surge translated into a significant increase of about 649 million sq. ft in the residential sector's new floor area in 2021 compared to 2020.
- Looking ahead, the residential sector in India is poised to exhibit a CAGR of 2.95% in terms of volume from 2023 to 2030. This growth can be attributed to sustained housing demand, increased investments, and favorable government policies. Notably, by 2030, it is projected that over 40% of India's population will reside in urban areas, driving a demand for approximately 25 million additional affordable housing units. Furthermore, by 2030, the residential real estate market is expected to hit 1.5 million units in key cities, further fueling the demand in the sector.
India Dry Mix Mortar Industry Overview
The India Dry Mix Mortar Market is moderately consolidated, with the top five companies occupying 49.72%. The major players in this market are Adani Group, Ramco Cements, Saint-Gobain, Sika AG and UltraTech Cement Ltd. (sorted alphabetically).
Additional Benefits:
- The market estimate (ME) sheet in Excel format
- 3 months of analyst support
TABLE OF CONTENTS
1 EXECUTIVE SUMMARY & KEY FINDINGS
2 REPORT OFFERS
3 INTRODUCTION
- 3.1 Study Assumptions & Market Definition
- 3.2 Scope of the Study
- 3.3 Research Methodology
4 KEY INDUSTRY TRENDS
- 4.1 End Use Sector Trends
- 4.1.1 Commercial
- 4.1.2 Industrial and Institutional
- 4.1.3 Infrastructure
- 4.1.4 Residential
- 4.2 Major Infrastructure Projects (current And Announced)
- 4.3 Regulatory Framework
- 4.4 Value Chain & Distribution Channel Analysis
5 MARKET SEGMENTATION (includes market size, forecasts up to 2030 and analysis of growth prospects.)
- 5.1 End Use Sector
- 5.1.1 Commercial
- 5.1.2 Industrial and Institutional
- 5.1.3 Infrastructure
- 5.1.4 Residential
- 5.2 Application
- 5.2.1 Concrete Protection and Renovation
- 5.2.2 Grouts
- 5.2.3 Insulation and Finishing Systems
- 5.2.4 Plaster
- 5.2.5 Render
- 5.2.6 Tile Adhesive
- 5.2.7 Water Proofing Slurries
- 5.2.8 Other Applications
6 COMPETITIVE LANDSCAPE
- 6.1 Key Strategic Moves
- 6.2 Market Share Analysis
- 6.3 Company Landscape
- 6.4 Company Profiles
- 6.4.1 Adani Group
- 6.4.2 Ardex Group
- 6.4.3 LATICRETE International, Inc.
- 6.4.4 MAPEI S.p.A.
- 6.4.5 MBCC Group
- 6.4.6 Ramco Cements
- 6.4.7 Saint-Gobain
- 6.4.8 Sika AG
- 6.4.9 Tri Polarcon Pvt Ltd
- 6.4.10 UltraTech Cement Ltd.
7 KEY STRATEGIC QUESTIONS FOR CONCRETE, MORTARS AND CONSTRUCTION CHEMICALS CEOS
8 APPENDIX
- 8.1 Global Overview
- 8.1.1 Overview
- 8.1.2 Porter's Five Forces Framework (Industry Attractiveness Analysis)
- 8.1.3 Global Value Chain Analysis
- 8.1.4 Market Dynamics (DROs)
- 8.2 Sources & References
- 8.3 List of Tables & Figures
- 8.4 Primary Insights
- 8.5 Data Pack
- 8.6 Glossary of Terms
02-2729-4219
+886-2-2729-4219
 东协干混砂浆:市占率分析、产业趋势与统计、成长预测(2026-2031)干混砂浆:市场占有率分析、产业趋势与统计、成长预测(2026-2031)欧洲干粉砂浆:市场占有率分析、产业趋势与统计、成长预测(2026-2031)
 2026年全球干混砂浆添加剂和化学品市场报告
 塔式干粉砂浆搅拌站市场按产品类型、搅拌能力、应用、最终用途和分销管道划分-2026-2032年全球预测自流平砂浆添加剂市场按类型、形态、应用、终端用户产业和分销管道划分,全球预测,2026-2032年预拌建筑砂浆市场(依产品类型、形态、包装类型、应用、最终用途及通路划分)-2026-2032年全球预测
 干混砂浆添加剂和化学品市场规模、份额和成长分析(按添加剂类型、化学品类型、应用、最终用户和地区划分)—2026-2033年产业预测
 干混砂浆市场规模、份额和成长分析(按产品类型、粘合剂类型、添加剂、最终用户、技术、应用和地区划分)—产业预测(2026-2033 年)
 全球干混砂浆市场:依产品种类、塑化剂种类、应用、黏结剂系统及地区划分(至2032年)
▼