


 |
市场调查报告书
商品编码
1684103
印尼化肥:市场占有率分析、产业趋势与统计、成长预测(2025-2030 年)Indonesia Fertilizer - Market Share Analysis, Industry Trends & Statistics, Growth Forecasts (2025 - 2030) |
||||||
※ 本网页内容可能与最新版本有所差异。详细情况请与我们联繫。
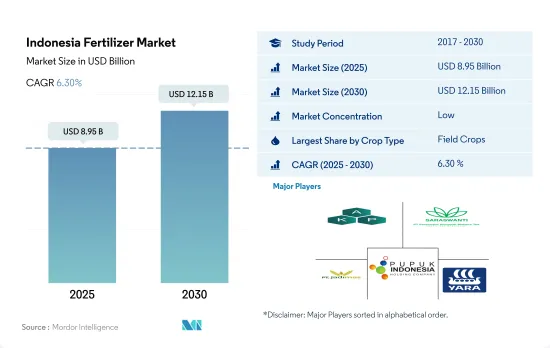
预计 2025 年印尼肥料市场规模将达到 89.5 亿美元,预计 2030 年将达到 121.5 亿美元,预测期内(2025-2030 年)的复合年增长率为 6.30%。
田间作物占日本肥料消耗的大部分
- 2022年,田间作物占印尼肥料市场的92.3%,达39.3亿美元。其中水稻是该国的主要田间作物,印尼是继中国和印度之后的世界第三大米生产国。印尼稻米主要种植区为南苏门答腊省、西爪哇省、中爪哇省、东爪哇省及南苏拉威西省。
- 在农田作物领域,常规肥料将占据最高份额,到 2022 年将达到 76.0%,其余 24.0% 为专用肥料。在特殊肥料领域,常规肥料部分预计从 2023 年到 2030 年的复合年增长率为 6.1%。
- 2022 年,园艺作物占印尼肥料市场的 9.3%。鑑于水果和蔬菜在均衡饮食中的重要性,值得注意的是,2016 年印尼人的水果和蔬菜消费量仅为建议摄取量的 43%。此外,在过去五年中,这种消费量有所下降,现在还不到建议水准的一半。印尼人平均每日水果和蔬菜消费量为173克,远低于建议摄取量400克,显示该产业具有成长潜力。
- 2022年,草坪和观赏作物在印尼肥料市场的占比不到1.0%,主要原因是种植面积有限,仅占该国作物总面积的0.03%。
- 受体育场馆(尤其是足球场)需求不断增长的推动,印尼的草坪和观赏肥料市场呈上升趋势。预计 2023 年至 2030 年期间该产业的复合年增长率为 6.2%。
印尼肥料市场趋势
印尼扩大耕地面积以实现自给自足
- 在印尼,2022年田间作物将占种植面积的89.9%。水稻、玉米、木薯、大豆和花生是印尼主要种植的田间作物。至2022年,水稻将占田间作物种植总面积的56.7%。印尼的低地和高地地区均种植水稻,高地种植通常依赖雨养,且施肥量较低。稻米种植主要集中在爪哇岛,但苏门答腊岛和苏拉威西岛也蓬勃发展。这三个岛屿的稻米产量约占全国总产量的 89%。在印尼,水稻通常生长三个季节:一个雨季作物和两个旱季作物。总产量的约 45% 来自雨季作物,这些作物在 10 月至 12 月种植,3 月和 4 月收穫。
- 玉米是印尼继水稻之后种植面积第二大的作物,约占农田面积的 10.8%。玉米是印尼 1,800 多万人口的主食,有超过 1,000 万个农场种植玉米。 2022 年玉米产量集中在各个地区,包括中爪哇省(占玉米总产量的 16%)、楠榜省(占玉米总产量的 9%)、南苏拉威西省(占玉米总产量的 8%)和北苏门答腊省(占玉米总产量的 7%)。
- 儘管印尼是世界上最大的大米生产国,但2022年印尼仍将从泰国、越南、印度、巴基斯坦和其他国家进口约50万吨大米。为了提高自给率并抑制进口,印尼正致力于提高生产力,而化肥市场是推动这项进程的动力。
在主要营养元素中,氮是农田作物大量使用的元素。
- 氮、磷和钾是植物生长必需的关键营养素。氮(N)和磷(P)是植物组织必需的蛋白质和核酸的主要成分。另一方面,钾(K)在提高收穫的植物产品的品质方面发挥着至关重要的作用。在印尼,水稻、小麦、大豆和玉米是主要田间作物。这些作物的平均施肥量为氮223.8公斤/公顷、磷57.3公斤/公顷和钾88.0公斤/公顷。
- 在主要养分中,氮的施用量最高,田间作物平均氮肥施用量为223.8公斤/公顷。适当使用氮肥可以提高谷粒品质,促进芽生长,并产生强壮的花蕾。早期施用氮肥还可以改善犁地并提高作物产量。磷是第二重要的常量营养素,2022 年施用率为 57.3 公斤/公顷。磷在谷物发育中起着重要作用,有助于早期根系生长、芽叶形成和谷粒灌浆。
- 2022年,印尼田间作物平均钾施用率为88.0公斤/公顷。缺钾症状首先出现在下部叶片。这是因为钾很容易从植物体内的老叶子转移到嫩叶子。症状表现为叶子从尖端到基部沿着外部叶子的边缘变黄并发展为坏死(组织死亡)。主要营养成分的缺乏会对植物的健康、生长和产量产生重大影响。由于主要作物收穫面积的扩大,田间作物对基本养分的需求不断增加。
印尼肥料产业概况
印尼化肥市场较为分散,前五大企业占39.73%。市场的主要企业有:Asia Kimindo Prima、PT Saraswanti Anugerah Makmur Tbk (SAMF)、PT。 JADI MAS、Pupuk Indonesia (Persero) 和 Yara International ASA(按字母顺序排列)。
其他福利
- Excel 格式的市场预测 (ME) 表
- 3 个月的分析师支持
目录
第 1 章执行摘要和主要发现
第二章 报告要约
第 3 章 简介
- 研究假设和市场定义
- 研究范围
- 调查方法
第四章 产业主要趋势
- 主要作物种植面积
- 田间作物
- 园艺作物
- 平均养分施用量
- 微量营养素
- 田间作物
- 园艺作物
- 主要营养物质
- 田间作物
- 园艺作物
- 次要营养素
- 田间作物
- 园艺作物
- 微量营养素
- 灌溉农田
- 法律规范
- 价值链与通路分析
第五章 市场区隔
- 类型
- 复合型
- 直的
- 微量营养素
- 硼
- 铜
- 铁
- 锰
- 钼
- 锌
- 其他的
- 氮
- 尿素
- 其他的
- 磷酸
- DAP
- MAP
- TSP
- 其他的
- 钾
- MoP
- SoP
- 其他的
- 次要营养物质
- 钙
- 镁
- 硫
- 形式
- 传统的
- 特别的
- CRF
- 液体肥料
- SRF
- 水溶性
- 受精方式
- 受精
- 叶面喷布
- 土壤
- 作物类型
- 田间作物
- 园艺作物
- 草坪和观赏植物
第六章 竞争格局
- 主要策略趋势
- 市场占有率分析
- 业务状况
- 公司简介
- Asia Kimindo Prima
- Grupa Azoty SA(Compo Expert)
- Haifa Group
- PT Saraswanti Anugerah Makmur Tbk(SAMF)
- PT. JADI MAS
- Pupuk Indonesia(Persero)
- Yara International ASA
第七章:执行长的关键策略问题
第 8 章 附录
- 世界概况
- 概述
- 五力分析框架
- 全球价值链分析
- 市场动态(DRO)
- 资讯来源和进一步阅读
- 图片列表
- 关键见解
- 资料包
- 词彙表
The Indonesia Fertilizer Market size is estimated at 8.95 billion USD in 2025, and is expected to reach 12.15 billion USD by 2030, growing at a CAGR of 6.30% during the forecast period (2025-2030).
Field crops dominate the consumption of fertilizers in the country
- In 2022, field crops dominated the fertilizer market in Indonesia, representing 92.3% of the market's value, which amounted to USD 3.93 billion. Notably, rice is the primary field crop in the country, with Indonesia ranking as the world's third-largest rice producer, trailing only China and India. Key regions for rice cultivation in Indonesia include South Sumatra, West Java, Central Java, East Java, and South Sulawesi.
- Conventional fertilizers held the highest share in the field crop segment, accounting for 76.0% in 2022, while specialty fertilizers made up the remaining 24.0%. Within the specialty fertilizers category, the conventional segment is projected to record a CAGR of 6.1% between 2023 and 2030.
- Horticultural crops constituted 9.3% of Indonesia's fertilizer market in 2022. Given the importance of fruits and vegetables in a balanced diet, it is worth noting that in 2016, Indonesians consumed only 43% of the recommended intake. Furthermore, over the past five years, this consumption has declined, falling below half of the recommended levels. On average, Indonesians consumed 173 grams of fruits and vegetables per day, significantly lower than the recommended 400 grams, indicating potential for growth in this segment.
- In 2022, turf and ornamental crops made up less than 1.0% of Indonesia's fertilizer market, primarily due to their limited cultivation area, accounting for a mere 0.03% of the country's total crop area.
- The turf and ornamental fertilizer market in Indonesia is witnessing an upward trajectory, driven by rising demand, particularly from sports stadiums like football fields. This segment is projected to witness a CAGR of 6.2% between 2023 and 2030.
Indonesia Fertilizer Market Trends
Indonesia is aiming for the self-sufficiency driving the area under cultivation
- In Indonesia, field crops accounted for 89.9% of the total cultivated area in 2022. Rice, corn, cassava, soybeans, and peanuts are major field crops grown in Indonesia. In 2022, rice accounted for 56.7% of the total area under field crops. Rice is cultivated in both lowland and upland elevations throughout Indonesia, with the upland crop typically being rainfed and receiving only low levels of fertilizer applications. Rice cultivation is heavily concentrated in Java but is also prevalent in Sumatra and Sulawesi. These three islands together contribute about 89% of total national rice production. There are typically three rice growing periods or seasons in Indonesia, a single wet-season crop followed by two dry-season crops. Approximately 45% of total production is usually from the wet season crop, cultivated from October to December and harvested from March through April.
- Corn is the second largely cultivated crop in Indonesia after paddy, occupying about 10.8% of agricultural land. Corn is the staple foodstuff in Indonesia for more than 18 million people and is grown by more than 10 million farm households. Corn production was concentrated in various regions, including Jawa Tengah (16% of total corn production), Lampung (9% of total corn production), Sulawesi Selatan (8% of total corn production), and Sumatera Utara (7% of total corn production) in 2022.
- Despite being the world's largest rice producer, Indonesia imported approximately 500,000 tons of rice in 2022 from countries like Thailand, Vietnam, India, and Pakistan. In a bid to bolster self-sufficiency and curb imports, Indonesia's focus on enhancing productivity is set to propel its fertilizers market.
Among all the primary nutrients, nitrogen is applied in a higher quantity in field crops
- Nitrogen, phosphorus, and potassium are the primary nutrients crucial for plant growth. Nitrogen (N) and phosphorus (P) are key components of proteins and nucleic acids, integral to plant tissues. Meanwhile, potassium (K) plays a pivotal role in enhancing the quality of harvested plant products. In Indonesia, the prominent field crops are rice, wheat, soybean, and corn. On average, these crops receive nutrient application rates of 223.8 kg/ha for nitrogen, 57.3 kg/ha for phosphorus, and 88.0 kg/ha for potassium.
- Out of the primary nutrients, nitrogen sees the highest application rate, averaging 223.8 kg/ha for field crops. Nitrogenous fertilizers, when appropriately used, contribute to improved grain quality, accelerated shoot growth, and the production of robust flower buds. Early-stage nitrogen fertilization also stimulates tillering and boosts crop yields. Phosphorus, with an application rate of 57.3 kg/ha in 2022, ranks second among the primary nutrients. It plays a vital role in the development of cereal crops, aiding in early root growth, tiller formation, and grain filling.
- In 2022, field crops in Indonesia received an average potassium application rate of 88.0 kg/ha. Potassium deficiency symptoms are first visible on the lower leaves, as potassium is easily translocated from older to younger leaves within the plant. These symptoms manifest as yellowing, progressing to necrosis (tissue death) along the outer leaf margins, starting from the tip and moving toward the base. The absence of primary nutrients can significantly impact plant health, growth, and crop yield. Given the expanding harvested area for major food crops, the demand for primary nutrients in field crops is poised to rise.
Indonesia Fertilizer Industry Overview
The Indonesia Fertilizer Market is fragmented, with the top five companies occupying 39.73%. The major players in this market are Asia Kimindo Prima, PT Saraswanti Anugerah Makmur Tbk (SAMF), PT. JADI MAS, Pupuk Indonesia (Persero) and Yara International ASA (sorted alphabetically).
Additional Benefits:
- The market estimate (ME) sheet in Excel format
- 3 months of analyst support
TABLE OF CONTENTS
1 EXECUTIVE SUMMARY & KEY FINDINGS
2 REPORT OFFERS
3 INTRODUCTION
- 3.1 Study Assumptions & Market Definition
- 3.2 Scope of the Study
- 3.3 Research Methodology
4 KEY INDUSTRY TRENDS
- 4.1 Acreage Of Major Crop Types
- 4.1.1 Field Crops
- 4.1.2 Horticultural Crops
- 4.2 Average Nutrient Application Rates
- 4.2.1 Micronutrients
- 4.2.1.1 Field Crops
- 4.2.1.2 Horticultural Crops
- 4.2.2 Primary Nutrients
- 4.2.2.1 Field Crops
- 4.2.2.2 Horticultural Crops
- 4.2.3 Secondary Macronutrients
- 4.2.3.1 Field Crops
- 4.2.3.2 Horticultural Crops
- 4.2.1 Micronutrients
- 4.3 Agricultural Land Equipped For Irrigation
- 4.4 Regulatory Framework
- 4.5 Value Chain & Distribution Channel Analysis
5 MARKET SEGMENTATION (includes market size in Value in USD and Volume, Forecasts up to 2030 and analysis of growth prospects)
- 5.1 Type
- 5.1.1 Complex
- 5.1.2 Straight
- 5.1.2.1 Micronutrients
- 5.1.2.1.1 Boron
- 5.1.2.1.2 Copper
- 5.1.2.1.3 Iron
- 5.1.2.1.4 Manganese
- 5.1.2.1.5 Molybdenum
- 5.1.2.1.6 Zinc
- 5.1.2.1.7 Others
- 5.1.2.2 Nitrogenous
- 5.1.2.2.1 Urea
- 5.1.2.2.2 Others
- 5.1.2.3 Phosphatic
- 5.1.2.3.1 DAP
- 5.1.2.3.2 MAP
- 5.1.2.3.3 TSP
- 5.1.2.3.4 Others
- 5.1.2.4 Potassic
- 5.1.2.4.1 MoP
- 5.1.2.4.2 SoP
- 5.1.2.4.3 Others
- 5.1.2.5 Secondary Macronutrients
- 5.1.2.5.1 Calcium
- 5.1.2.5.2 Magnesium
- 5.1.2.5.3 Sulfur
- 5.2 Form
- 5.2.1 Conventional
- 5.2.2 Speciality
- 5.2.2.1 CRF
- 5.2.2.2 Liquid Fertilizer
- 5.2.2.3 SRF
- 5.2.2.4 Water Soluble
- 5.3 Application Mode
- 5.3.1 Fertigation
- 5.3.2 Foliar
- 5.3.3 Soil
- 5.4 Crop Type
- 5.4.1 Field Crops
- 5.4.2 Horticultural Crops
- 5.4.3 Turf & Ornamental
6 COMPETITIVE LANDSCAPE
- 6.1 Key Strategic Moves
- 6.2 Market Share Analysis
- 6.3 Company Landscape
- 6.4 Company Profiles
- 6.4.1 Asia Kimindo Prima
- 6.4.2 Grupa Azoty S.A. (Compo Expert)
- 6.4.3 Haifa Group
- 6.4.4 PT Saraswanti Anugerah Makmur Tbk (SAMF)
- 6.4.5 PT. JADI MAS
- 6.4.6 Pupuk Indonesia (Persero)
- 6.4.7 Yara International ASA
7 KEY STRATEGIC QUESTIONS FOR FERTILIZER CEOS
8 APPENDIX
- 8.1 Global Overview
- 8.1.1 Overview
- 8.1.2 Porter's Five Forces Framework
- 8.1.3 Global Value Chain Analysis
- 8.1.4 Market Dynamics (DROs)
- 8.2 Sources & References
- 8.3 List of Tables & Figures
- 8.4 Primary Insights
- 8.5 Data Pack
- 8.6 Glossary of Terms
 肥料市场机会、成长动力、产业趋势分析及2025-2034年预测
 全球永续海藻肥料市场:2032 年预测 - 按产品、原料、作物类型、萃取方法、应用和地区进行分析
 2025 年至 2033 年肥料市场规模、份额、趋势及预测(依产品类型、产品、产品形态、作物类型及地区划分)全球绿肥市场海藻基肥料市场机会、成长动力、产业趋势分析及 2025 - 2034 年预测
 2025年全球复合肥料市场报告2025年全球肥料市场报告2025年硼肥全球市场报告全球有机矿物肥料市场:2032 年预测 - 按类型、作物类型、形式、包装类型、分销管道、应用方法、最终用户和地区进行分析硅肥市场报告(依类型(合成、天然)、形态(液体、固体)、应用(农田作物、园艺作物、水耕、花栽培)及地区)2025-2033