


 |
市场调查报告书
商品编码
1801924
肥料市场机会、成长动力、产业趋势分析及2025-2034年预测Fertilizer Market Opportunity, Growth Drivers, Industry Trend Analysis, and Forecast 2025 - 2034 |
||||||
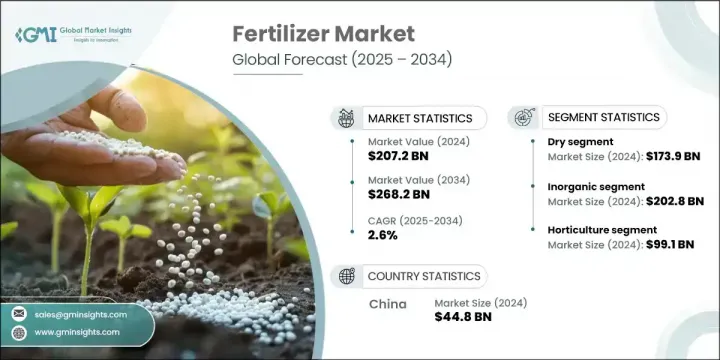
2024年,全球肥料市场规模达2,072亿美元,预计到2034年将以2.6%的复合年增长率成长,达到2,682亿美元。这一稳步增长反映了全球对更高农业产量的需求不断增长,这主要源于人口增长和肥沃土地供应的减少。随着人们更加重视永续农业和资源节约型实践,无论是私人部门还是公共政策都在加速现代肥料解决方案的采用。技术创新的加强,尤其是在营养高效肥料方面的创新,正在推动农业向精准化转型。
同时,生物基肥料的兴起和精准农业的日益普及,正在重塑传统的耕作方式,使其兼顾产量和环境影响。全球各国日益重视粮食生产能力,因而增加了稳定化肥供应的力道。政府支持的措施正在促进营养均衡施用,并鼓励使用更清洁、更环保的肥料,以维护土壤健康和粮食安全。随着各地区农业需求的持续攀升,生产规模化且有效率的供应链管理正变得越来越重要。
| 市场范围 | |
|---|---|
| 起始年份 | 2024 |
| 预测年份 | 2025-2034 |
| 起始值 | 2072亿美元 |
| 预测值 | 2682亿美元 |
| 复合年增长率 | 2.6% |
2024年,干肥市场价值达1,739亿美元,彰显其重要地位。干肥配方因其更长的保质期、便捷的物流以及更强的抗潮湿或微生物活动腐败能力,将继续占据主导地位。其稳定性使其成为冷链支援有限地区散装配送和储存的理想选择。此外,其轻质成分有助于降低运输成本,并且在需要时更易于施用或混合,这在许多地区赋予了其明显的营运优势。
园艺应用领域引领市场,2024 年估值达 991 亿美元。该领域使用各种先进肥料,包括富含微量营养素的混合肥料、缓释配方和叶面喷施,以支持水果、蔬菜和温室植物等高价值作物的生长。由于园艺作物对养分平衡的敏感性,精准施肥至关重要。包括水耕系统在内的受控环境农业进一步增加了专用肥料的使用,以保持植物的最佳生长,并在最小空间内实现产量最大化。
2024年,中国化肥市场规模达448亿美元,占全球43%的份额,这得益于高强度的耕作方式以及玉米、水稻和小麦等主粮作物需求的不断增长。持续的耕作方式导致土壤养分枯竭,需要定期施肥补充。该地区庞大的农业基础和对粮食安全的迫切需求使其成为化肥的主要消费国,其中,中国和印度凭藉其规模和人口动态,成为化肥需求的领头羊。
全球肥料市场的领先公司包括 Coromandel International Limited、EuroChem Group、Bunge Limited、K+S Group、Nutrien、Sinofert Holdings Limited、Uralkali、IFFCO、Israel Chemicals、Syngenta、Haifa Group、Yara International、The Mosaic Company、OCP Group、Westfarmers 和 CF Industries。在肥料市场运营的公司正在透过提供可持续和客製化的营养混合物(包括控释肥料和生物基肥料)来实现产品组合多样化,从而提升其市场地位。与农业科技公司的策略合作伙伴关係正在数位化整合,使製造商能够提供即时土壤分析和精准施用工具等增值服务。许多参与者正在扩大新兴市场的製造能力,以满足不断增长的当地需求并降低供应链风险。企业也正在投资研发,以开发符合生态法规的营养高效产品。此外,正在与政府和农业合作社签订长期合同,以确保稳定的采购量。
目录
第一章:方法论与范围
第二章:执行摘要
第三章:行业洞察
- 产业生态系统分析
- 供应商格局
- 利润率
- 每个阶段的增值
- 影响价值链的因素
- 中断
- 产业衝击力
- 成长动力
- 食品需求不断成长
- 有机肥料需求不断成长
- 水溶肥料需求不断成长
- 产业陷阱与挑战
- 缺乏对肥料最佳使用方法的认识
- 不确定性增加,政策重点转向环境
- 市场机会
- 精准农业和智慧农业技术的采用日益增多
- 有机和生物肥料的需求不断增加
- 政府对永续农业实践的补贴和支持
- 成长动力
- 成长潜力分析
- 监管格局
- 北美洲
- 欧洲
- 亚太地区
- 拉丁美洲
- 中东和非洲
- 波特的分析
- PESTEL分析
- 价格趋势
- 按地区
- 按产品
- 未来市场趋势
- 技术和创新格局
- 当前的技术趋势
- 新兴技术
- 专利态势
- 贸易统计(HS编码)(註:仅提供重点国家的贸易统计资料)
- 主要进口国
- 主要出口国
- 永续性和环境方面
- 永续实践
- 减少废弃物的策略
- 生产中的能源效率
- 环保倡议
- 碳足迹考量
第四章:竞争格局
- 介绍
- 公司市占率分析
- 按地区
- 北美洲
- 欧洲
- 亚太地区
- 拉丁美洲
- MEA
- 按地区
- 公司矩阵分析
- 主要市场参与者的竞争分析
- 竞争定位矩阵
- 关键进展
- 併购
- 伙伴关係与合作
- 新产品发布
- 扩张计划
第五章:市场估计与预测:依形式,2021 - 2034 年
- 主要趋势
- 干燥
- 液体
第六章:市场估计与预测:按产品,2021 - 2034 年
- 主要趋势
- 有机的
- 植物基
- 动物性
- 矿物质基
- 无机
- 氮
- 尿素
- 无水氨
- 能
- UAN解决方案
- 硫酸铵
- 磷
- 磷酸二铵
- 磷酸一铵
- 重过磷酸钙
- 普通过磷酸钙
- 聚磷酸铵
- 其他的
- 钾
- 氯化钾
- 硫酸钾
- 硝酸钾
- 氮
第七章:市场估计与预测:按应用,2021 - 2034 年
- 主要趋势
- 农业
- 园艺
- 园艺
- 其他的
第八章:市场估计与预测:按地区,2021 - 2034 年
- 主要趋势
- 北美洲
- 我们
- 加拿大
- 欧洲
- 德国
- 英国
- 法国
- 西班牙
- 义大利
- 欧洲其他地区
- 亚太地区
- 中国
- 印度
- 日本
- 澳洲
- 韩国
- 亚太其他地区
- 拉丁美洲
- 巴西
- 墨西哥
- 阿根廷
- 拉丁美洲其他地区
- 中东和非洲
- 沙乌地阿拉伯
- 南非
- 阿联酋
- 中东和非洲其他地区
第九章:公司简介
- Bunge Limited
- CF Industries Holdings
- Coromandel International Limited
- EuroChem Group
- Haifa Group
- IFFCO
- Israel Chemicals
- K+S Group
- Nutrien
- OCP Group
- Sinofert Holdings Limited
- Syngenta
- The Mosaic Company
- Uralkali
- Wesfarmers
- Yara International
The Global Fertilizer Market was valued at USD 207.2 billion in 2024 and is estimated to grow at a CAGR of 2.6% to reach USD 268.2 billion by 2034. This steady growth reflects the rising global need for higher agricultural output, largely driven by population growth and shrinking availability of fertile land. With more emphasis being placed on sustainable farming and resource-efficient practices, both private initiatives and public policies are accelerating the adoption of modern fertilizer solutions. Enhanced technological innovation, particularly in nutrient-efficient blends, is supporting the shift toward more precise farming.
At the same time, the emergence of bio-based fertilizers and the growing implementation of precision agriculture are reshaping traditional farming methods by prioritizing both yield and environmental impact. Globally, nations are increasing their focus on food production capacity, leading to a stronger push to stabilize fertilizer supplies. Government-backed initiatives are promoting the balanced application of nutrients and encouraging the adoption of cleaner, eco-conscious fertilizers to maintain soil health and food security. Production scaling and efficient supply chain management are becoming more central as agricultural demand continues to climb across regions.
| Market Scope | |
|---|---|
| Start Year | 2024 |
| Forecast Year | 2025-2034 |
| Start Value | $207.2 Billion |
| Forecast Value | $268.2 Billion |
| CAGR | 2.6% |
In 2024, the dry fertilizer segment accounted for USD 173.9 billion in market value, underscoring its significant presence. Dry formulations continue to dominate due to their extended shelf life, logistical convenience, and greater resistance to spoilage from moisture or microbial activity. Their stability makes them an ideal option for bulk distribution and storage in areas with limited cold chain support. Additionally, their lightweight composition contributes to lower transportation costs, and they are easier to apply or mix when needed, giving them a clear operational advantage in many regions.
The horticulture application segment led the market with a valuation of USD 99.1 billion in 2024. This sector uses a wide range of advanced fertilizers, including micronutrient-rich blends, slow-release formulations, and foliar sprays, to support high-value crops such as fruits, vegetables, and greenhouse plants. Due to the sensitivity of horticultural crops to nutrient balance, precision in application is essential. Controlled-environment agriculture, including hydroponic systems, has further increased the use of specialized fertilizers to maintain optimal plant growth and maximize output in minimal space.
China Fertilizer Market generated USD 44.8 billion holding 43% share in 2024 driven by high-intensity farming practices and a growing demand for staple crops like corn, rice, and wheat. Continuous cultivation practices have resulted in soil nutrient depletion, necessitating regular replenishment through fertilizer use. The region's large agricultural base and the urgency for food security make it a primary consumer of fertilizers, with China and India leading demand due to their scale and population dynamics.
Leading companies in the Global Fertilizer Market include Coromandel International Limited, EuroChem Group, Bunge Limited, K+S Group, Nutrien, Sinofert Holdings Limited, Uralkali, IFFCO, Israel Chemicals, Syngenta, Haifa Group, Yara International, The Mosaic Company, OCP Group, Westfarmers, and CF Industries Holdings. Companies operating in the fertilizer market are enhancing their market position by diversifying product portfolios with sustainable and customized nutrient blends, including controlled-release and bio-based fertilizers. Strategic partnerships with agri-tech firms are enabling digital integration, allowing manufacturers to offer value-added services like real-time soil analysis and precision application tools. Many players are expanding manufacturing capacity in emerging markets to meet rising local demand and reduce supply chain risks. Firms are also investing in R&D to develop nutrient-efficient products aligned with eco-regulations. Additionally, long-term contracts with governments and agricultural cooperatives are being pursued to ensure steady offtake.
Table of Contents
Chapter 1 Methodology & Scope
- 1.1 Market scope and definition
- 1.2 Research design
- 1.2.1 Research approach
- 1.2.2 Data collection methods
- 1.3 Data mining sources
- 1.3.1 Global
- 1.3.2 Regional/Country
- 1.4 Base estimates and calculations
- 1.4.1 Base year calculation
- 1.4.2 Key trends for market estimation
- 1.5 Primary research and validation
- 1.5.1 Primary sources
- 1.6 Forecast model
- 1.7 Research assumptions and limitations
Chapter 2 Executive Summary
- 2.1 Industry 3600 synopsis
- 2.2 Key market trends
- 2.2.1 Regional
- 2.2.2 Form
- 2.2.3 Product
- 2.2.4 Application
- 2.3 TAM Analysis, 2025-2034
- 2.4 CXO perspectives: Strategic imperatives
- 2.4.1 Executive decision points
- 2.4.2 Critical success factors
- 2.5 Future outlook and strategic recommendations
Chapter 3 Industry Insights
- 3.1 Industry ecosystem analysis
- 3.1.1 Supplier landscape
- 3.1.2 Profit margin
- 3.1.3 Value addition at each stage
- 3.1.4 Factor affecting the value chain
- 3.1.5 Disruptions
- 3.2 Industry impact forces
- 3.2.1 Growth drivers
- 3.2.1.1 Rising demand for food
- 3.2.1.2 Growing demand for organic fertilizers
- 3.2.1.3 Emerging demand for water soluble fertilizers
- 3.2.2 Industry pitfalls and challenges
- 3.2.2.1 Lack of awareness about the optimum usage of fertilizers
- 3.2.2.2 Increasing uncertainties and significant policy focus towards the environment
- 3.2.3 Market opportunities
- 3.2.3.1 Rising adoption of precision agriculture and smart farming technologies
- 3.2.3.2 Increasing demand for organic and bio-based fertilizers
- 3.2.3.3 Government subsidies and support for sustainable agricultural practices
- 3.2.1 Growth drivers
- 3.3 Growth potential analysis
- 3.4 Regulatory landscape
- 3.4.1 North America
- 3.4.2 Europe
- 3.4.3 Asia Pacific
- 3.4.4 Latin America
- 3.4.5 Middle East & Africa
- 3.5 Porter's analysis
- 3.6 PESTEL analysis
- 3.6.1 Technology and innovation landscape
- 3.6.2 Current technological trends
- 3.6.3 Emerging technologies
- 3.7 Price trends
- 3.7.1 By region
- 3.7.2 By product
- 3.8 Future market trends
- 3.9 Technology and innovation landscape
- 3.9.1 Current technological trends
- 3.9.2 Emerging technologies
- 3.10 Patent Landscape
- 3.11 Trade statistics (HS code) (Note: the trade statistics will be provided for key countries only)
- 3.11.1 Major importing countries
- 3.11.2 Major exporting countries
- 3.12 Sustainability and environmental aspects
- 3.12.1 Sustainable practices
- 3.12.2 Waste reduction strategies
- 3.12.3 Energy efficiency in production
- 3.12.4 Eco-friendly initiatives
- 3.13 Carbon footprint considerations
Chapter 4 Competitive Landscape, 2024
- 4.1 Introduction
- 4.2 Company market share analysis
- 4.2.1 By region
- 4.2.1.1 North America
- 4.2.1.2 Europe
- 4.2.1.3 Asia Pacific
- 4.2.1.4 LATAM
- 4.2.1.5 MEA
- 4.2.1 By region
- 4.3 Company matrix analysis
- 4.4 Competitive analysis of major market players
- 4.5 Competitive positioning matrix
- 4.6 Key developments
- 4.6.1 Mergers & acquisitions
- 4.6.2 Partnerships & collaborations
- 4.6.3 New product launches
- 4.6.4 Expansion plans
Chapter 5 Market Estimates and Forecast, By Form, 2021 - 2034 (USD Billion) (Kilo Tons)
- 5.1 Key trends
- 5.2 Dry
- 5.3 Liquid
Chapter 6 Market Estimates and Forecast, By Product, 2021 - 2034 (USD Billion) (Kilo Tons)
- 6.1 Key trends
- 6.2 Organic
- 6.2.1 Plant based
- 6.2.2 Animal based
- 6.2.3 Mineral based
- 6.3 Inorganic
- 6.3.1 Nitrogen
- 6.3.1.1 Urea
- 6.3.1.2 Anhydrous ammonia
- 6.3.1.3 CAN
- 6.3.1.4 UAN solution
- 6.3.1.5 Ammonium sulfate
- 6.3.2 Phosphorus
- 6.3.2.1 Diammonium phosphate
- 6.3.2.2 Monoammonium phosphate
- 6.3.2.3 Triple superphosphate
- 6.3.2.4 Ordinary superphosphate
- 6.3.2.5 Ammonium polyphosphate
- 6.3.2.6 Others
- 6.3.3 Potassium
- 6.3.3.1 Potassium chloride
- 6.3.3.2 Potassium sulfate
- 6.3.3.3 Potassium nitrate
- 6.3.1 Nitrogen
Chapter 7 Market Estimates and Forecast, By Application, 2021 - 2034 (USD Billion) (Kilo Tons)
- 7.1 Key trends
- 7.2 Agriculture
- 7.3 Horticulture
- 7.4 Gardening
- 7.5 Others
Chapter 8 Market Estimates and Forecast, By Region, 2021 - 2034 (USD Billion) (Kilo Tons)
- 8.1 Key trends
- 8.2 North America
- 8.2.1 U.S.
- 8.2.2 Canada
- 8.3 Europe
- 8.3.1 Germany
- 8.3.2 UK
- 8.3.3 France
- 8.3.4 Spain
- 8.3.5 Italy
- 8.3.6 Rest of Europe
- 8.4 Asia Pacific
- 8.4.1 China
- 8.4.2 India
- 8.4.3 Japan
- 8.4.4 Australia
- 8.4.5 South Korea
- 8.4.6 Rest of Asia Pacific
- 8.5 Latin America
- 8.5.1 Brazil
- 8.5.2 Mexico
- 8.5.3 Argentina
- 8.5.4 Rest of Latin America
- 8.6 Middle East and Africa
- 8.6.1 Saudi Arabia
- 8.6.2 South Africa
- 8.6.3 UAE
- 8.6.4 Rest of Middle East and Africa
Chapter 9 Company Profiles
- 9.1 Bunge Limited
- 9.2 CF Industries Holdings
- 9.3 Coromandel International Limited
- 9.4 EuroChem Group
- 9.5 Haifa Group
- 9.6 IFFCO
- 9.7 Israel Chemicals
- 9.8 K+S Group
- 9.9 Nutrien
- 9.10 OCP Group
- 9.11 Sinofert Holdings Limited
- 9.12 Syngenta
- 9.13 The Mosaic Company
- 9.14 Uralkali
- 9.15 Wesfarmers
- 9.16 Yara International
 全球粪肥市场-产业规模、份额、趋势、机会及预测,依类型、形态、应用、区域及竞争格局划分,2020-2030年预测昆虫肥料市场-全球产业规模、份额、趋势、机会和预测,按类型、形态、应用、地区和竞争格局划分,2020-2030年预测海藻肥料市场-全球产业规模、份额、趋势、机会和预测,按形态(液体和粉末)、应用(农场、花园及其他)、地区和竞争格局划分,2020-2030年预测聚合物包膜肥料市场-全球产业规模、份额、趋势、机会和预测,按类型、作物类型、地区和竞争格局划分,2020-2030年预测
 硅肥市场:预测(2025-2030 年)
 胶囊肥料市场依营养成分、释放机制、作物用途及地区划分
 复合肥市场按产品类型、物理形态、应用和作物类型划分-2025-2032年全球预测按产品类型、作物类型、营养类型、应用和分销管道分類的起始肥料市场—2025-2032年全球预测2032年化肥市场预测:按肥料类型、作物类型、形态、分销管道、应用和地区分類的全球分析按类型、用途、形式和地区分類的肥料市场