


 |
市场调查报告书
商品编码
1685834
亚太工程塑胶:市场占有率分析、产业趋势与统计、成长预测(2024-2029 年)Asia-pacific Engineering Plastics - Market Share Analysis, Industry Trends & Statistics, Growth Forecasts (2024 - 2029) |
||||||
价格
※ 本网页内容可能与最新版本有所差异。详细情况请与我们联繫。
简介目录
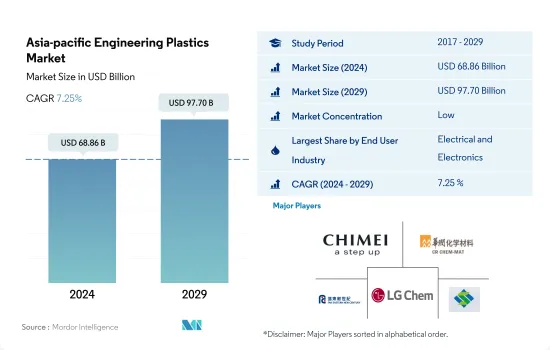
亚太工程塑胶市场规模预计在 2024 年为 688.6 亿美元,预计到 2029 年将达到 977 亿美元,预测期内(2024-2029 年)的复合年增长率为 7.25%。
包装业的销售份额被电气和电子行业夺走
- 工程塑胶用途广泛,广泛应用于从航太内墙板和门到刚性和柔性包装等各种领域。亚太工程塑胶市场主要受包装、电气电子和汽车产业推动。到 2022 年,包装将占整个工程塑胶市场的约 43.80%,而电气和电子将占 31.32%。
- 2020年,受全球供应链中断影响,各产业消费收益较去年与前一年同期比较下降6.02%。然而,2021年市场有所復苏,2022年持续稳定成长,成长率达7.18%。
- 从产量份额来看,包装产业是该地区最大的终端用户产业。然而,收益资料显示,由于 PET 在其他工程塑胶中价格相对较低,且广泛用于包装应用,因此电气和电子行业在该地区占据了最大的份额。都市化和家庭结构的重大变化正在增加对功能性、包装性和方便食品的需求。例如,亚太地区塑胶包装产量2022年将达6,800万吨,占全球整体的51%。
- 电气和电子产业是最有前景的市场,预测期内(2023-2029 年)的收益和预计复合年增长率为 8.21%。受智慧电子设备、电动车、自动机器人和先进国防技术需求不断增长的推动,该地区的电子元件生产收入预计到 2029 年将达到 6.74 兆美元。
中国和日本仍是最大的需求国
- 2022 年,亚太地区将占全球工程塑胶消费量的 56.7%。工程塑胶具有高度多功能的特性,可应用于汽车、包装、电气和电子等各行业。
- 由于采用电气电子、包装和汽车等行业的不断发展,中国是该地区最大的工程塑胶消费国。 2022年中国电子电气产业占全部区域收益占有率为29.26%。 2022年中国电气及电子元件生产收益将达29.2亿美元。
- 日本是该地区第二大工程塑胶消费国。由于建筑业和电气电子行业的快速发展,该国在 2022 年的销售份额达到 8.29%。 2022年,日本建设产业新占地面积成长率为2021年7.47%,2022年4.11%。由于电气和电子零件产量增加,预计未来该国对工程塑胶的需求将会增加。
- 由于汽车、电子等行业的快速成长,预计中国将成为亚太地区工程塑胶市场成长最快的国家,预测期内以金额为准为 7.50%。自2022年起,中国将取消乘用车製造业外商投资限制,允许中国政府与汽车工程公司以最高50:50的比例组成合资企业。这项变更将透过增加投资为中国汽车产业创造成长机会。
亚太工程塑胶市场趋势
东南亚国协快速发展带动电子产品生产
- 在亚太地区,2020年至2021年电气和电子设备生产收入成长了13.9%。电子业占大多数亚洲国家出口总额的20-50%。大多数的消费性电子产品,例如电视、收音机、电脑和行动电话,都是在东协地区生产。
- 东协是硬碟生产的领先者,超过80%的硬碟都在该地区生产。整体而言,东协电气电子产业比其他产业更依赖外国投入和技术,53%的电气电子出口来自东协电气电子出口中的外国增加价值或外国投入。
- 泰国和马来西亚等国家引领该地区的电子产品生产。泰国拥有东南亚最大的电子组装基地之一,在硬碟、积体电路和半导体生产领域居领先地位。它是全球第二大空调製造商和全球第四大冰箱製造商。
- 电子产业极大地受益于东协的一体化生产网络,这有助于改善与中国和日本等亚洲经济强国的贸易。
- 中国占全球电器出口的11.2%,2019年至2020年数位产品出口成长5.8%。亚洲开发银行称,中国为该地区的电子产品提供了庞大的市场。泰国、日本、中国、马来西亚、印度和菲律宾等国家继续在该地区引领电子产品生产。
亚太工程塑胶产业概况
亚太工程塑胶市场较为分散,前五大公司占了22.59%的市场。该市场的主要企业为:奇美电子、华润(集团)、远东新世纪股份有限公司、LG化学和三丰集团(按字母顺序排列)。
其他福利
- Excel 格式的市场预测 (ME) 表
- 3 个月的分析师支持
目录
第 1 章执行摘要和主要发现
第二章 报告要约
第 3 章 简介
- 研究假设和市场定义
- 研究范围
- 调查方法
第四章 产业主要趋势
- 最终用户趋势
- 航太
- 车
- 建筑和施工
- 电气和电子
- 包装
- 进出口趋势
- 氟树脂交易
- 聚酰胺(PA)贸易
- 聚碳酸酯(PC)贸易
- 聚对苯二甲酸乙二酯(PET)贸易
- 聚甲基丙烯酸甲酯(PMMA)贸易
- 聚甲醛(POM)贸易
- 苯乙烯共聚物(ABS 和 SAN)贸易
- 价格趋势
- 回收概述
- 聚酰胺 (PA) 回收趋势
- 聚碳酸酯 (PC) 回收趋势
- 聚对苯二甲酸乙二醇酯 (PET) 的回收趋势
- 苯乙烯共聚物(ABS、SAN)的回收趋势
- 法律规范
- 澳洲
- 中国
- 印度
- 日本
- 马来西亚
- 韩国
- 价值链与通路分析
第五章 市场区隔
- 最终用户产业
- 航太
- 车
- 建筑和施工
- 电气和电子
- 工业/机械
- 包装
- 其他最终用户产业
- 树脂类型
- 氟树脂
- 依亚型
- 乙烯-四氟乙烯(ETFE)
- 氟化乙丙烯 (FEP)
- 聚四氟乙烯(PTFE)
- 聚氟乙烯 (PVF)
- 聚二氟亚乙烯(PVDF)
- 其他子树脂类型
- 液晶聚合物(LCP)
- 聚酰胺(PA)
- 副树脂类型
- 芳香聚酰胺
- 聚酰胺(PA)6
- 聚酰胺(PA)66
- 聚邻苯二甲酰胺
- 聚丁烯对苯二甲酸酯(PBT)
- 聚碳酸酯(PC)
- 聚醚醚酮 (PEEK)
- 聚对苯二甲酸乙二醇酯(PET)
- 聚酰亚胺(PI)
- 聚甲基丙烯酸甲酯 (PMMA)
- 聚甲醛(POM)
- 苯乙烯共聚物(ABS 和 SAN)
- 氟树脂
- 国家
- 澳洲
- 中国
- 印度
- 日本
- 马来西亚
- 韩国
- 其他亚太地区
第六章 竞争格局
- 主要策略趋势
- 市场占有率分析
- 业务状况
- 公司简介.
- Asahi Kasei Corporation
- CHIMEI
- China Petroleum & Chemical Corporation
- China Resources(Holdings)Co.,Ltd.
- Covestro AG
- Far Eastern New Century Corporation
- Formosa Plastics Group
- LG Chem
- Lotte Chemical
- Mitsubishi Chemical Corporation
- Sanfame Group
- Sinochem
- Solvay
- Sumitomo Chemical Co., Ltd.
- Toray Industries, Inc.
第七章:执行长的关键策略问题
第 8 章 附录
- 世界概况
- 概述
- 五力分析框架(产业吸引力分析)
- 全球价值链分析
- 市场动态(DRO)
- 资讯来源和进一步阅读
- 图片列表
- 关键见解
- 资料包
- 词彙表
简介目录
Product Code: 48295
The Asia-pacific Engineering Plastics Market size is estimated at 68.86 billion USD in 2024, and is expected to reach 97.70 billion USD by 2029, growing at a CAGR of 7.25% during the forecast period (2024-2029).
Packaging industry to lose its volume share to electrical and electronics industry
- Engineering plastics are versatile, finding applications in everything from interior wall panels and doors in aerospace to rigid and flexible packaging. The Asia-Pacific engineering plastics market is primarily driven by the packaging, electrical and electronics, and automotive industries. In 2022, packaging and electrical and electronics accounted for approximately 43.80% and 31.32% of the total engineering plastics market volume, respectively.
- In 2020, the combined consumption revenue across all industries fell by 6.02% compared to the previous year due to disruptions in the global supply chain. However, the market recovered in 2021 and continued to grow steadily, increasing by 7.18% in 2022.
- The packaging industry is the largest end-user industry in the region in terms of volume share. However, according to revenue data, the electrical and electronics industry holds the largest share in the region due to the relatively low price of PET, among other engineering plastics, which are widely used in packaging applications. Significant changes in urbanization and family demographics have increased the demand for functional, prepackaged, and convenient food products. For instance, Asia-Pacific plastic packaging production reached a volume of 68 million tons in 2022, accounting for 51% of the global total.
- The electrical and electronic industry is the most promising market, with an expected CAGR of 8.21% by revenue during the forecast period (2023-2029). Electronics component production revenue in the region is projected to reach USD 6.74 trillion by 2029, driven by the increasing demand for smart electronic devices, the growing demand for electric vehicles, autonomous robots, and advanced defense technologies.
China and Japan to remain as largest demand generators
- Asia-Pacific accounted for 56.7% by volume of the consumption of engineering plastics globally in 2022. Engineering plastics exhibit versatile properties due to which they find applications in various industries, such as automotive, packaging, and electrical and electronics.
- China is the largest consumer of engineering plastics in the region owing to its growing electrical and electronics, packaging, automotive, and other industries. In 2022, the Chinese electrical and electronics industry held a revenue share of 29.26% compared to the overall Asia-Pacific region. In China, the revenue from electrical and electronic component production accounted for USD 2.92 billion in 2022.
- Japan is the second-largest consumer of engineering plastics in the region. The country registered a revenue share of 8.29% in 2022 due to its rapidly growing construction and electrical and electronics industries. In 2022, the new construction floor area of the Japanese building and construction industry increased at a rate of 7.47% and 4.11% in 2021 and 2022 by revenue, respectively. The rising electrical and electronics component production is projected to drive the demand for engineering plastics in the country in the future.
- China is expected to witness the fastest growth in the Asia-Pacific engineering plastics market, with a CAGR of 7.50% in terms of value during the forecast period, owing to the rapid growth of industries like automotive and electronics. From 2022 onward, China lifted the restrictions on foreign investment in passenger car manufacturing, allowing for maximum investment in joint ventures between the Chinese government and automotive engineering companies to reach a 50:50 ratio. This change presents an opportunity for growth in the Chinese automotive industry through increased investment.
Asia-pacific Engineering Plastics Market Trends
Rapid growth in ASEAN countries to foster electronics production
- The Asia-Pacific region saw an increase in electrical and electronics production revenue by 13.9% from 2020 to 2021. The electronics sector accounts for 20-50% of the total value of most Asian countries' exports. Consumer electronics such as televisions, radios, computers, and cellular phones are largely manufactured in the ASEAN region.
- ASEAN leads the production of hard drives, with over 80% of hard drives being manufactured in the region. Overall, the electrical and electronics (E&E) industry in ASEAN relies more on foreign inputs and technology than other industries, with 53% of E&E exports arising from foreign value added (FVA) or foreign inputs integrated into ASEAN's E&E exports.
- Countries like Thailand and Malaysia lead in the production of electronics in the region. Thailand, home to one of the largest electronics assembly bases in Southeast Asia, leads in the production of hard drives, integrated circuits, and semiconductors. It ranks second in manufacturing air conditioning units and fourth in the global refrigerators market.
- The electronics industry has greatly benefitted from ASEAN's integrated production networks, which foster improved trade with larger Asian economies like China and Japan.
- China held an 11.2% share of global exports in electrical products and registered a growth of 5.8% in the export of digital products from 2019 to 2020. According to the Asian Development Bank, China provides a large market for electronics in the region. Countries such as Thailand, Japan, China, Malaysia, India, and the Philippines continue to lead the region in the production of electronics.
APAC Engineering Plastics Industry Overview
The Asia-pacific Engineering Plastics Market is fragmented, with the top five companies occupying 22.59%. The major players in this market are CHIMEI, China Resources (Holdings) Co.,Ltd., Far Eastern New Century Corporation, LG Chem and Sanfame Group (sorted alphabetically).
Additional Benefits:
- The market estimate (ME) sheet in Excel format
- 3 months of analyst support
TABLE OF CONTENTS
1 EXECUTIVE SUMMARY & KEY FINDINGS
2 REPORT OFFERS
3 INTRODUCTION
- 3.1 Study Assumptions & Market Definition
- 3.2 Scope of the Study
- 3.3 Research Methodology
4 KEY INDUSTRY TRENDS
- 4.1 End User Trends
- 4.1.1 Aerospace
- 4.1.2 Automotive
- 4.1.3 Building and Construction
- 4.1.4 Electrical and Electronics
- 4.1.5 Packaging
- 4.2 Import And Export Trends
- 4.2.1 Fluoropolymer Trade
- 4.2.2 Polyamide (PA) Trade
- 4.2.3 Polycarbonate (PC) Trade
- 4.2.4 Polyethylene Terephthalate (PET) Trade
- 4.2.5 Polymethyl Methacrylate (PMMA) Trade
- 4.2.6 Polyoxymethylene (POM) Trade
- 4.2.7 Styrene Copolymers (ABS and SAN) Trade
- 4.3 Price Trends
- 4.4 Recycling Overview
- 4.4.1 Polyamide (PA) Recycling Trends
- 4.4.2 Polycarbonate (PC) Recycling Trends
- 4.4.3 Polyethylene Terephthalate (PET) Recycling Trends
- 4.4.4 Styrene Copolymers (ABS and SAN) Recycling Trends
- 4.5 Regulatory Framework
- 4.5.1 Australia
- 4.5.2 China
- 4.5.3 India
- 4.5.4 Japan
- 4.5.5 Malaysia
- 4.5.6 South Korea
- 4.6 Value Chain & Distribution Channel Analysis
5 MARKET SEGMENTATION (includes market size in Value in USD and Volume, Forecasts up to 2029 and analysis of growth prospects)
- 5.1 End User Industry
- 5.1.1 Aerospace
- 5.1.2 Automotive
- 5.1.3 Building and Construction
- 5.1.4 Electrical and Electronics
- 5.1.5 Industrial and Machinery
- 5.1.6 Packaging
- 5.1.7 Other End-user Industries
- 5.2 Resin Type
- 5.2.1 Fluoropolymer
- 5.2.1.1 By Sub Resin Type
- 5.2.1.1.1 Ethylenetetrafluoroethylene (ETFE)
- 5.2.1.1.2 Fluorinated Ethylene-propylene (FEP)
- 5.2.1.1.3 Polytetrafluoroethylene (PTFE)
- 5.2.1.1.4 Polyvinylfluoride (PVF)
- 5.2.1.1.5 Polyvinylidene Fluoride (PVDF)
- 5.2.1.1.6 Other Sub Resin Types
- 5.2.2 Liquid Crystal Polymer (LCP)
- 5.2.3 Polyamide (PA)
- 5.2.3.1 By Sub Resin Type
- 5.2.3.1.1 Aramid
- 5.2.3.1.2 Polyamide (PA) 6
- 5.2.3.1.3 Polyamide (PA) 66
- 5.2.3.1.4 Polyphthalamide
- 5.2.4 Polybutylene Terephthalate (PBT)
- 5.2.5 Polycarbonate (PC)
- 5.2.6 Polyether Ether Ketone (PEEK)
- 5.2.7 Polyethylene Terephthalate (PET)
- 5.2.8 Polyimide (PI)
- 5.2.9 Polymethyl Methacrylate (PMMA)
- 5.2.10 Polyoxymethylene (POM)
- 5.2.11 Styrene Copolymers (ABS and SAN)
- 5.2.1 Fluoropolymer
- 5.3 Country
- 5.3.1 Australia
- 5.3.2 China
- 5.3.3 India
- 5.3.4 Japan
- 5.3.5 Malaysia
- 5.3.6 South Korea
- 5.3.7 Rest of Asia-Pacific
6 COMPETITIVE LANDSCAPE
- 6.1 Key Strategic Moves
- 6.2 Market Share Analysis
- 6.3 Company Landscape
- 6.4 Company Profiles (includes Global Level Overview, Market Level Overview, Core Business Segments, Financials, Headcount, Key Information, Market Rank, Market Share, Products and Services, and Analysis of Recent Developments).
- 6.4.1 Asahi Kasei Corporation
- 6.4.2 CHIMEI
- 6.4.3 China Petroleum & Chemical Corporation
- 6.4.4 China Resources (Holdings) Co.,Ltd.
- 6.4.5 Covestro AG
- 6.4.6 Far Eastern New Century Corporation
- 6.4.7 Formosa Plastics Group
- 6.4.8 LG Chem
- 6.4.9 Lotte Chemical
- 6.4.10 Mitsubishi Chemical Corporation
- 6.4.11 Sanfame Group
- 6.4.12 Sinochem
- 6.4.13 Solvay
- 6.4.14 Sumitomo Chemical Co., Ltd.
- 6.4.15 Toray Industries, Inc.
7 KEY STRATEGIC QUESTIONS FOR ENGINEERING PLASTICS CEOS
8 APPENDIX
- 8.1 Global Overview
- 8.1.1 Overview
- 8.1.2 Porter's Five Forces Framework (Industry Attractiveness Analysis)
- 8.1.3 Global Value Chain Analysis
- 8.1.4 Market Dynamics (DROs)
- 8.2 Sources & References
- 8.3 List of Tables & Figures
- 8.4 Primary Insights
- 8.5 Data Pack
- 8.6 Glossary of Terms
02-2729-4219
+886-2-2729-4219
 工程塑胶:市场占有率分析、产业趋势与统计、成长预测(2026-2031)
 2026年全球工程塑胶市场报告
 5G专用工程塑胶:按树脂类型、製程、应用和最终用途产业分類的全球预测,2026-2032年PA66工程塑胶市场依製造流程、产品类型、等级及最终用途产业划分-2026-2032年全球预测
 先进工程聚合物市场预测至2032年:按聚合物类型、形态、性能、技术、最终用户和地区分類的全球分析
 日本工程塑胶市场报告(按树脂类型、最终用途产业和地区划分,2026-2034年)
 工程塑胶市场规模、份额和成长分析(按树脂类型、最终用途和地区划分)-2026-2033年产业预测
 改质塑胶市场规模、占有率、预测及趋势分析:依产品类型、改质类型和应用划分 - 全球预测至 2035 年
 工程塑胶市场规模、占有率、成长及全球产业分析:依类型、应用和地区划分的洞察与预测(2024-2032 年)
 PEEK特种工程塑胶:全球市场占有率及排名、总收入及需求预测(2025-2031年)
▼