


 |
市场调查报告书
商品编码
1685843
北美工程塑胶:市场占有率分析、行业趋势和统计、成长预测(2024-2029 年)North America Engineering Plastics - Market Share Analysis, Industry Trends & Statistics, Growth Forecasts (2024 - 2029) |
||||||
※ 本网页内容可能与最新版本有所差异。详细情况请与我们联繫。
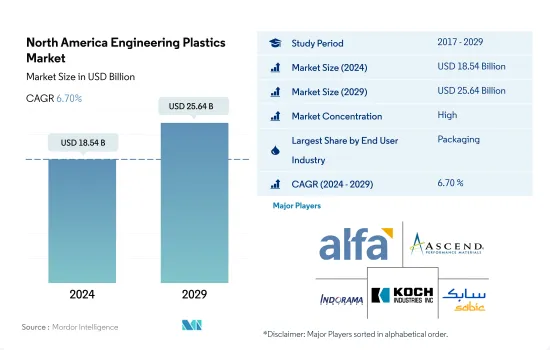
北美工程塑胶市场规模预计在 2024 年将达到 185.4 亿美元,预计到 2029 年将达到 256.4 亿美元,预测期内(2024-2029 年)的复合年增长率为 6.70%。
包装业的销售份额被电气和电子行业夺走
- 工程塑胶的应用范围包括航太内墙板和门以及硬质和软质包装。北美工程塑胶市场受到包装、电气电子和汽车等行业的推动。 2022年工程塑胶市场销售额中包装占比约31.35%,电子电气占比约17.43%。
- 由于家庭规模变小、都市化以及全球家庭人口结构发生重大变化,包装已成为该地区最大的终端用户产业。这些因素推动了对功能性、预先预包装和方便食品的需求。 2022年北美塑胶包装产量为2,240万吨,占全球整体的16.6%。由于消费者对包装食品和饮料的需求不断增加,该地区对工程塑胶的需求也在增加。
- 电气和电子行业是该地区第二大行业,尤其是在美国。该产业占国内生产毛额的1.6%。该地区累计2022年的销售额将达到5,761亿美元,这将推动对电气和电子设备的需求不断增长,并支持电动车、自动机器人和秘密防御技术的出现,从而推动对工程塑胶的需求。
- 电气和电子产业是该地区成长最快的产业,预测期内(2023-2029 年)预计收益和复合年增长率将达到 8.54%,这归因于各种电气和电子应用对塑胶复合材料的需求导致工程塑胶的使用不断增加。
不断变化的消费者和工业趋势加上技术创新可能会推动对工程塑胶的需求。
- 2022 年,北美占全球工程塑胶消费份额的 15%。工程塑胶具有多种性能,可应用于汽车、包装、电气和电子产业。
- 美国在 2022 年的以金额为准年增 7.14%,与前一年同期比较得益于包装和电气电子产业的推动,这两个以金额为准的市场占有率分别占 27% 和 24%。即食方便食品的需求不断增长以及新兴的忙碌生活方式趋势正在推动包装材料消费量的成长,从而推动该地区工程塑胶的销售趋势。随着公司采用在家工作模式且人们设立家庭办公室,对电子设备的需求也随之增加。技术创新也每年创造对电子设备的稳定需求。
- 墨西哥是成长最快的市场,2022 年的以金额为准与 2021 年相比成长了 10.53%,其中工业机械和设备产业占据主导地位。墨西哥希望透过建造高速公路、现代化港口和机械化农场来实现扩张,从而推动施工机械和农业机械的需求。
- 预测期内,北美工程塑胶市场预计复合年增长率为 6.62%,其中电气和电子产业以金额为准复合年增长率最高,为 8.54%。先进材料、有机电子、小型化以及人工智慧和物联网等颠覆性技术的使用也可能推动智慧製造方法的采用,从而推动产业成长。
北美工程塑胶市场趋势
技术创新强劲成长推动整个产业的成长
- 由于技术进步以及智慧电视、冰箱和空调等家用电器的需求不断增加,2017 年至 2019 年北美电气和电子设备产量的复合年增长率超过 1.4%。电子创新的快速步伐推动着对更新、更快的电子产品的需求。因此,该地区的电气和电子设备产量也在增加。
- 由于受新冠疫情的影响,生产设施关闭、供应链中断以及各种其他限制因素,2020 年北美电子产品销售额与 2019 年相比下降了约 9%。结果,该地区2020年电气和电子设备生产收益与前一年同期比较下降了4.7%。
- 2021年该地区的消费性电子产品销售额将达到约1,130亿美元,较2020年成长4%。因此,2021年北美电气和电子设备产量与前一年同期比较增13.8%。
- 到 2027 年,北美预计将成为电气和电子设备生产的第三大地区,占全球市场份额的约 10.5%。虚拟实境、物联网解决方案和机器人等先进技术在家用电器中的应用,提高了效率并降低了成本,为家电产业带来了巨大利益。该地区的家电产业市场规模预计将从 2023 年的 1,276 亿美元成长到 2027 年的约 1,618 亿美元。因此,该地区对电气和电子产品的需求预计将会增加。
北美工程塑胶行业概况
北美工程塑胶市场相当集中,前五大公司占68.68%的市占率。市场的主要企业是:Alfa SAB de CV、Ascend Performance Materials、Indorama Ventures Public Company Limited、Koch Industries, Inc. 和 SABIC(按字母顺序排列)。
其他福利
- Excel 格式的市场预测 (ME) 表
- 3 个月的分析师支持
目录
第 1 章执行摘要和主要发现
第二章 报告要约
第 3 章 简介
- 研究假设和市场定义
- 研究范围
- 调查方法
第四章 产业主要趋势
- 最终用户趋势
- 航太
- 车
- 建筑和施工
- 电气和电子
- 包装
- 进出口趋势
- 氟树脂交易
- 聚酰胺(PA)贸易
- 聚碳酸酯(PC)贸易
- 聚对苯二甲酸乙二酯(PET)贸易
- 聚甲基丙烯酸甲酯(PMMA)贸易
- 聚甲醛(POM)贸易
- 苯乙烯共聚物(ABS 和 SAN)贸易
- 价格趋势
- 回收概述
- 聚酰胺 (PA) 回收趋势
- 聚碳酸酯 (PC) 回收趋势
- 聚对苯二甲酸乙二醇酯 (PET) 的回收趋势
- 苯乙烯共聚物(ABS、SAN)的回收趋势
- 法律规范
- 加拿大
- 墨西哥
- 美国
- 价值链与通路分析
第五章 市场区隔
- 最终用户产业
- 航太
- 车
- 建筑和施工
- 电气和电子
- 工业/机械
- 包装
- 其他最终用户产业
- 树脂类型
- 氟树脂
- 依亚型
- 乙烯-四氟乙烯(ETFE)
- 氟化乙丙烯 (FEP)
- 聚四氟乙烯(PTFE)
- 聚氟乙烯 (PVF)
- 聚二氟亚乙烯(PVDF)
- 其他子树脂类型
- 液晶聚合物(LCP)
- 聚酰胺(PA)
- 依树脂类型分
- 芳香聚酰胺
- 聚酰胺(PA)6
- 聚酰胺(PA)66
- 聚邻苯二甲酰胺
- 聚丁烯对苯二甲酸酯(PBT)
- 聚碳酸酯(PC)
- 聚醚醚酮 (PEEK)
- 聚对苯二甲酸乙二醇酯(PET)
- 聚酰亚胺(PI)
- 聚甲基丙烯酸甲酯 (PMMA)
- 聚甲醛(POM)
- 苯乙烯共聚物(ABS 和 SAN)
- 氟树脂
- 国家
- 加拿大
- 墨西哥
- 美国
第六章 竞争格局
- 主要策略趋势
- 市场占有率分析
- 业务状况
- 公司简介.
- Alfa SAB de CV
- Arkema
- Ascend Performance Materials
- BASF SE
- Celanese Corporation
- Covestro AG
- DuPont
- Eastman Chemical Company
- Formosa Plastics Group
- Indorama Ventures Public Company Limited
- INEOS
- Koch Industries, Inc.
- SABIC
- Solvay
- Trinseo
第七章:执行长的关键策略问题
第 8 章 附录
- 世界概况
- 概述
- 五力分析框架(产业吸引力分析)
- 全球价值链分析
- 市场动态(DRO)
- 资讯来源和进一步阅读
- 图片列表
- 关键见解
- 资料包
- 词彙表
The North America Engineering Plastics Market size is estimated at 18.54 billion USD in 2024, and is expected to reach 25.64 billion USD by 2029, growing at a CAGR of 6.70% during the forecast period (2024-2029).
Packaging industry to lose some of its volume share to electrical and electronics industry
- Engineering plastics have applications ranging from interior wall panels and doors in aerospace to rigid and flexible packaging. The North American engineering plastics market is led by industries such as packaging, electrical and electronics, and automotive. Packaging and electrical and electronics accounted for around 31.35% and 17.43%, respectively, of the engineering plastics market in terms of revenue in 2022.
- Packaging is the largest end-user industry in the region due to families worldwide becoming smaller and significant changes in urbanization and family demographics. These factors increase the demand for functional, prepackaged, and convenient food products. Plastic packaging production in North America had a volume of 22.4 million tons in 2022, which was 16.6% globally. The demand for engineering plastics in the region is increasing due to the increasing consumer demand for packaged food and beverages.
- The electrical and electronics sector is the second largest in the region and especially in the United States. The sector accounted for 1.6% of the GDP. It generated a revenue of USD 576.1 billion in 2022 in the region, thus increasing the demand for electrical and electronics and empowering the onset of electric vehicles, autonomous robots, and top-secret defense technologies, thereby boosting the demand for engineering plastics.
- The electrical and electronics industry is the fastest-growing in the region by revenue, with an expected CAGR of 8.54% during the forecast period (2023-2029), due to increasing applications of engineering plastics for the need of plastic composites in various electrical and electronics applications.
Evolving consumer and industrial trends, coupled with technological innovations, may boost the demand for engineering plastics
- North America accounted for a 15% consumption share of engineering plastics globally in 2022. Engineering plastics exhibit versatile properties, thus finding applications in the automotive, packaging, and electrical and electronics industries.
- The United States recorded a growth of 7.14% by value in 2022 compared to the previous year, attributed to the packaging and electrical and electronics industries, which held 27% and 24% of the market shares, respectively, by value. With an increase in the demand for ready-to-eat convenience food products and the emerging trend of an on-the-go lifestyle, the consumption of packaging materials has increased, thus boosting the sales of engineering plastics in the region. With companies adopting work-from-home models and people setting up home offices, the demand for electronic devices also increased. Technological innovations are also creating consistent demand for electronic gadgets every year.
- Mexico is the fastest-growing market, recording a growth of 10.53% in terms of value in 2022 compared to 2021, led by the industrial machinery and equipment industry. Mexico aims to improve its highways, modernize its ports, and expand its farms by making them more mechanized, thus boosting the demand for construction and farming machinery.
- The North American engineering plastics market is expected to register a CAGR of 6.62% during the forecast period, with the electrical and electronics industry recording the highest CAGR of 8.54% by value. The use of advanced materials, organic electronics, miniaturization, and disruptive technologies like AI and the IoT may also boost the adoption of smart manufacturing practices, thus driving the industry's growth.
North America Engineering Plastics Market Trends
Strong growth of technological innovations to augment the overall growth of the industry
- Electrical and electronics production in North America witnessed a CAGR of over 1.4% between 2017 and 2019 owing to the advancement of technology, coupled with the increasing demand for consumer electronics products, such as smart TVs, refrigerators, air conditioners, and other products. The rapid pace of electronic technological innovation is driving the demand for newer and faster electronic products. As a result, it has also increased the electrical and electronics production in the region.
- Electronic device sales in North America fell by around 9% in 2020 compared to 2019, owing to the COVID-19 impact, because of the production facility shutdowns, supply chain disruptions, and various other constraints. As a result, revenue from electrical and electronics production in the region decreased by 4.7% in 2020 compared to the previous year.
- In 2021, the sales of consumer electronics in the region reached around USD 113 billion, 4% higher than in 2020. As a result, North America's electrical and electronics production grew by 13.8% in 2021 in terms of revenue compared to the previous year.
- By 2027, North America is projected to be the third-largest region for electrical and electronics production and account for a share of around 10.5% of the global market. The emergence of advanced technologies such as virtual reality, IoT solutions, and robotics into consumer electronic products to achieve efficiency and low cost has provided a significant advantage to the consumer electronics industry. The consumer electronics industry in the region is projected to reach a market volume of around USD 161.8 billion by 2027 from USD 127.6 billion in 2023. As a result, the demand for electrical and electronic products in the region is projected to increase.
North America Engineering Plastics Industry Overview
The North America Engineering Plastics Market is fairly consolidated, with the top five companies occupying 68.68%. The major players in this market are Alfa S.A.B. de C.V., Ascend Performance Materials, Indorama Ventures Public Company Limited, Koch Industries, Inc. and SABIC (sorted alphabetically).
Additional Benefits:
- The market estimate (ME) sheet in Excel format
- 3 months of analyst support
TABLE OF CONTENTS
1 EXECUTIVE SUMMARY & KEY FINDINGS
2 REPORT OFFERS
3 INTRODUCTION
- 3.1 Study Assumptions & Market Definition
- 3.2 Scope of the Study
- 3.3 Research Methodology
4 KEY INDUSTRY TRENDS
- 4.1 End User Trends
- 4.1.1 Aerospace
- 4.1.2 Automotive
- 4.1.3 Building and Construction
- 4.1.4 Electrical and Electronics
- 4.1.5 Packaging
- 4.2 Import And Export Trends
- 4.2.1 Fluoropolymer Trade
- 4.2.2 Polyamide (PA) Trade
- 4.2.3 Polycarbonate (PC) Trade
- 4.2.4 Polyethylene Terephthalate (PET) Trade
- 4.2.5 Polymethyl Methacrylate (PMMA) Trade
- 4.2.6 Polyoxymethylene (POM) Trade
- 4.2.7 Styrene Copolymers (ABS and SAN) Trade
- 4.3 Price Trends
- 4.4 Recycling Overview
- 4.4.1 Polyamide (PA) Recycling Trends
- 4.4.2 Polycarbonate (PC) Recycling Trends
- 4.4.3 Polyethylene Terephthalate (PET) Recycling Trends
- 4.4.4 Styrene Copolymers (ABS and SAN) Recycling Trends
- 4.5 Regulatory Framework
- 4.5.1 Canada
- 4.5.2 Mexico
- 4.5.3 United States
- 4.6 Value Chain & Distribution Channel Analysis
5 MARKET SEGMENTATION (includes market size in Value in USD and Volume, Forecasts up to 2029 and analysis of growth prospects)
- 5.1 End User Industry
- 5.1.1 Aerospace
- 5.1.2 Automotive
- 5.1.3 Building and Construction
- 5.1.4 Electrical and Electronics
- 5.1.5 Industrial and Machinery
- 5.1.6 Packaging
- 5.1.7 Other End-user Industries
- 5.2 Resin Type
- 5.2.1 Fluoropolymer
- 5.2.1.1 By Sub Resin Type
- 5.2.1.1.1 Ethylenetetrafluoroethylene (ETFE)
- 5.2.1.1.2 Fluorinated Ethylene-propylene (FEP)
- 5.2.1.1.3 Polytetrafluoroethylene (PTFE)
- 5.2.1.1.4 Polyvinylfluoride (PVF)
- 5.2.1.1.5 Polyvinylidene Fluoride (PVDF)
- 5.2.1.1.6 Other Sub Resin Types
- 5.2.2 Liquid Crystal Polymer (LCP)
- 5.2.3 Polyamide (PA)
- 5.2.3.1 By Sub Resin Type
- 5.2.3.1.1 Aramid
- 5.2.3.1.2 Polyamide (PA) 6
- 5.2.3.1.3 Polyamide (PA) 66
- 5.2.3.1.4 Polyphthalamide
- 5.2.4 Polybutylene Terephthalate (PBT)
- 5.2.5 Polycarbonate (PC)
- 5.2.6 Polyether Ether Ketone (PEEK)
- 5.2.7 Polyethylene Terephthalate (PET)
- 5.2.8 Polyimide (PI)
- 5.2.9 Polymethyl Methacrylate (PMMA)
- 5.2.10 Polyoxymethylene (POM)
- 5.2.11 Styrene Copolymers (ABS and SAN)
- 5.2.1 Fluoropolymer
- 5.3 Country
- 5.3.1 Canada
- 5.3.2 Mexico
- 5.3.3 United States
6 COMPETITIVE LANDSCAPE
- 6.1 Key Strategic Moves
- 6.2 Market Share Analysis
- 6.3 Company Landscape
- 6.4 Company Profiles (includes Global Level Overview, Market Level Overview, Core Business Segments, Financials, Headcount, Key Information, Market Rank, Market Share, Products and Services, and Analysis of Recent Developments).
- 6.4.1 Alfa S.A.B. de C.V.
- 6.4.2 Arkema
- 6.4.3 Ascend Performance Materials
- 6.4.4 BASF SE
- 6.4.5 Celanese Corporation
- 6.4.6 Covestro AG
- 6.4.7 DuPont
- 6.4.8 Eastman Chemical Company
- 6.4.9 Formosa Plastics Group
- 6.4.10 Indorama Ventures Public Company Limited
- 6.4.11 INEOS
- 6.4.12 Koch Industries, Inc.
- 6.4.13 SABIC
- 6.4.14 Solvay
- 6.4.15 Trinseo
7 KEY STRATEGIC QUESTIONS FOR ENGINEERING PLASTICS CEOS
8 APPENDIX
- 8.1 Global Overview
- 8.1.1 Overview
- 8.1.2 Porter's Five Forces Framework (Industry Attractiveness Analysis)
- 8.1.3 Global Value Chain Analysis
- 8.1.4 Market Dynamics (DROs)
- 8.2 Sources & References
- 8.3 List of Tables & Figures
- 8.4 Primary Insights
- 8.5 Data Pack
- 8.6 Glossary of Terms
 PEEK特种工程塑胶:全球市场占有率及排名、总收入及需求预测(2025-2031年)PA66工程塑胶:全球市场份额和排名、总收入和需求预测(2025-2031年)
 工程塑胶市场(按产品类型、加工技术、形式和应用)—全球预测,2025-2032聚甲醛市场按应用、等级、加工技术、通路和产品类型划分-2025-2032年全球预测
 2025年全球工程塑胶市场报告
 2025-2033年工程塑胶市场报告(按类型、性能参数、应用和地区)日本工程塑胶市场报告(按树脂类型、最终用途行业和地区)2025-2033
 中东工程塑胶:市场占有率分析、产业趋势和成长预测(2024-2029)中国工程塑胶:市场占有率分析、产业趋势与统计、成长预测(2024-2029)亚太工程塑胶:市场占有率分析、产业趋势与统计、成长预测(2024-2029 年)