


 |
市场调查报告书
商品编码
1939622
干混砂浆:市场占有率分析、产业趋势与统计、成长预测(2026-2031)Dry Mix Mortar - Market Share Analysis, Industry Trends & Statistics, Growth Forecasts (2026 - 2031) |
||||||
※ 本网页内容可能与最新版本有所差异。详细情况请与我们联繫。
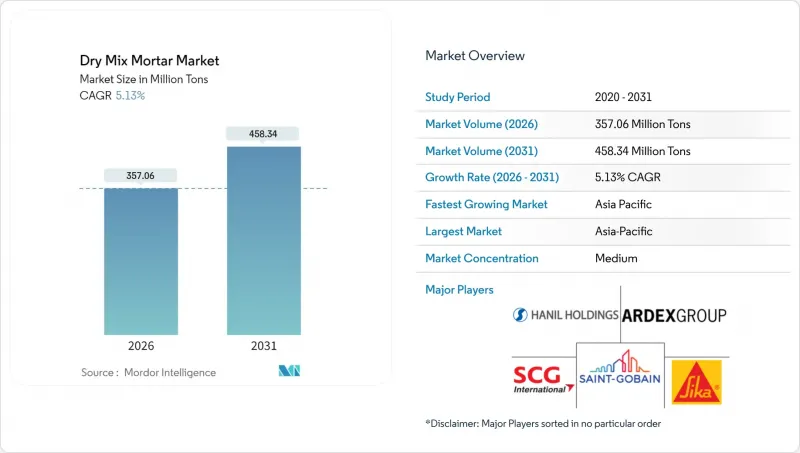
预计干混砂浆市场将从 2025 年的 3.3965 亿吨成长到 2026 年的 3.5706 亿吨,到 2031 年将达到 4.5834 亿吨,2026 年至 2031 年的复合年增长率为 5.13%。
持续高都市化、亚洲国家强制性预混合料砂浆政策以及承包商对更快工期的需求,都是推动这一市场扩张的因素。工厂预製的混合料配方能够最大限度地减少现场施工的差异,提高品质一致性,并降低劳动力需求。这些优势在面临技术纯熟劳工短缺的地区尤其重要。细分市场的需求也向高附加价值混合料转变,例如瓷砖黏合剂、外墙外保温系统(EIFS)砂浆和维修材料,这些产品具有提高生产效率和节能的特性。随着主要生产商确保原材料供应并投资于自动化生产线以降低营运成本和碳排放,产业整合仍在继续。然而,水泥和添加剂价格的波动,以及建造先进工厂所需的大量资本投资,正在限制整体成长前景。
全球干混砂浆市场趋势与洞察
亚太地区的快速都市化和基础设施投资
预计到2025年,中国的都市化将达到68%,这将推动住宅维修和基础设施升级中砂浆需求的稳定成长。高速铁路网的扩张以及薄层产品在预製构件产业的广泛应用,也促进了特种砂浆消费量的成长。泰国和越南政府的基础设施预算维持着两位数的建设支出成长,这鼓励了当地製造商扩大产能并取代进口产品。该地区飞灰和矿渣的日益普及,有助于降低生产成本并符合环保法规。这些因素共同推动了干混砂浆市场的长期成长。
节能建筑标准-对外墙外保温系统和保温砂浆的需求
日益严格的保温性能法规推动了对用于外墙外保温系统(EIFS)中保温板黏结和涂覆的砂浆的需求。欧盟的碳边境管制机制对高排放进口产品征收附加税,并鼓励在地采购低碳砂浆。中国新的高压釜气混凝土标准提高了抗压强度指标,促使建筑商采用符合规范的高黏结性外加剂。诸如DigiCoPro系统等数位化品质监测原型凸显了砂浆产业向配备感测器的砂浆转变,这些感测器可以追踪养护状态并确保最佳性能。修订后的ISO 13007:2025标准和中国更严格的认证规则正式确立了这些高标准要求,并支援特种砂浆在多个地区的广泛应用。
原物料价格波动
2024年,水泥原料成本波动剧烈,河沙价格下跌,导緻小规模生产商面临难以承受的利润波动。生产商的应对措施是提高工业废弃物的替代率,但这些替代通常需要额外的加工和严格的品管。区域碳定价进一步加剧了价格波动。贸易争端和添加剂短缺导致的供应中断使挑战雪上加霜,迫使生产商频繁调整价格,并损害了客户关係。
细分市场分析
在干粉砂浆市场中,磁砖黏合剂预计将呈现最快的成长轨迹,到2031年将以6.35%的复合年增长率成长。这主要得益于瓷砖销售的成长。大尺寸瓷砖需要高性能、缓释性能好的黏合剂,而预製建筑中异地预製板的出现进一步增加了对黏度可控产品的需求。同时,由于抹灰层在结构层和饰面层中的多功能性,到2025年将保持最大的市场份额,达到33.45% 。都市区住宅存量厨房和浴室维修工程对抹灰和接缝密封剂的需求不断增长,而防水浆料在高湿度沿海基础设施中也获得了独特的市场需求。隔热材料相容性砂浆透过兼顾隔热和结构性能,满足了更严格的节能标准。
随着新建住宅向高端室内装修方向发展,与瓷砖黏合剂相关的干粉砂浆市场规模预计将迅速扩大。商业地板材料安装商指出,返工率降低和施工时间缩短是其主要优势,也因此支撑了较高的价格。製造商正透过推出具有抗泛碱和适应基材移动特性的聚合物改质配方来区分产品。抹灰砂浆细分市场竞争仍然激烈,其成长主要与占地面积的增加有关。同时,专业製造商正专注于多层系统,透过单一品牌提供黏合剂、接缝密封剂和防水产品,从而提升产品的生命週期价值。
干混砂浆报告按应用领域(抹灰、粉刷、瓷砖黏合剂、水泥浆、防水浆料、混凝土保护与维修等)、最终用途产业(商业、工业及公共、基础设施、住宅)和地区(亚太、北美、欧洲、南美、中东和非洲)进行细分。市场预测以吨为单位。
区域分析
亚太地区将继续引领干混砂浆市场,预计到2025年将占全球市场份额的46.80%,并预计在2031年之前以5.32%的复合年增长率持续增长。中国强制规定要求新建建筑使用预混合料砂浆,以及持续的城市改造项目,都支撑了市场需求的成长。东南亚各国政府大力推动交通和能源计划,加上在地化生产以减少进口,也推动了市场规模的成长。
预计北美地区将实现温和成长,这得益于基础设施建设相关法规的推动以及商业室内装饰市场的復苏。持续存在的技术纯熟劳工短缺推动了对桶装式和筒仓式砂浆的需求,从而简化了墙体组装。由于贸易壁垒导致从中国的进口量下降,国内製造商正持续扩大区域仓库以弥补缺口。加拿大的住宅开工量和墨西哥的工业设施建设正在稳定区域消费,而跨境供应链则确保了材料供应的稳定。
欧洲仍然是需求的主要贡献者,这主要得益于严格的能源法规和老旧建筑的加速维修。碳边境调节机制有效地扶持了本地低碳砂浆,使本地生产商在成本上优于进口商。德国、法国和北欧国家正在推动飞灰混合砂浆的标准化。南美洲,尤其是巴西,展现出良好的发展前景,这得益于铁路和地铁计划中对特种水泥浆的广泛应用。在中东和非洲,与大型住宅和旅游开发相关的建设化学品支出也将支撑需求。
其他福利:
- Excel格式的市场预测(ME)表
- 3个月的分析师支持
目录
第一章 引言
- 研究假设和市场定义
- 调查范围
第二章调查方法
第三章执行摘要
第四章 市场情势
- 市场概览
- 市场驱动因素
- 亚太地区的快速都市化和基础设施投资
- 节能建筑标准-对外墙外隔热系统(EIFS) 与保温砂浆的需求
- 劳动力短缺推动了对即用型预混合料解决方案的需求。
- 推出智慧现场RFID联动筒仓配料系统
- 利用砂浆基可列印混合物进行3D混凝土列印
- 市场限制
- 原料(水泥和添加剂)价格波动
- 自动化干混料厂需高额资本投入
- 新兴经济体熟练建筑工人短缺
- 价值链分析
- 法律规范
- 波特五力模型
- 新进入者的威胁
- 供应商的议价能力
- 买方的议价能力
- 替代品的威胁
- 竞争对手之间的竞争
第五章 市场规模与成长预测
- 透过使用
- 石膏
- 渲染
- 磁砖黏合剂
- 水泥浆
- 防水浆料
- 混凝土保护与维修
- 保温和饰面系统
- 其他的
- 按最终用途
- 商业的
- 工业和公共设施
- 基础设施
- 住宅
- 按地区
- 亚太地区
- 中国
- 印度
- 日本
- 韩国
- 印尼
- 马来西亚
- 泰国
- 越南
- 亚太其他地区
- 北美洲
- 我们
- 加拿大
- 墨西哥
- 欧洲
- 法国
- 德国
- 义大利
- 俄罗斯
- 西班牙
- 英国
- 其他欧洲地区
- 南美洲
- 巴西
- 阿根廷
- 其他南美洲
- 中东和非洲
- 沙乌地阿拉伯
- 南非
- 其他中东和非洲地区
- 亚太地区
第六章 竞争情势
- 市场集中度
- 策略趋势
- 市占率(%)/排名分析
- 公司简介
- Ardex Group
- CEMEX SAB de CV
- Grupo Puma
- HANIL HOLDINGS CO., LTD.
- Holcim
- LATICRETE International Inc.
- MAPEI SpA
- Saint-Gobain
- SAMPYO Group
- SCG International Corporation
- SIG
- Sika AG
- Trimurti Wall Care Products Pvt Ltd
- UltraTech Cement Ltd.
- Votorantim Cimentos
第七章 市场机会与未来展望
第八章:执行长面临的关键策略挑战
The Dry Mix Mortar Market is expected to grow from 339.65 million tons in 2025 to 357.06 million tons in 2026 and is forecast to reach 458.34 million tons by 2031 at 5.13% CAGR over 2026-2031.
Persistently high urbanization rates, mandatory pre-mixed mortar policies in several Asian countries, and contractors' need to shorten project schedules underpin this expansion. Factory-produced formulations minimize on-site variability, improve quality consistency, and reduce labor requirements, advantages that resonate strongly in regions facing skilled-worker shortages. Segmental demand is also shifting toward value-added blends such as tile adhesives, EIFS mortars, and renovation compounds that deliver higher productivity or energy-saving functionality. Consolidation among leading manufacturers continues as they secure raw material supplies and invest in automated production lines that cut operating costs and reduce carbon intensity. At the same time, volatile cement and additive prices, as well as the significant capital required for state-of-the-art plants, temper the overall growth outlook.
Global Dry Mix Mortar Market Trends and Insights
Rapid Urbanization and Infrastructure Outlay in Asia-Pacific
China's urbanization rate reached 68% in 2025, resulting in steady demand for mortar in residential renovations and infrastructure upgrades. High-speed rail expansion is driving an increase in specialized mortar consumption, as thin-layer products gain traction in prefabricated segments. Government infrastructure budgets in Thailand and Vietnam are sustaining double-digit construction spending, encouraging local producers to boost capacity and replace imported volumes. The region's incremental use of fly ash and slag lowers production costs and addresses environmental mandates. Together, these elements contribute significantly to the long-term growth of the dry mix mortar market.
Energy-Efficient Building Codes - Demand for EIFS and Insulation Mortars
Tighter thermal-performance regulations raise demand for mortars that bond and coat insulation boards in EIFS systems. The European Union's Carbon Border Adjustment Mechanism imposes charges on high-emission imports, prompting local sourcing of low-carbon mortars. China's new autoclaved aerated concrete standard increased compressive-strength metrics, prompting builders to adopt compatible high-adhesion mixes. Digital quality-monitoring prototypes, such as the DigiCoPro system, highlight the shift toward sensor-enabled mortars that track curing conditions and ensure optimal performance. Revised ISO 13007:2025 benchmarks and China's stricter certification rules formalize these higher requirements, supporting specialty-mortar uptake in multiple regions.
Raw-Material Price Volatility
Cement input costs fluctuated considerably in 2024, while river-sand prices fell, producing margin swings that small-scale manufacturers struggle to absorb. Producers respond by increasing industrial-waste substitution rates; however, these alternatives often require additional processing and stricter quality controls. Regional carbon pricing further compounds variability. Supply disruptions tied to trade disputes and additive shortages aggravate the challenge, forcing frequent price revisions that strain customer relations.
Other drivers and restraints analyzed in the detailed report include:
- Labor Shortages Driving Ready-to-Use Pre-Mixed Solutions
- Smart-Job-Site Adoption of RFID-Linked Silo Dosing
- High Capex for Automated Dry-Mix Plants
For complete list of drivers and restraints, kindly check the Table Of Contents.
Segment Analysis
Tile adhesive holds the fastest trajectory within the dry mix mortar market, growing at a 6.35% CAGR through 2031, driven by the sales of ceramic tiles. Large-format tiles require high-performance bonding agents with extended open times, and off-site panelization in prefabricated schemes amplifies the demand for controlled-viscosity products. In contrast, plaster maintains the largest volume base at 33.45% in 2025, due to its ubiquity across both structural and finishing layers. Render and grouts capture incremental volume from renovation of kitchens and bathrooms in urban housing stock, while waterproofing slurries find niche uptake in coastal infrastructure facing elevated moisture stress. Insulation-compatible mortars align with energy-code upgrades, bundling thermal and structural performance.
The dry mix mortar market size tied to tile adhesive is projected to surge as new housing starts pivot toward premium interior finishes. Commercial flooring contractors cite lower rework rates and quicker turnaround as key benefits, justifying price premiums. Manufacturers differentiate via polymer-modified formulations that resist efflorescence and accommodate substrate movement. The plaster sub-segment remains price-competitive, with growth largely tracking floor-space additions. Specialist providers, meanwhile, focus on composite-layer systems where a single brand can supply adhesive, grout, and waterproofing components to capture higher lifecycle value.
The Dry Mix Mortar Report is Segmented by Application (Plaster, Render, Tile Adhesive, Grouts, Water Proofing Slurries, Concrete Protection and Renovation, and More), End-Use Sector (Commercial, Industrial and Institutional, Infrastructure, and Residential), and Geography (Asia-Pacific, North America, Europe, South America, and Middle East and Africa). The Market Forecasts are Provided in Terms of Volume (Tons).
Geography Analysis
The Asia-Pacific region continued to dominate the dry mix mortar market in 2025, accounting for 46.80% of the global volume, and is forecast to expand at a 5.32% CAGR through 2031. Chinese regulations mandating the use of pre-mixed mortar in new buildings, coupled with ongoing urban renewal, sustain the momentum in demand. Southeast Asian governments are pushing transport and energy projects, which reinforces volume growth while localizing production to reduce imports.
North America is expected to post moderate growth, anchored by infrastructure bills and a rebound in commercial interiors. Persistent skilled-labor constraints heighten the appetite for bucketed or silo-fed mortars that streamline wall assemblies. Domestic producers continue adding regional depots to offset a drop in Chinese imports triggered by trade barriers. Canada's residential starts and Mexico's industrial build-outs stabilize regional consumption, with cross-border supply chains ensuring a steady flow of materials.
Europe retains a sizeable base fueled by stringent energy regulations and accelerated refurbishments of aging building stock. The Carbon Border Adjustment Mechanism effectively rewards local low-carbon mortars, giving regional producers a cost advantage versus importers. Standardization of fly-ash-blended mixes gains traction across Germany, France, and the Nordics. South America shows promise, particularly in Brazil, where rail and metro projects are adopting specialty grouts, while the Middle East and Africa benefit from construction chemicals expenditure tied to large-scale housing and tourism developments.
- Ardex Group
- CEMEX S.A.B. de C.V.
- Grupo Puma
- HANIL HOLDINGS CO., LTD.
- Holcim
- LATICRETE International Inc.
- MAPEI S.p.A.
- Saint-Gobain
- SAMPYO Group
- SCG International Corporation
- SIG
- Sika AG
- Trimurti Wall Care Products Pvt Ltd
- UltraTech Cement Ltd.
- Votorantim Cimentos
Additional Benefits:
- The market estimate (ME) sheet in Excel format
- 3 months of analyst support
TABLE OF CONTENTS
1 Introduction
- 1.1 Study Assumptions and Market Definition
- 1.2 Scope of the Study
2 Research Methodology
3 Executive Summary
4 Market Landscape
- 4.1 Market Overview
- 4.2 Market Drivers
- 4.2.1 Rapid urbanization and infrastructure outlay in Asia-Pacific
- 4.2.2 Energy-efficient building codes - demand for EIFS and insulation mortars
- 4.2.3 Labour shortages driving ready-to-use pre-mixed solutions
- 4.2.4 Smart-job-site adoption of RFID-linked silo dosing
- 4.2.5 3-D concrete printing using mortar-based printable mixes
- 4.3 Market Restraints
- 4.3.1 Raw-material (cement and additive) price volatility
- 4.3.2 High capex for automated dry-mix plants
- 4.3.3 Shortage of skilled applicators in emerging economies
- 4.4 Value Chain Analysis
- 4.5 Regulatory Framework
- 4.6 Porter's Five Forces
- 4.6.1 Threat of New Entrants
- 4.6.2 Bargaining Power of Suppliers
- 4.6.3 Bargaining Power of Buyers
- 4.6.4 Threat of Substitutes
- 4.6.5 Competitive Rivalry
5 Market Size and Growth Forecasts (Volume)
- 5.1 By Application
- 5.1.1 Plaster
- 5.1.2 Render
- 5.1.3 Tile Adhesive
- 5.1.4 Grouts
- 5.1.5 Water Proofing Slurries
- 5.1.6 Concrete Protection and Renovation
- 5.1.7 Insulation and Finishing Systems
- 5.1.8 Others
- 5.2 By End-use Sector
- 5.2.1 Commercial
- 5.2.2 Industrial and Institutional
- 5.2.3 Infrastructure
- 5.2.4 Residential
- 5.3 By Geography
- 5.3.1 Asia-Pacific
- 5.3.1.1 China
- 5.3.1.2 India
- 5.3.1.3 Japan
- 5.3.1.4 South Korea
- 5.3.1.5 Indonesia
- 5.3.1.6 Malaysia
- 5.3.1.7 Thailand
- 5.3.1.8 Vietnam
- 5.3.1.9 Rest of Asia-Pacific
- 5.3.2 North America
- 5.3.2.1 United States
- 5.3.2.2 Canada
- 5.3.2.3 Mexico
- 5.3.3 Europe
- 5.3.3.1 France
- 5.3.3.2 Germany
- 5.3.3.3 Italy
- 5.3.3.4 Russia
- 5.3.3.5 Spain
- 5.3.3.6 United Kingdom
- 5.3.3.7 Rest of Europe
- 5.3.4 South America
- 5.3.4.1 Brazil
- 5.3.4.2 Argentina
- 5.3.4.3 Rest of South America
- 5.3.5 Middle-East and Africa
- 5.3.5.1 Saudi Arabia
- 5.3.5.2 South Africa
- 5.3.5.3 Rest of Middle-East and Africa
- 5.3.1 Asia-Pacific
6 Competitive Landscape
- 6.1 Market Concentration
- 6.2 Strategic Moves
- 6.3 Market Share (%)/Ranking Analysis
- 6.4 Company Profiles {(includes Global level Overview, Market level overview, Core Segments, Financials as available, Strategic Information, Market Rank/Share for key companies, Products and Services, and Recent Developments)}
- 6.4.1 Ardex Group
- 6.4.2 CEMEX S.A.B. de C.V.
- 6.4.3 Grupo Puma
- 6.4.4 HANIL HOLDINGS CO., LTD.
- 6.4.5 Holcim
- 6.4.6 LATICRETE International Inc.
- 6.4.7 MAPEI S.p.A.
- 6.4.8 Saint-Gobain
- 6.4.9 SAMPYO Group
- 6.4.10 SCG International Corporation
- 6.4.11 SIG
- 6.4.12 Sika AG
- 6.4.13 Trimurti Wall Care Products Pvt Ltd
- 6.4.14 UltraTech Cement Ltd.
- 6.4.15 Votorantim Cimentos
7 Market Opportunities and Future Outlook
- 7.1 White-space and Unmet-Need Assessment
8 Key Strategic Questions for CEOs
 东协干混砂浆:市占率分析、产业趋势与统计、成长预测(2026-2031)欧洲干粉砂浆:市场占有率分析、产业趋势与统计、成长预测(2026-2031)
 2026年全球干混砂浆添加剂和化学品市场报告
 塔式干粉砂浆搅拌站市场按产品类型、搅拌能力、应用、最终用途和分销管道划分-2026-2032年全球预测自流平砂浆添加剂市场按类型、形态、应用、终端用户产业和分销管道划分,全球预测,2026-2032年预拌建筑砂浆市场(依产品类型、形态、包装类型、应用、最终用途及通路划分)-2026-2032年全球预测
 干混砂浆添加剂和化学品市场规模、份额和成长分析(按添加剂类型、化学品类型、应用、最终用户和地区划分)—2026-2033年产业预测
 干混砂浆市场规模、份额和成长分析(按产品类型、粘合剂类型、添加剂、最终用户、技术、应用和地区划分)—产业预测(2026-2033 年)
 全球干混砂浆市场:依产品种类、塑化剂种类、应用、黏结剂系统及地区划分(至2032年)干混砂浆市场按类型、应用、最终用途、包装、通路和计划类型划分-2025年至2032年全球预测