


 |
市场调查报告书
商品编码
1687723
北美有机肥料:市场占有率分析、行业趋势和成长预测(2025-2030)North America Organic Fertilizer - Market Share Analysis, Industry Trends & Statistics, Growth Forecasts (2025 - 2030) |
||||||
※ 本网页内容可能与最新版本有所差异。详细情况请与我们联繫。
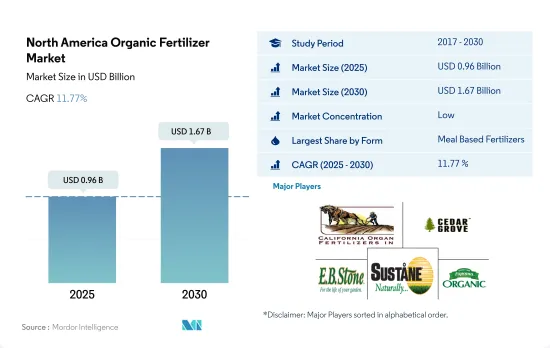
北美有机肥料市场规模预计在 2025 年为 9.6 亿美元,预计到 2030 年将达到 16.7 亿美元,预测期内(2025-2030 年)的复合年增长率为 11.77%。
- 有机肥料已成为植物生长可靠永续的营养来源,与合成肥料相比具有多种优势,导致2017年至2022年间有机肥料使用量增加了56.5%。这些肥料易于获取,成本效益高,并提供植物生长所需的中等浓度的关键元素,同时最大限度地减少了合成肥料的缺点。采用率的增加可能是由于营养物质逐渐释放到土壤溶液中,从而保持土壤肥力和营养平衡,促进植物正常生长。
- 血粉、骨粉和海带粉等膳食肥料是北美最常用的有机肥料。占2022年市场占有率的49.1%。这些肥料因其营养价值而受欢迎:血粉富含氮,骨粉富含磷和钙,海带粉 NPK 含量低但富含矿物质。
- 堆肥是第二大有机肥料,可以改善土壤的物理化学性质,例如土壤结构和保水能力。但堆肥的养分含量很低,无法提供作物所需的全部养分。为了解决这个问题,农民开始使用其他有机肥料,如油饼和鱼粪。
- 自新冠疫情爆发以来,由于有机农业的普及和消费者对有机产品的兴趣增加,北美的有机肥料使用量预计将进一步增加。这些肥料为维持土壤肥力、提高作物产量和确保粮食安全提供了永续且环保的解决方案。
- 北美有机肥料市场目前由美国主导,占2022年市场价值的约40.7%。这种主导地位很大程度上归功于该国大量的有机种植面积,2022年占北美有机作物总作物面积的39.6%。墨西哥则位居第二,占2022年该地区有机肥料市值的33.4%。墨西哥的有机作物总面积也在增加,预计到2028年将达到61万公顷,增加10.9%。
- 2022 年,加拿大约占该地区有机肥料市场总量的 25.5%。加拿大最近获得了农业和农业食品部的投资,以支持有机产业的永续性和扩张,这将推动加拿大有机肥料市场的发展,预计 2023 年至 2029 年期间的复合年增长率为 11.4%。
- 北美以外地区(包括哥斯大黎加、古巴、牙买加和瓜地马拉等国家)的有机种植面积从2017年到2022年成长了10.3%,到2022年达到5,500公顷。咖啡、糖、可可和香辛料等经济作物是这些国家的主要种植作物,占2022年有机种植面积的93.6%。
- 北美有机肥料市场受到有机作物日益增长的需求和永续农业的需求的推动。随着越来越多的国家和公司投资有机农业领域,预计未来几年市场将会成长。
北美有机肥料市场趋势
美国等主要国家对有机农产品的需求正在成长,政府的支持也有助于增加有机农产品的种植面积。
- 根据FibL统计的资料,2021年北美有机种植面积达到创纪录的150万公顷。该地区的有机种植面积从2017年到2022年增加了13.5%。在北美国家中,美国占据主导地位,有62.3万公顷的农地进行有机种植,其中加州、缅因州和纽约州是实施有机种植的主要州。
- 紧随美国之后的是墨西哥,2021年有机农业面积达531,100公顷。墨西哥是全球前20大有机食品生产国之一。根据世界咖啡大师的资料,墨西哥是世界上最大的有机咖啡出口国。这里是全国有机咖啡生产面积最大、有机咖啡种植者数量最多的地区。该国主要的有机食品生产州包括恰帕斯州、瓦哈卡州、米却肯州、奇瓦瓦州和格雷罗州,2021年这些州的有机种植面积占全国的80.0%。全国有机农业协会等组织正在该国推广有机农业,预计将激励更多农民从事有机农业。除了资金支持,墨西哥政府也支持有助于推广有机农业的研发活动。
- 加拿大作物作物面积将从2017年的40万公顷增加到2021年的45万公顷。 2021年将占种植面积的最大份额,达42万公顷。加拿大政府宣布,将于2021年向有机发展基金提供297,330美元,用于支持有机农民。这些努力有望增加该地区有机种植的面积。
国内外市场对有机农产品的需求不断成长,人均有机食品支出不断增加
- 2021年北美人均有机食品支出为109.7美元。美国的人均支出是北美国家中最高的,2021年平均支出为186.7美元。 2021年,美国有机产品销售额超过630亿美元。美国有机食品协会的数据显示,2021与前一年同期比较有机食品销售额达575亿美元,较去年同期成长2.0%。有机水果和蔬菜占有机产品总销售额的15.0%,2021年销售额达210亿美元。
- 根据加拿大有机联盟报告的资料,2020 年加拿大有机食品销售额达到 81 亿美元。加拿大是全球第六大有机产品市场,据报道,其有机产品供应未能满足国内需求。 2021年有机食品人均支出为142.6美元。政府加大对零售商的支持力度预计将提高该国有机产品的供应量、可近性和可负担性。有机塔尔德协会估计,加拿大有机产品市场将在 2021 年至 2026 年间成长,复合年增长率为 6.3%。
- 2021年,墨西哥有机产品市场规模为6,300万美元,全球排名第35。预计墨西哥在 2021 年至 2026 年期间的复合年增长率为 7.2%。然而,该国 2021 年的人均有机产品支出为 0.49 美元,与该地区的其他国家相比较低。随着越来越多的公司进入墨西哥市场,预计该国对有机产品的需求将会增加。
北美有机肥料产业概况。
北美有机肥市场分散,前五大公司占8.74%的市占率。市场的主要企业有:California Organic Fertilizers Inc.、Cedar Grove Composting Inc.、EBStone & Sons Inc.、Sustane Natural Fertilizer Inc. 和 The Espoma Company(按字母顺序排列)。
其他福利
- Excel 格式的市场预测 (ME) 表
- 3个月的分析师支持
目录
第一章执行摘要和主要发现
第二章 报告要约
第三章 引言
- 研究假设和市场定义
- 研究范围
- 调查方法
第四章 产业主要趋势
- 有机种植区
- 有机产品人均支出
- 法律规范
- 加拿大
- 墨西哥
- 美国
- 价值炼和通路分析
第五章市场区隔
- 形式
- 肥料
- 餐食基肥料
- 油饼
- 其他有机肥料
- 作物类型
- 经济作物
- 园艺作物
- 田间作物
- 国家
- 加拿大
- 墨西哥
- 美国
- 北美其他地区
第六章 竞争格局
- 关键策略趋势
- 市场占有率分析
- 商业状况
- 公司简介.
- BioFert Manufacturing Inc.
- California Organic Fertilizers Inc.
- Cascade Agronomics LLC
- Cedar Grove Composting Inc.
- EBStone & Sons Inc.
- Morgan Composting Inc.
- Sustane Natural Fertilizer Inc.
- The Espoma Company
- The Rich Lawn Company LLC
- Walts Organic Fertilizers Co.
第七章:CEO面临的关键策略问题
第 8 章 附录
- 世界概况
- 概述
- 五力分析框架
- 全球价值链分析
- 市场动态(DRO)
- 资讯来源及延伸阅读
- 图片列表
- 关键见解
- 资料包
- 词彙表
The North America Organic Fertilizer Market size is estimated at 0.96 billion USD in 2025, and is expected to reach 1.67 billion USD by 2030, growing at a CAGR of 11.77% during the forecast period (2025-2030).
- Organic fertilizers emerged as a reliable and sustainable source of nutrients for plant growth, offering several advantages over synthetic fertilizers, leading to the increased usage of organic fertilizers by 56.5% between 2017 and 2022. These fertilizers are easily accessible, cost-effective, and provide a moderate concentration of vital elements required for plant growth while minimizing the drawbacks associated with synthetic fertilizers. The rise in adoption can be attributed to the gradual release of nutrients into the soil solution, which helps maintain soil fertility and nutrient balance, leading to proper plant growth.
- Meal-based fertilizers, such as blood meal, bone meal, and kelp meal, are the most consumed organic fertilizers in North America. They accounted for 49.1% of the market share in 2022. These fertilizers are popular due to their high nutrient content, with blood meal being rich in nitrogen, bone meal being high in phosphorus and calcium, and kelp meal being low in NPK but rich in minerals.
- Manures are the second largest organic fertilizers that improve the physiochemical properties of the soil, such as its structure and water-holding capacity. However, manures cannot provide all the necessary nutrients required for crops, as their nutrient content is significantly low. Farmers increasingly turn to other organic fertilizers, such as oilcake and fish guano, to address this issue.
- The growing adoption of organic farming and consumer interest in organic products following the COVID-19 pandemic is expected to drive further growth in the usage of organic fertilizers in North America. These fertilizers offer a sustainable and environmentally-friendly solution for maintaining soil fertility, improving crop yields, and ensuring food security.
- The North American organic fertilizers market is currently dominated by the United States, which accounted for approximately 40.7% of the market value in 2022. This domination is largely due to the country's large organic cultivation area, which accounted for 39.6% of the total North American organic crop area in 2022. In second place is Mexico, which accounted for 33.4% of the region's organic fertilizers market value in 2022. Mexico's total organic crop area is also increasing, with a projected growth of 10.9% to reach 610.0 thousand hectares by 2028.
- Canada accounted for approximately 25.5% of the total organic fertilizer market value in the region in 2022. The country has recently received an investment from the Ministry of Agriculture and Agri-Food to support the sustainability and expansion of its organics sector, which is anticipated to drive the Canadian organic fertilizer market and record a CAGR of 11.4% between 2023 and 2029
- The Rest of North America, which includes countries like Costa Rica, Cuba, Jamaica, and Guatemala, saw an increase in organic acreage by 10.3% between 2017 and 2022, reaching 5.5 thousand hectares in 2022. Cash crops such as coffee, sugar, cocoa, and spices are the major crops grown in these countries, and they accounted for 93.6% of total organic acreage in 2022.
- The North American organic fertilizer market is driven by the increasing demand for organic crops and the need for sustainable agriculture practices. As more countries and companies invest in the organic agriculture sector, the market is expected to grow in the coming years.
North America Organic Fertilizer Market Trends
Organic produce demand grows in major countries like the United States, increasing cultivation area with government support
- The area under organic cultivation of crops in North America was recorded at 1.5 million hectares in 2021, according to the data provided by FibL statistics. The organic area in the region increased by 13.5% between 2017 and 2022. Among the North American countries, the United States was dominant, with 623.0 thousand hectares of agricultural land under organic farming, with California, Maine, and New York being the major states practicing agriculture.
- The United States is followed by Mexico, with 531.1 thousand hectares of area under organic farming in 2021. Mexico is among the top 20 organic food producers in the world. Mexico is the largest exporter of organic coffee in the world, according to Global Coffee Masters data. The country has the largest area under organic coffee production and even in terms of the number of organic coffee producers in the country. The major organic food-producing states in the country include Chiapas, Oaxaca, Michoacan, Chihuahua, and Guerrero, which accounted for 80.0% of the total organic area in the country in 2021. Organizations such as National Association for Organic Agriculture promote organic agriculture in the country, which is expected to motivate more farmers to take up organic agriculture. In addition to financial assistance, the Mexican government supports research and development activities to help promote organic agriculture.
- Canada's area under organic crop cultivation increased from 0.40 million hectares in 2017 to 0.45 million hectares in 2021. Row crops occupied the maximum area with 0.42 million hectares in 2021. The Canadian government announced a sum of USD 297,330 in 2021 as Organic Development Fund to support organic farmers. These initiatives are expected to increase the organic area in the region.
Growing demand for organic produce in domestic and international markets, rise in per capita spending on organic food
- North America's average per capita spending on organic food products was USD 109.7 in 2021. The per capita spending in the United States is the highest among the North American countries, with average spending of USD 186.7 in 2021. The sales of organic products in the United States crossed USD 63.00 billion in 2021. Organic Tarde Association accounted for a 2.0% increase over the previous year, with organic food sales at USD 57.5 billion in 2021. Organic fruits and vegetables accounted for 15.0% of the total organic product sales, valued at USD 21.0 billion in 2021.
- Organic food sales in Canada reached a value of USD 8.10 billion in 2020, as per the data reported by the Organic Federation of Canada. It is reported that Canada is the 6th largest market in the world for Organic products, with the supply of organic products failing to keep up with the demand in the country. The average spending on organic food per person was USD 142.6 in 2021. Increasing government support to retailers is expected to increase the availability, accessibility, and affordability of organic products in the country. Organic Tarde Association estimated the organic products market in Canada to grow and register a CAGR of 6.3% between 2021 and 2026.
- In 2021, Mexico registered a market size of USD 63.0 million for organic products with a global rank of 35. It is estimated to grow and register a CAGR of 7.2% between 2021 and 2026. However, the per capita spending on organic products in the country is less than in other countries in the region, with a value of USD 0.49 in 2021. More players entering the market in Mexico are expected to increase the demand for organic products in the country.
North America Organic Fertilizer Industry Overview
The North America Organic Fertilizer Market is fragmented, with the top five companies occupying 8.74%. The major players in this market are California Organic Fertilizers Inc., Cedar Grove Composting Inc., E.B.Stone & Sons Inc., Sustane Natural Fertilizer Inc. and The Espoma Company (sorted alphabetically).
Additional Benefits:
- The market estimate (ME) sheet in Excel format
- 3 months of analyst support
TABLE OF CONTENTS
1 EXECUTIVE SUMMARY & KEY FINDINGS
2 REPORT OFFERS
3 INTRODUCTION
- 3.1 Study Assumptions & Market Definition
- 3.2 Scope of the Study
- 3.3 Research Methodology
4 KEY INDUSTRY TRENDS
- 4.1 Area Under Organic Cultivation
- 4.2 Per Capita Spending On Organic Products
- 4.3 Regulatory Framework
- 4.3.1 Canada
- 4.3.2 Mexico
- 4.3.3 United States
- 4.4 Value Chain & Distribution Channel Analysis
5 MARKET SEGMENTATION (includes market size in Value in USD and Volume, Forecasts up to 2030 and analysis of growth prospects)
- 5.1 Form
- 5.1.1 Manure
- 5.1.2 Meal Based Fertilizers
- 5.1.3 Oilcakes
- 5.1.4 Other Organic Fertilizer
- 5.2 Crop Type
- 5.2.1 Cash Crops
- 5.2.2 Horticultural Crops
- 5.2.3 Row Crops
- 5.3 Country
- 5.3.1 Canada
- 5.3.2 Mexico
- 5.3.3 United States
- 5.3.4 Rest of North America
6 COMPETITIVE LANDSCAPE
- 6.1 Key Strategic Moves
- 6.2 Market Share Analysis
- 6.3 Company Landscape
- 6.4 Company Profiles (includes Global Level Overview, Market Level Overview, Core Business Segments, Financials, Headcount, Key Information, Market Rank, Market Share, Products and Services, and Analysis of Recent Developments).
- 6.4.1 BioFert Manufacturing Inc.
- 6.4.2 California Organic Fertilizers Inc.
- 6.4.3 Cascade Agronomics LLC
- 6.4.4 Cedar Grove Composting Inc.
- 6.4.5 E.B.Stone & Sons Inc.
- 6.4.6 Morgan Composting Inc.
- 6.4.7 Sustane Natural Fertilizer Inc.
- 6.4.8 The Espoma Company
- 6.4.9 The Rich Lawn Company LLC
- 6.4.10 Walts Organic Fertilizers Co.
7 KEY STRATEGIC QUESTIONS FOR AGRICULTURAL BIOLOGICALS CEOS
8 APPENDIX
- 8.1 Global Overview
- 8.1.1 Overview
- 8.1.2 Porter's Five Forces Framework
- 8.1.3 Global Value Chain Analysis
- 8.1.4 Market Dynamics (DROs)
- 8.2 Sources & References
- 8.3 List of Tables & Figures
- 8.4 Primary Insights
- 8.5 Data Pack
- 8.6 Glossary of Terms
 富磷有机肥市场:依作物类型、形态、应用通路-2026-2032年全球预测
 全球有机农药市场规模、份额、趋势和成长分析报告(2026-2034年)
 全球有机农药市场,2025-2029年
 全球有机肥料市场,2026-2030年
 有机肥料:市场占有率分析、产业趋势与统计、成长预测(2026-2031)全球有机肥料市场:市场规模、份额、成长率、产业分析、按类型、应用和地区划分的分析、未来预测(2026-2034)
 有机肥料市场规模、份额和成长分析(按来源、作物类型、形态、应用方法和地区划分)-2026-2033年产业预测
 有机农药市场规模、份额和成长分析(按产品类型、品种、剂型、应用和地区划分)-2026-2033年产业预测
 全球有机肥市场:预测(至2032年)-按来源、形态、营养成分、作物类型、施用方法、最终用户和地区进行分析有机农药市场依产品类型、作物类型、配方、施用方法及通路划分-2025-2032年全球预测