


 |
市场调查报告书
商品编码
1687767
氰化钠:市场占有率分析、产业趋势与统计、成长预测(2025-2030 年)Sodium Cyanide - Market Share Analysis, Industry Trends & Statistics, Growth Forecasts (2025 - 2030) |
||||||
※ 本网页内容可能与最新版本有所差异。详细情况请与我们联繫。
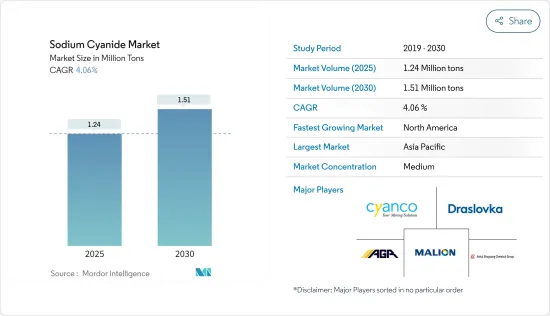
预计 2025 年氰化钠市场规模为 124 万吨,到 2030 年将达到 151 万吨,预测期间(2025-2030 年)的复合年增长率为 4.06%。
COVID-19 对全球氰化钠市场的影响已基本消除,目前市场已恢復至疫情前的水平。
主要亮点
- 从中期来看,加拿大和墨西哥采矿活动的增加以及金矿开采行业的需求是市场成长的主要驱动力。
- 另一方面,氰化钠的毒性和黄金提取替代品的开发阻碍了勘探市场的成长。
- 预计在预测期内,新矿的发现将为市场参与者提供有利可图的机会。
- 亚太地区的采矿活动正在增加,刺激了终端用户行业的强劲需求,从而推动市场成长。
氰化钠市场趋势
采矿业主导市场需求
- 全世界生产的氰化钠大部分用于采矿和冶金,特别是用于提取金和银。氰化钠是最经济可行、最易于加工和环境永续的黄金加工技术之一。
- 通常使用氰化钠浸出方法从矿石中提取黄金。利用工业机械将矿石粉碎成小块。然后将粉末加入氰化钠溶液(NaCN)中进行加工。
- 2022 年,加拿大位列四大黄金生产国之列,仅次于中国、澳洲和俄罗斯。根据美国地质调查局统计,2022年该国产量将达到约220吨,占全球产量的7%左右。产量增加主要由于 Detour Lake 矿、Canadian Malatic 矿、Meadowbank Complex 矿、Meliadyne 矿、Eagle Gold 矿和 Young-Davidson 矿的产量增加。
- 各大矿业公司正在加拿大勘探企业发展,加拿大正在进行多个具有可行性研究的高级计划,以供未来投资。此外,加拿大政府正在采取各种措施吸引更多投资者开发未开发的矿产资源。
- 除北美外,非洲矿产资源丰富,是全球矿业的中心。除采矿业领先的国家南非外,加纳、马利共和国和布吉纳法索等其他国家的采矿业也正在快速成长。
- 由于这些原因,预计预测期内采矿业将主导氰化钠市场。
亚太地区占市场主导地位
- 亚太地区占据全球市场占有率的主导地位。金矿开采和化学工业的强劲需求导致亚太地区(主要是中国)对氰化钠的需求快速增加。
- 中国是最大的黄金生产国,占全球黄金产量的9%左右。据世界黄金协会称,中国矿产黄金产量增加了 42 吨,达到 374 吨,增幅为 13%。继 2021 年大部分时间大规模实施安全停工后,山东省采矿业现已恢復正常。
- 此外,中国是世界第二大铜、矾土、锰、钴和银的生产国。它还生产宝石钻石、铬和木材。
- 预计这些因素将在预测期内推动中国对氰化钠的需求。
- 根据美国地质调查局的报告,2022年澳洲黄金产业开采了320吨黄金,与前一年同期比较增加1.5%。预计该国的产量将很快超过中国,这主要得益于扩张计画。
- 此外,印尼持有丰富的矿产资源,因此政府透过向国内外投资者提供有吸引力的机会来鼓励投资。目标矿物包括金、矾土、铜、银、锡和主要的镍(因为其在电池技术中的应用日益广泛)。
- 因此,由于所有此类应用和地区的需求强劲,预计亚太地区将成为预测期内最大的市场。
氰化钠产业概况
氰化钠市场正在整合,前十大企业占60%以上的产能份额。市场上知名的参与者(不分先后顺序)包括 Cyanco International LLC、Malion New Materials、Draslovka、Australian Gold Reagents Pty Ltd. 和安徽曙光化工集团。
其他福利:
- Excel 格式的市场预测 (ME) 表
- 3 个月的分析师支持
目录
第 1 章 简介
- 调查前提条件
- 研究范围
第二章调查方法
第三章执行摘要
第四章 市场动态
- 驱动程式
- 金矿开采业需求旺盛
- 加拿大和墨西哥采矿活动活性化
- 其他驱动因素
- 限制因素
- 氰化钠毒性
- 开发黄金开采的替代品
- 产业价值链分析
- 波特五力分析
- 供应商的议价能力
- 消费者议价能力
- 新进入者的威胁
- 替代品的威胁
- 竞争程度
第五章 市场区隔
- 最终用户产业
- 矿业
- 化学
- 其他最终用户产业
- 地区
- 亚太地区
- 中国
- 澳洲和纽西兰
- 印尼
- 其他亚太地区
- 北美洲
- 美国
- 加拿大
- 墨西哥
- 欧洲
- 俄罗斯
- 独联体国家(俄罗斯除外)
- 其他欧洲国家
- 南美洲
- 巴西
- 阿根廷
- 秘鲁
- 南美洲其他地区
- 中东和非洲
- 迦纳
- 苏丹
- 南非
- 其他中东和非洲地区
- 亚太地区
第六章 竞争格局
- 併购、合资、合作、协议
- 市场占有率(%)**/排名分析
- 主要企业策略
- 公司简介
- Anhui Shuguang Chemical Group
- Australian Gold Reagents Pty Ltd
- Changsha Hekang Chemical Co. Ltd
- Cyanco International LLC
- Cyplus Gmbh
- Draslovka
- Hebei Chengxin Group Co. Ltd
- Jincheng Hongsheng Chemical Co. Ltd
- Orica Limited
- Taekwang Industrial Co. Ltd
- Tongsuh Petrochemical Corp. Ltd(Asahi Kasei Corporation)
- Unigel
- Ynnovate Sanzheng(Yingkou)Fine Chemicals Co. Ltd
第七章 市场机会与未来趋势
- 发现新矿
The Sodium Cyanide Market size is estimated at 1.24 million tons in 2025, and is expected to reach 1.51 million tons by 2030, at a CAGR of 4.06% during the forecast period (2025-2030).
The impact of COVID-19 on the global sodium cyanide market was largely negated, and the market now reached the pre-pandemic levels.
Key Highlights
- Over the medium term, the major factors driving the studied market's growth are the increasing mining activities in Canada and Mexico and the demand from the gold mining industry.
- On the flip side, the toxicity of sodium cyanide and the development of substitutes for gold extraction hampers the growth of the market studied.
- The discovery of new mines is projected to offer lucrative opportunities to the market players during the forecast period.
- Due to the growing mining activities in the region, Asia-Pacific dominated the market, and robust demand from the end-user industry fuelled the growth.
Sodium Cyanide Market Trends
Mining Segment to Dominate the Market Demand
- A major portion of the sodium cyanide produced worldwide is used in mining and metallurgy, especially in extracting gold and silver. It is one of the most economically viable, easily processable, and environmentally sustainable technologies for gold processing.
- Typically, gold is extracted from its ore using sodium cyanide through leeching. The ore is crushed into a fine powder using industrial machinery. Then, the dust is added to a sodium cyanide solution (NaCN) and allowed to process.
- Canada is among the top four gold producers in 2022, behind China, Australia, and Russia. As per the USGS statistics, the country's production stood at around 220 tons in 2022, representing around 7% of global production. The production growth was mainly due to increased output at the Detour Lake, Canadian Malartic, Meadowbank Complex, Meliadine, Eagle Gold, and Young-Davidson mines.
- Various large mining companies are seeking exposure in Canada, and several advanced projects with feasibility studies are taking place in the country for future investment. Moreover, the Government of Canada is taking various initiatives to attract more investors to develop untapped mineral resources.
- Apart from the North American region, Africa contains abundant mineral sources, making it a hub for the global mining industry. Apart from South Africa, a major mining industry, countries like Ghana, Mali, and Burkina Faso, include rapidly growing mining industries.
- All the above reasons are responsible for the mining segment to dominate the sodium cyanide market in the forecast period.
Asia-Pacific Region to Dominate the Market
- The Asia-Pacific region dominated the global market share. With the robust demand from the gold extraction and chemical industry, the demand for sodium cyanide in Asia-Pacific, primarily in China, increased faster.
- China is the largest producer of gold, with a share of about 9% of the total gold produced worldwide. According to the World Gold Council, mine production in China increased by 42 tons (13%) to 374 tons. It is because mining in Shandong province returned to normal following widespread safety stoppages for most of 2021.
- Besides, China is the second-largest producer of copper, bauxite, manganese, cobalt, and silver. It also produces gem diamonds, chromium, and timber.
- Such factors will likely boost the demand for sodium cyanide in China during the forecast period.
- According to the USGS Report, Australia's gold industry produced 320 tons of mined gold in 2022, up by 1.5% year-on-year. The country is estimated to overgrow China in production shortly, primarily due to the expansion plans.
- Moreover, as Indonesia holds immense mineral reserves, the government is promoting investments by offering domestic and foreign investors attractive opportunities. Some of the target minerals include gold, bauxite, copper, silver, tin, and, majorly, nickel (owing to its growing applications in battery technology).
- Hence, with all such applications and robust demand in the region, Asia-Pacific is expected to be the largest market during the forecast period.
Sodium Cyanide Industry Overview
The sodium cyanide market is consolidated, with the top 10 players accounting for over 60% of the share in production capacities. Some of the noticeable players in the market (not in any particular order) include Cyanco International LLC, Malion New Materials, Draslovka, Australian Gold Reagents Pty Ltd., and Anhui Shuguang Chemical Group.
Additional Benefits:
- The market estimate (ME) sheet in Excel format
- 3 months of analyst support
TABLE OF CONTENTS
1 INTRODUCTION
- 1.1 Study Assumptions
- 1.2 Scope of the Study
2 RESEARCH METHODOLOGY
3 EXECUTIVE SUMMARY
4 MARKET DYNAMICS
- 4.1 Drivers
- 4.1.1 High Demand from the Gold Mining Industry
- 4.1.2 Increasing Mining Activities in Canada and Mexico
- 4.1.3 Other Drivers
- 4.2 Restraints
- 4.2.1 Toxicity of Sodium Cyanide
- 4.2.2 Development of Substitute for Gold Extraction
- 4.3 Industry Value Chain Analysis
- 4.4 Porter's Five Forces Analysis
- 4.4.1 Bargaining Power of Suppliers
- 4.4.2 Bargaining Power of Consumers
- 4.4.3 Threat of New Entrants
- 4.4.4 Threat of Substitute Products and Services
- 4.4.5 Degree of Competition
5 MARKET SEGMENTATION
- 5.1 End-user Industry
- 5.1.1 Mining
- 5.1.2 Chemical
- 5.1.3 Other End-user Industries
- 5.2 Geography
- 5.2.1 Asia-Pacific
- 5.2.1.1 China
- 5.2.1.2 Australia & New Zealand
- 5.2.1.3 Indonesia
- 5.2.1.4 Rest of Asia-Pacific
- 5.2.2 North America
- 5.2.2.1 United States
- 5.2.2.2 Canada
- 5.2.2.3 Mexico
- 5.2.3 Europe
- 5.2.3.1 Russia
- 5.2.3.2 CIS Countries (Excluding Russia)
- 5.2.3.3 Rest of Europe
- 5.2.4 South America
- 5.2.4.1 Brazil
- 5.2.4.2 Argentina
- 5.2.4.3 Peru
- 5.2.4.4 Rest of South America
- 5.2.5 Middle-East and Africa
- 5.2.5.1 Ghana
- 5.2.5.2 Sudan
- 5.2.5.3 South Africa
- 5.2.5.4 Rest of Middle-East and Africa
- 5.2.1 Asia-Pacific
6 COMPETITIVE LANDSCAPE
- 6.1 Mergers and Acquisitions, Joint Ventures, Collaborations, and Agreements
- 6.2 Market Share(%)**/Ranking Analysis
- 6.3 Strategies Adopted by Leading Players
- 6.4 Company Profiles
- 6.4.1 Anhui Shuguang Chemical Group
- 6.4.2 Australian Gold Reagents Pty Ltd
- 6.4.3 Changsha Hekang Chemical Co. Ltd
- 6.4.4 Cyanco International LLC
- 6.4.5 Cyplus Gmbh
- 6.4.6 Draslovka
- 6.4.7 Hebei Chengxin Group Co. Ltd
- 6.4.8 Jincheng Hongsheng Chemical Co. Ltd
- 6.4.9 Orica Limited
- 6.4.10 Taekwang Industrial Co. Ltd
- 6.4.11 Tongsuh Petrochemical Corp. Ltd (Asahi Kasei Corporation)
- 6.4.12 Unigel
- 6.4.13 Ynnovate Sanzheng (Yingkou) Fine Chemicals Co. Ltd
7 MARKET OPPORTUNITIES AND FUTURE TRENDS
- 7.1 Discovery of New Mines
 氰化钠市场-2025-2030年预测
 固体氰化钠:全球市占率及排名、总收入及需求预测(2025-2031年)
 非洲氰化钠市场 -市场占有率分析、行业趋势和统计、成长预测(2025-2030 年)
 全球固体氰化钠市场(2025 年)
 氰化钠市场:依产品类型、依最终用户、按地区
 氰化钠市场规模、份额和成长分析(按产品类型、垂直产业、销售管道和地区)- 产业预测,2025-2032 年
 氰化钠市场机会、成长动力、产业趋势分析及 2025 - 2034 年预测
 氰化钠的全球市场,实际成果与预测(2019年~2030年)全球氰化钠市场研究报告 - 2024 年至 2032 年产业分析、规模、份额、成长、趋势和预测