


 |
市场调查报告书
商品编码
1689870
欧洲电动自行车市场占有率分析、产业趋势与统计、成长预测(2025-2030)Europe E-bike - Market Share Analysis, Industry Trends & Statistics, Growth Forecasts (2025 - 2030) |
||||||
价格
※ 本网页内容可能与最新版本有所差异。详细情况请与我们联繫。
简介目录
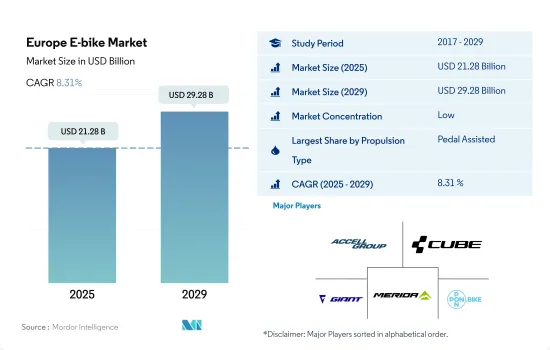
预计 2025 年欧洲电动自行车市场规模为 212.8 亿美元,到 2029 年将达到 292.8 亿美元,预测期内(2025-2029 年)的复合年增长率为 8.31%。
推进系统细分市场概览
- 2022 年该地区共售出约 2,600 万辆电动自行车,而 2021 年总合2,400 万辆。电动城市/都市自行车、电动健行自行车和电动登山车是最受欢迎的公司,占全国电动自行车总销量的近 94%。推动电动自行车市场销售的关键因素包括创新的产品功能、电池和驱动装置的完全整合、有吸引力的设计以及高品质材料的使用。
- 荷兰是继德国之后欧洲第二大电动自行车市场。 2022年全国电动自行车销量约55万辆,较上年的约50万辆略有成长。虽然与去年相比,全国电动自行车销量增加,但并没有出现太大的变化。这是因为共享单车和换车等做法影响了新车的销售量。
- 欧洲国家采用电动自行车的主要原因包括健康益处、环境效益、减少开支、避免交通拥堵以及年轻人对电动自行车作为运动器材的需求不断增长。预计所有这些因素都将在预测期内推动市场成长。
欧洲各国市场
欧洲电动自行车市场趋势
德国以其极高的普及率脱颖而出,显示其市场成熟且消费者支持度大。
- 近年来,欧洲对电动自行车的需求大幅增加。燃油价格上涨、尖峰时段交通拥堵和运动好处是推动英国、义大利、西班牙和德国等欧洲国家电动自行车普及率上升的一些因素。丹麦占据电动自行车销量的大部分,2019 年的普及率高于该地区的其他国家,例如卢森堡。电动自行车需求的不断增长进一步加速了其在整个欧洲的普及率。
- 新冠疫情病例的增加对自行车业务产生了积极影响。由于人们为了保持社交距离而避免使用公共和租赁交通工具,他们改变了通勤方式,并投资购买电动自行车作为一种方便且经济实惠的选择。这些因素导致2020年欧洲各地电动自行车的普及率加速上升。
- 商业活动的恢復以及门锁和贸易活动等限制的放宽促进了电动自行车的普及,并活性化了该地区的进出口活动。预计消费者对电动自行车的兴趣日益浓厚,将在预测期内推动该地区电动自行车的普及。
特别是在比利时和荷兰,5至15公里之间的通勤距离稳定增加,反映了高效率的交通途径和城市规划。
- 欧洲有许多自行车友善国家,例如荷兰、波兰和英国。这些国家最近对自行车的需求不断增长。欧洲人越来越多地使用自行车进行短途通勤(5-15公里)和前往附近地区,包括企业和市场。在欧洲,比利时是通勤距离目的地 5-15 公里以内的人口比例最高的国家。
- 2020 年新冠疫情改变了人们对骑自行车作为安全且隔离的交通途径的看法。 2021年,每天出游5至15公里的通勤人数将增加0.3%,因为人们在疫情期间选择骑自行车作为理想的运动方式,或是在週末在附近悠閒地骑自行车。每天通勤距离 5-15 公里的消费者对配备尖端电池组、续航里程可达 40-45 公里的电动自行车很感兴趣。
- 在这个地区,许多人经常骑自行车上班,工作地点位于 5-15 公里半径范围内。在英国、德国、荷兰和挪威等已开发国家,骑自行车上班越来越普遍。主要原因是它更健康、碳排放更低、更省油、节省旅行时间。预计这些因素将在预测期内增加欧洲每天通勤距离在 5 至 15 公里之间的人数。
欧洲电动自行车产业概况
欧洲电动自行车市场较为分散,前五大公司占18.14%的市场。市场的主要企业有:Accell Group、CUBE Bikes、Giant Manufacturing、Merida Industry 和 Pon Holding BV(按字母顺序排列)。
其他福利
- Excel 格式的市场预测 (ME) 表
- 3个月的分析师支持
目录
第一章执行摘要和主要发现
第二章 报告要约
第三章 引言
- 研究假设和市场定义
- 研究范围
- 调查方法
第四章 产业主要趋势
- 自行车销量
- 人均GDP
- 通货膨胀率
- 电动自行车普及率
- 每天出游 5 至 15 公里的人口/通勤者百分比
- 自行车租赁
- 电动自行车电池价格
- 电池化学价格表
- 超本地化配送
- 自行车道
- 徒步人数
- 电池充电容量
- 交通拥堵指数
- 法律规范
- 价值炼和通路分析
第五章市场区隔
- 推进类型
- 踏板辅助
- 高速电动自行车
- 油门辅助
- 应用程式类型
- 货运/多用途
- 城市/城区
- 健行
- 电池类型
- 铅酸电池
- 锂离子电池
- 其他的
- 原产地
- 奥地利
- 比利时
- 捷克共和国
- 法国
- 德国
- 义大利
- 卢森堡
- 荷兰
- 波兰
- 西班牙
- 瑞士
- 英国
- 其他欧洲国家
第六章竞争格局
- 关键策略趋势
- 市场占有率分析
- 商业状况
- 公司简介
- Accell Group
- Brompton Bicycle
- CUBE Bikes
- Fritzmeier Systems GmbH & Co. KG(M1 Sporttechnik)
- Giant Manufacturing Co. Ltd.
- Kalkhoff Werke GmbH
- KTM Bike Industries
- Merida Industry Co. Ltd
- Pedego Electric Bikes
- Pon Holding BV
- Riese & Muller
- Royal Dutch Gazelle
- Swiss E-Mobility Group(SEMG)
- Trek Bicycle Corporation
- VanMoof BV
- Volt Electric Bikes
- Yamaha Bicycles
第七章:CEO面临的关键策略问题
第 8 章 附录
- 世界概况
- 概述
- 五力分析框架
- 全球价值链分析
- 市场动态(DRO)
- 资讯来源及延伸阅读
- 图片列表
- 关键见解
- 资料包
- 词彙表
简介目录
Product Code: 69010
The Europe E-bike Market size is estimated at 21.28 billion USD in 2025, and is expected to reach 29.28 billion USD by 2029, growing at a CAGR of 8.31% during the forecast period (2025-2029).
PROPULSION SEGMENT MARKET OVERVIEW
- A total of around 26 million units of electric bicycles were sold in the region in 2022, compared to around 24 million units of bikes in 2021. E-city/urban, e-trekking, and e-MTB bikes were the most preferred companies, occupying nearly 94% of all the e-bike sales in the country. Some of the major factors driving the sales of the e-bike market are the innovative character of the product, fully integrated batteries and drives, appealing designs, and the use of high-quality materials.
- After Germany, the Netherlands is the second-largest e-bike market in Europe. In 2022, the country witnessed a sale of nearly 0.55 million e-bikes, which was a slight increase compared to the previous year, which recorded nearly 0.5 million unit sales. Though the volume of e-bikes in the country increased as compared to last year, it was not a considerable change. This can be attributed to the fact that new bike sales were affected by practices, such as bike-sharing systems and swap bikes.
- Some of the major reasons considered for adopting e-bikes in European countries are the health benefits, environmental benefits, reduction in expenditure, avoidance of traffic congestion, and rise in demand for e-bikes as sports equipment among youth. . All these factors are expected to help the market growth over the forecast period.
EUROPE COUNTRY LEVEL MARKET OVERVIEW
Europe E-bike Market Trends
Germany stands out with its notably high adoption rates, indicating a mature market and strong consumer acceptance
- Europe has witnessed a significant demand for e-bicycles over the past few years. Rising fuel prices, traffic jams during peak hours, and exercise benefits are some of the factors responsible for the increasing adoption rate of e-bikes in European countries, such as the United Kingdom, Italy, Spain, and Germany. Denmark accounted for the major share of e-bike sales and had a higher adoption rate in 2019 than other countries in the region, such as Luxembourg. The growing demand for e-bikes further accelerated their adoption rate across Europe.
- The growing number of COVID-19 cases affected the bicycle business positively. As people avoided public or rented transportation to maintain social distancing, they changed their commuting methods and invested in e-bikes as a convenient and price-friendly option. Such factors accelerated the adoption rate of e-bikes in 2020 across Europe.
- The resumption of business operations and the relaxation of restrictions, such as lockdowns and trade activities, boosted the adoption of e-bikes and increased the import and export activities in the region. The growing consumer interest in e-bikes is expected to increase their adoption in the region during the forecast period.
Steady growth in 5-15 km commutes, especially in Belgium and the Netherlands, reflects efficient transportation and urban planning
- Europe has many bicycle-friendly countries, including the Netherlands, Poland, and the United Kingdom. The demand for bicycles has grown recently in these countries. People in Europe are gradually shifting toward bicycles for shorter commutes (5-15 km) or trips to neighboring areas, including businesses and markets. Belgium has the highest percentage of daily commuters within 5-15 km in Europe.
- The COVID-19 pandemic in 2020 changed people's perceptions of bicycles as a secure, isolating means of transportation. People chose bicycles as an ideal form of exercise during the pandemic or engaged in weekend leisurely rides to neighboring areas, thus increasing the number of commuters with a daily travel distance of 5-15 km by 0.3% in 2021. Consumers commuting a daily distance of 5-15 km per day were drawn to e-bikes with their cutting-edge battery packs that offer an increased range of up to 40-45 km.
- Many people in the region regularly commute by bicycle to their places of employment within 5-15 km. Bicycle commuting is increasingly common in developed countries like the United Kingdom, Germany, Netherlands, and Norway, largely because it is healthy, carbon-free, fuel-efficient, and saves time in traffic. During the forecast period, these factors are anticipated to accelerate the number of commuters traveling a daily distance of 5-15 km across Europe.
Europe E-bike Industry Overview
The Europe E-bike Market is fragmented, with the top five companies occupying 18.14%. The major players in this market are Accell Group, CUBE Bikes, Giant Manufacturing Co. Ltd., Merida Industry Co. Ltd and Pon Holding B.V. (sorted alphabetically).
Additional Benefits:
- The market estimate (ME) sheet in Excel format
- 3 months of analyst support
TABLE OF CONTENTS
1 EXECUTIVE SUMMARY & KEY FINDINGS
2 REPORT OFFERS
3 INTRODUCTION
- 3.1 Study Assumptions & Market Definition
- 3.2 Scope of the Study
- 3.3 Research Methodology
4 KEY INDUSTRY TRENDS
- 4.1 Bicycle Sales
- 4.2 GDP Per Capita
- 4.3 Inflation Rate
- 4.4 Adoption Rate Of E-bikes
- 4.5 Percent Population/commuters With 5-15 Km Daily Travel Distance
- 4.6 Bicycle Rental
- 4.7 E-bike Battery Price
- 4.8 Price Chart Of Different Battery Chemistry
- 4.9 Hyper-local Delivery
- 4.10 Dedicated Bicycle Lanes
- 4.11 Number Of Trekkers
- 4.12 Battery Charging Capacity
- 4.13 Traffic Congestion Index
- 4.14 Regulatory Framework
- 4.15 Value Chain & Distribution Channel Analysis
5 MARKET SEGMENTATION (includes market size in Value in USD and Volume, Forecasts up to 2029 and analysis of growth prospects)
- 5.1 Propulsion Type
- 5.1.1 Pedal Assisted
- 5.1.2 Speed Pedelec
- 5.1.3 Throttle Assisted
- 5.2 Application Type
- 5.2.1 Cargo/Utility
- 5.2.2 City/Urban
- 5.2.3 Trekking
- 5.3 Battery Type
- 5.3.1 Lead Acid Battery
- 5.3.2 Lithium-ion Battery
- 5.3.3 Others
- 5.4 Country
- 5.4.1 Austria
- 5.4.2 Belgium
- 5.4.3 Czech Republic
- 5.4.4 France
- 5.4.5 Germany
- 5.4.6 Italy
- 5.4.7 Luxembourg
- 5.4.8 Netherlands
- 5.4.9 Poland
- 5.4.10 Spain
- 5.4.11 Switzerland
- 5.4.12 UK
- 5.4.13 Rest-of-Europe
6 COMPETITIVE LANDSCAPE
- 6.1 Key Strategic Moves
- 6.2 Market Share Analysis
- 6.3 Company Landscape
- 6.4 Company Profiles
- 6.4.1 Accell Group
- 6.4.2 Brompton Bicycle
- 6.4.3 CUBE Bikes
- 6.4.4 Fritzmeier Systems GmbH & Co. KG (M1 Sporttechnik)
- 6.4.5 Giant Manufacturing Co. Ltd.
- 6.4.6 Kalkhoff Werke GmbH
- 6.4.7 KTM Bike Industries
- 6.4.8 Merida Industry Co. Ltd
- 6.4.9 Pedego Electric Bikes
- 6.4.10 Pon Holding B.V.
- 6.4.11 Riese & Muller
- 6.4.12 Royal Dutch Gazelle
- 6.4.13 Swiss E-Mobility Group (SEMG)
- 6.4.14 Trek Bicycle Corporation
- 6.4.15 VanMoof BV
- 6.4.16 Volt Electric Bikes
- 6.4.17 Yamaha Bicycles
7 KEY STRATEGIC QUESTIONS FOR E BIKES CEOS
8 APPENDIX
- 8.1 Global Overview
- 8.1.1 Overview
- 8.1.2 Porter's Five Forces Framework
- 8.1.3 Global Value Chain Analysis
- 8.1.4 Market Dynamics (DROs)
- 8.2 Sources & References
- 8.3 List of Tables & Figures
- 8.4 Primary Insights
- 8.5 Data Pack
- 8.6 Glossary of Terms
02-2729-4219
+886-2-2729-4219
 全球电动自行车市场:依类别、马达类型、电池类型、应用类型、地区、机会及预测,2018-2032
 山地电动自行车市场-全球产业规模、份额、趋势、机会和预测,按电池、类型、应用、地区和竞争细分,2020-2030 年
 全球电动自行车订阅平台市场
 电动自行车市场规模、份额及成长分析(按类别、速度、电池类型、马达类型、模式、组件、应用、所有权类型、电池容量、马达重量、马达功率及地区)-2025-2032 年产业预测
 2032 年 Speed Pedelec 电动自行车市场预测:按电池类型、组件、额定速度、马达类型、骑乘者类型、应用和地区进行全球分析
 日本电动自行车市场报告,按推进类型(踏板辅助、高速电动自行车、油门辅助)、应用类型(货运/多用途、城市/都市、健行)、电池类型(铅酸电池、锂离子电池等)和地区划分,2025 年至 2033 年
 2025年全球电动自行车市场报告
 全球电动自行车订阅平台市场:产业分析、规模、份额、成长、趋势与预测(2025-2032 年)
 Speed Pedelec 电动自行车:市场占有率分析、产业趋势与统计、成长预测(2025-2029 年)中东电动自行车:市场占有率分析、产业趋势与统计、成长预测(2025-2029 年)
▼