


 |
市场调查报告书
商品编码
1693521
控制释放肥料:市场占有率分析、产业趋势与统计、成长预测(2025-2030)Controlled Release Fertilizer - Market Share Analysis, Industry Trends & Statistics, Growth Forecasts (2025 - 2030) |
||||||
※ 本网页内容可能与最新版本有所差异。详细情况请与我们联繫。
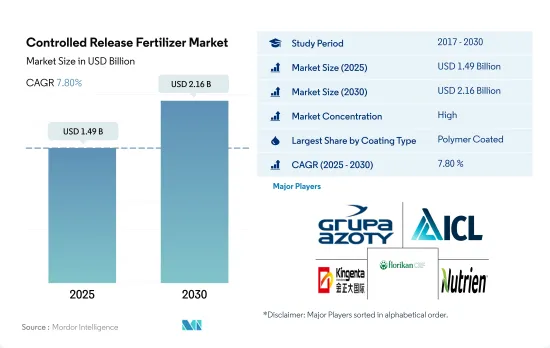
预计控制释放肥料市场规模在 2025 年将达到 14.9 亿美元,到 2030 年预计将达到 21.6 亿美元,预测期内(2025-2030 年)的复合年增长率为 7.80%。
农业产业面临越来越大的压力,需要减少农业实践对环境的影响,同时提高营养效率和精准应用,这将推动市场的发展。
- 2022年控制释放肥料在特种肥料市场的价值份额为3.0%。随着农业部门对环境影响的减少压力越来越大,控释肥料市场即将成长。其高营养效率和精确的施用方法预计将推动2023年至2030年期间的复合年增长率达到7.6%。
- 聚合物包膜肥料在减少养分流失方面发挥着重要作用,养分流失是指由于过量降雨或灌溉导致养分从根区被冲走的过程。在研究期间,聚合物包衣肥料的市场规模预计将激增 120.6%,到 2022 年将占据 76.3% 的主导市场占有率。然而,2020 年,由于新冠疫情封锁引发的供应链中断,全球市场遭遇挫折。
- 2022 年,聚合物硫包衣肥料将占据第二大市场占有率,为 18.4%,相当于整个控释肥市场的 2.816 亿美元。透过精密农业等先进技术和施用控制释放肥料等专用肥料来提高产量的力度不断加大,可望推动聚合物硫包膜性肥料市场的发展。预计 2023 年至 2030 年期间聚合物硫包膜性肥料市场的复合年增长率将达到 7.3%。
- 2022年,「其他控释肥」占控制释放肥总量的5.3%。该领域包括各种涂料,预计从 2023 年到 2030 年,其产量复合年增长率将达到 4.3%。这是因为人们对生物分解性包覆肥料的偏好日益增长,而且日益增长的环境问题也推动了它们的采用。
美国拥有最大的市场占有率,并且拥有最大的田间作物。
- 北美在全球控制释放肥料市场占据主导地位。在该地区,美国是控制释放肥料最大的市场,2022 年占据 69.0% 的市场占有率。
- 欧洲在全球控制释放肥料市场占有第二大份额。法国所占份额最大,为22.4%,其次是英国。
- 亚太地区是全球第三大控制释放肥料区域市场。中国在亚太控制释放肥市场占据主导地位,2022 年约占 42.1% 的市场占有率。在中国,聚合物包膜性肥料在控制释放肥料市场占有最高份额,其次是聚合物硫包膜性肥料。 2017 年聚合物包膜性肥料市场价值为 3,030 万美元,预计到 2030 年底将达到 9,720 万美元。
- 控制释放尿素是全球最常使用的控释肥料。氮损失是稻农面临的主要问题之一,水稻的氮利用效率通常较低。这是由于氮透过挥发、淋溶和反硝化作用大量损失所致。提高氮利用效率的一种方法是使用控制释放尿素。控制释放尿素在减少氮损失、促进植物生长、增加氮浓度和增加偏好方面通常优于颗粒尿素肥料。
- 预计控制释放肥料效率的提升将在 2023 年至 2030 年期间推动全球市场的发展。
全球控制释放肥料市场趋势
为了满足日益增长的粮食需求,农业面临的压力越来越大,预计将导致全球田间作物种植面积增加。
- 全球农业部门面临许多挑战。根据联合国预测,到 2050 年,世界人口可能超过 90 亿。人口成长可能对农业造成过度压力,而由于劳动力短缺和都市化进程加剧导致农地面积减少,农业产量已经下降。根据联合国粮食及农业组织预测,2050年,全球70%的人口预计将居住在城市。随着全球可耕地面积减少,农民需要使用更多的肥料来提高作物产量。
- 亚太地区是世界上最大的农产品生产地区。农业对该地区的经济至关重要,约占总劳动力的 20%。该地区以田间作物种植为主,约占全部区域作物总面积的95%以上。水稻、小麦和玉米是该地区的主要田间作物,约占2022年总耕地面积的24.3%。
- 北美洲是世界上第二大可耕地。该农场种植多种作物,主要为田间作物。尤其是玉米、棉花、稻米、大豆和小麦,都是美国农业部强调的主要田间作物。 2022年,美国占北美作物种植面积的46.2%。然而,2017年至2019年期间,该国作物种植面积大幅下降,主要原因是恶劣的环境条件导致德克萨斯和休士顿等地区发生严重洪灾。
全球田间作物氮、钾、磷等主要养分平均施用量为164.31公斤/公顷。
- 就主要营养消费量而言,玉米、油菜籽、棉花、高粱、水稻、小麦和大豆是世界上主要的作物。这些田间作物的主要养分施用量分别为 230.57 公斤/公顷、255.75 公斤/公顷、172.70 公斤/公顷、158.46 公斤/公顷、154.49 公斤/公顷、135.35 公斤/公顷和 120.97 公斤/公顷。主要营养素对作物至关重要,因为它们在植物的代谢过程中发挥关键作用,并有助于细胞、细胞膜和叶绿素等组织的形成。磷对于种植优质作物至关重要,而钾可以激活植物生长发育所必需的酵素。
- 全球田间作物氮、钾、磷的平均施用量为164.31公斤/公顷。氮肥是田间作物使用最广泛的基肥。其施用率为 224.6 公斤/公顷,其次是钾肥,施用率为 150.3 公斤/公顷,磷肥是第三大消耗肥料,2022 年施用率为 117.9 公斤/公顷。
- 2022年,氮肥施用量最高的是油菜籽,为347.4公斤/公顷。同样,玉米的磷施用量最高,为156.3公斤/公顷,而油菜的钾施用量最高,为248.6公斤/公顷。
- 全球田间作物种植面积不断增加,尤其是南美洲和亚太国家。这些都是不断成长的肥料市场。由于其高效性,特种肥料被广泛应用于欧洲和北美等已开发地区以及营养缺乏现象普遍存在的中东和非洲其他地区。预计这些因素将在 2023 年至 2030 年期间推动全球初级营养肥料市场的发展。
控制释放肥料产业概况
控制释放肥市场格局较为集中,前五大企业占77.38%的市占率。市场的主要企业包括 Grupa Azoty SA (Compo Expert)、ICL Group Ltd、Kingenta Ecological Engineering Group、New Mountain Capital (Florikan) 和 Nutrien Ltd。
其他福利
- Excel 格式的市场预测 (ME) 表
- 3个月的分析师支持
目录
第一章执行摘要和主要发现
第二章 报告要约
第三章 引言
- 研究假设和市场定义
- 研究范围
- 调查方法
第四章 产业主要趋势
- 主要作物种植面积
- 田间作物
- 园艺作物
- 平均养分施用量
- 主要营养素
- 田间作物
- 园艺作物
- 主要营养素
- 法律规范
- 价值炼和通路分析
第五章市场区隔
- 涂层类型
- 聚合物涂层
- 聚合物硫涂层
- 其他的
- 作物类型
- 田间作物
- 园艺作物
- 草坪和观赏植物
- 地区
- 亚太地区
- 澳洲
- 孟加拉
- 中国
- 印度
- 印尼
- 日本
- 巴基斯坦
- 菲律宾
- 泰国
- 越南
- 其他亚太地区
- 欧洲
- 法国
- 德国
- 义大利
- 荷兰
- 俄罗斯
- 西班牙
- 乌克兰
- 英国
- 其他欧洲国家
- 中东和非洲
- 奈及利亚
- 沙乌地阿拉伯
- 南非
- 土耳其
- 其他中东和非洲地区
- 北美洲
- 加拿大
- 墨西哥
- 美国
- 北美其他地区
- 南美洲
- 阿根廷
- 巴西
- 南美洲其他地区
- 亚太地区
第六章竞争格局
- 关键策略趋势
- 市场占有率分析
- 商业状况
- 公司简介
- Ekompany International BV(DeltaChem)
- Grupa Azoty SA(Compo Expert)
- Haifa Group
- ICL Group Ltd
- Kingenta Ecological Engineering Group Co., Ltd.
- Mivena BV
- New Mountain Capital(Florikan)
- Nutrien Ltd.
第七章:CEO面临的关键策略问题
第 8 章 附录
- 世界概况
- 概述
- 五力分析框架
- 全球价值链分析
- 市场动态(DRO)
- 资讯来源及延伸阅读
- 图片列表
- 关键见解
- 数据包
- 词彙表
The Controlled Release Fertilizer Market size is estimated at 1.49 billion USD in 2025, and is expected to reach 2.16 billion USD by 2030, growing at a CAGR of 7.80% during the forecast period (2025-2030).
The rising pressure on the agriculture industry to reduce the environmental impact of farming practices and the high nutrient efficiency and precise application will drive the market
- In 2022, control-release fertilizers held a 3.0% value share of the specialty fertilizer market. With mounting pressure on the agriculture sector to minimize environmental impact, the market for control release fertilizers is poised for growth. Their high nutrient efficiency and precise application methods are projected to drive a 7.6% value CAGR from 2023 to 2030.
- Polymer-coated fertilizers play a crucial role in curbing nutrient leaching, a process where excessive rainfall or irrigation washes away nutrients from the root zone. During the study period, the market value of polymer-coated fertilizers surged by 120.6%, capturing a dominant 76.3% market share in 2022. However, the global market faced a setback in 2020 due to supply chain disruptions triggered by the COVID-19 lockdown.
- The polymer-sulfur-coated fertilizers hold the second-largest market share of 18.4% in 2022, worth USD 281.6 million of the overall CRF market. The increasing efforts to enhance production through advanced techniques such as precision farming and dosing of specialty fertilizers, including controlled-release fertilizers, are expected to boost the market for polymers with sulfur-coated fertilizers. The market for polymer-sulfur-coated fertilizers is likely to record a CAGR of 7.3% during 2023-2030.
- In 2022, "other CRFs" constituted 5.3% of the total controlled-release fertilizer market. This segment, encompassing various coatings, is anticipated to witness a 4.3% CAGR in volume from 2023 to 2030. The upswing is attributed to the growing preference for biodegradable coated fertilizers and heightened environmental concerns driving their adoption.
The United States accounted for the largest market share, with field crops accounting for a higher cultivation area
- North America dominates the global controlled-release fertilizer market. In the region, the United States is the largest market for controlled-release fertilizers, accounting for 69.0% of the market share in 2022.
- Europe occupied the second-largest share in the global controlled-release fertilizer market. The controlled-release fertilizer market in Europe is observed to have notably stable growth across all countries in the region, with France occupying the largest share of 22.4%, followed by the United Kingdom for the year 2022.
- The Asia-Pacific is the third-largest regional market for controlled-release fertilizers globally. China dominates the APAC controlled-release fertilizers market, accounting for about 42.1% of the market share in 2022. In China, polymer-coated fertilizers recorded the highest share in the controlled-release fertilizers market, followed by polymer sulfur-coated fertilizers. The polymer-coated fertilizers segment was valued at USD 30.3 million in 2017 and is anticipated to reach USD 97.2 million by the end of 2030.
- Controlled-release urea is the most commonly used form of CRF in the world. Nitrogen loss is one of the main problems faced by rice farmers, and the efficiency of nitrogen utilization in rice is often inadequate. This is due to the large loss of nitrogen due to volatilization, leaching, and denitrification. One way to improve nitrogen efficiency is to use controlled-release urea. Controlled-release urea generally outperforms granular urea fertilizers in reducing nitrogen loss, stimulating plant growth, and increasing nitrogen concentration, thus boosting its preference.
- The increased efficiency of controlled-release fertilizers is anticipated to drive the global market from 2023 to 2030.
Global Controlled Release Fertilizer Market Trends
Rising pressure on the agriculture industry to meet the growing demand for food is expected to increase the area under field crop cultivation globally
- The global agricultural sector is facing many challenges. According to the UN, the world population may exceed 9 billion by 2050. This population growth may overburden the agricultural industry, which is already experiencing an output loss due to a lack of laborers and the shrinkage of agricultural fields caused by rising urbanization. According to the Food and Agriculture Organization, 70% of the global population is expected to live in cities by 2050. Due to the global loss of arable land, farmers now need to utilize more fertilizers to increase crop yields.
- Asia-Pacific is the world's largest producer of agricultural products. Agriculture is critical to the region's economy, as it employs about 20% of the total available workforce. Field crop cultivation dominates the region, accounting for about more than 95% of the total crop area in the region. Rice, wheat, and corn are the major field crops produced in the region, together accounting for about 24.3% of the total crop area in 2022.
- North America ranks as the second-largest arable region globally. Its farms cultivate a diverse range of crops, with a focus on field crops. Notably, corn, cotton, rice, soybean, and wheat are the prominent field crops, as highlighted by the USDA. In 2022, the United States accounted for 46.2% of North America's crop cultivation area. However, the country witnessed a significant drop in crop acreage between 2017 and 2019, primarily due to adverse environmental conditions, leading to severe flooding in regions like Texas and Houston.
The global average application rate of primary nutrients like nitrogen, potassium, and phosphorus in field crops is 164.31 kg/ha
- Corn/maize, rapeseed/canola, cotton, sorghum, rice, wheat, and soybean are some of the major crops worldwide in terms of consumption of primary nutrients. The primary nutrient application rates for these field crops are 230.57 kg/ha, 255.75 kg/ha, 172.70 kg/ha, 158.46 kg/ha, 154.49 kg/ha, 135.35 kg/ha, and 120.97 kg/ha, respectively. Primary nutrient fertilizers are crucial for crops because they play an essential role in plant metabolic processes and assist in forming tissues such as cells, cell membranes, and chlorophyll. Phosphorus is essential for growing high-quality crops, while potassium activates the enzymes needed for plant growth and development.
- The global average application rate of nitrogen, potassium, and phosphorus in field crops is 164.31 kg/ha. Nitrogen is the most widely used primary nutrient fertilizer used in field crops. It accounted for an application rate of 224.6 kg/hectare, followed by potassic fertilizers with 150.3 kg/hectare, and phosphorus as the third-most consumed fertilizer with an application rate of 117.9 kg/hectare in 2022.
- In 2022, the nitrogen application rate was highest in rapeseed, amounting to 347.4 kg/hectare. Similarly, the phosphorus application rate was the highest in corn, at 156.3 kg/hectare, while the potassium application rate was highest in canola, at 248.6 kg/hectare.
- Global field crop cultivation area is increasing, particularly in South American and Asia-Pacific countries. These are the growing markets for fertilizers. Due to their efficiency, specialty fertilizers are widely used in developed regions such as Europe and North America, as well as other regions with widespread nutrient deficiencies. These factors are anticipated to drive the global primary nutrient fertilizers market between 2023 and 2030.
Controlled Release Fertilizer Industry Overview
The Controlled Release Fertilizer Market is fairly consolidated, with the top five companies occupying 77.38%. The major players in this market are Grupa Azoty S.A. (Compo Expert), ICL Group Ltd, Kingenta Ecological Engineering Group Co., Ltd., New Mountain Capital (Florikan) and Nutrien Ltd. (sorted alphabetically).
Additional Benefits:
- The market estimate (ME) sheet in Excel format
- 3 months of analyst support
TABLE OF CONTENTS
1 EXECUTIVE SUMMARY & KEY FINDINGS
2 REPORT OFFERS
3 INTRODUCTION
- 3.1 Study Assumptions & Market Definition
- 3.2 Scope of the Study
- 3.3 Research Methodology
4 KEY INDUSTRY TRENDS
- 4.1 Acreage Of Major Crop Types
- 4.1.1 Field Crops
- 4.1.2 Horticultural Crops
- 4.2 Average Nutrient Application Rates
- 4.2.1 Primary Nutrients
- 4.2.1.1 Field Crops
- 4.2.1.2 Horticultural Crops
- 4.2.1 Primary Nutrients
- 4.3 Regulatory Framework
- 4.4 Value Chain & Distribution Channel Analysis
5 MARKET SEGMENTATION (includes market size in Value in USD and Volume, Forecasts up to 2030 and analysis of growth prospects)
- 5.1 Coating Type
- 5.1.1 Polymer Coated
- 5.1.2 Polymer-Sulfur Coated
- 5.1.3 Others
- 5.2 Crop Type
- 5.2.1 Field Crops
- 5.2.2 Horticultural Crops
- 5.2.3 Turf & Ornamental
- 5.3 Region
- 5.3.1 Asia-Pacific
- 5.3.1.1 Australia
- 5.3.1.2 Bangladesh
- 5.3.1.3 China
- 5.3.1.4 India
- 5.3.1.5 Indonesia
- 5.3.1.6 Japan
- 5.3.1.7 Pakistan
- 5.3.1.8 Philippines
- 5.3.1.9 Thailand
- 5.3.1.10 Vietnam
- 5.3.1.11 Rest of Asia-Pacific
- 5.3.2 Europe
- 5.3.2.1 France
- 5.3.2.2 Germany
- 5.3.2.3 Italy
- 5.3.2.4 Netherlands
- 5.3.2.5 Russia
- 5.3.2.6 Spain
- 5.3.2.7 Ukraine
- 5.3.2.8 United Kingdom
- 5.3.2.9 Rest of Europe
- 5.3.3 Middle East & Africa
- 5.3.3.1 Nigeria
- 5.3.3.2 Saudi Arabia
- 5.3.3.3 South Africa
- 5.3.3.4 Turkey
- 5.3.3.5 Rest of Middle East & Africa
- 5.3.4 North America
- 5.3.4.1 Canada
- 5.3.4.2 Mexico
- 5.3.4.3 United States
- 5.3.4.4 Rest of North America
- 5.3.5 South America
- 5.3.5.1 Argentina
- 5.3.5.2 Brazil
- 5.3.5.3 Rest of South America
- 5.3.1 Asia-Pacific
6 COMPETITIVE LANDSCAPE
- 6.1 Key Strategic Moves
- 6.2 Market Share Analysis
- 6.3 Company Landscape
- 6.4 Company Profiles
- 6.4.1 Ekompany International BV (DeltaChem)
- 6.4.2 Grupa Azoty S.A. (Compo Expert)
- 6.4.3 Haifa Group
- 6.4.4 ICL Group Ltd
- 6.4.5 Kingenta Ecological Engineering Group Co., Ltd.
- 6.4.6 Mivena BV
- 6.4.7 New Mountain Capital (Florikan)
- 6.4.8 Nutrien Ltd.
7 KEY STRATEGIC QUESTIONS FOR FERTILIZER CEOS
8 APPENDIX
- 8.1 Global Overview
- 8.1.1 Overview
- 8.1.2 Porter's Five Forces Framework
- 8.1.3 Global Value Chain Analysis
- 8.1.4 Market Dynamics (DROs)
- 8.2 Sources & References
- 8.3 List of Tables & Figures
- 8.4 Primary Insights
- 8.5 Data Pack
- 8.6 Glossary of Terms
 控释肥料市场-全球产业规模、份额、趋势、机会和预测,按类型、最终用途、应用方式、地区和竞争格局划分,2020-2030年预测
 全球控释肥料(CRF)市场按类型、功能、产品等级、应用方法、最终用途和地区划分-预测至2030年
 缓释性肥市场按包覆类型、作物类型、释放期、养分类型、应用、最终用途和销售管道划分-2025-2032 年全球预测包衣肥料市场-全球产业规模、份额、趋势、机会和预测(按类型、作物类型、地区和竞争情况划分,2020-2030 年)控制释放液态氮市场按产品类型、包衣类型、形态、释放机制、施用方法、作物类型、最终用户和分销管道划分 - 全球预测 2025-2030
 全球硝化抑制剂及尿素酶抑制剂市场分析及预测(至2032年):依产品类型、营养类型、作物类型、施用方法、通路、最终用户及地区划分
 2025年全球控制释放肥市场报告
 2025-2033年控释肥料市场(按类型、形式、应用和地区)报告
 硝化抑制剂及脲酶抑制剂市场机会、成长动力、产业趋势分析及 2025 - 2034 年预测2032 年控制释放和缓释性肥市场预测:按类型、作物类型、应用类型和地区分類的全球分析